Cited by 107Alzheimer's disease research and treatmentsGenetics and Neurodevelopmental DisordersDementia and Cognitive Impairment Research

The DOI matches its Crossref record; 78 of the 78 references it cites were found in a registry or an index.

Discovery of autism/intellectual disability somatic mutations in Alzheimer’s brains: mutated ADNP cytoskeletal impairments and repair as a case study

Open access

Abstract

With Alzheimer’s disease (AD) exhibiting reduced ability of neural stem cell renewal, we hypothesized that de novo mutations controlling embryonic development, in the form of brain somatic mutations instigate the disease. A leading gene presenting heterozygous dominant de novo autism-intellectual disabilities (ID) causing mutations is activity-dependent neuroprotective protein (ADNP), with intact ADNP protecting against AD-tauopathy. We discovered a genomic autism ADNP mutation (c.2188C>T) in postmortem AD olfactory bulbs and hippocampi. RNA-Seq of olfactory bulbs also identified a novel ADNP hotspot mutation, c.2187_2188insA. Altogether, 665 mutations in 596 genes with 441 mutations in AD patients (389 genes, 38% AD—exclusive mutations) and 104 genes presenting disease-causing mutations (OMIM) were discovered. OMIM AD mutated genes converged on cytoskeletal mechanisms, autism and ID causing mutations (about 40% each). The number and average frequencies of AD-related mutations per subject were higher in AD subjects compared to controls. RNA-seq datamining (hippocampus, dorsolateral prefrontal cortex, fusiform gyrus and superior frontal gyrus—583 subjects) yielded similar results. Overlapping all tested brain areas identified unique and shared mutations, with ADNP singled out as a gene associated with autism/ID/AD and presenting several unique aging/AD mutations. The large fusiform gyrus library (117 subjects) with high sequencing coverage correlated the c.2187_2188insA ADNP mutation frequency to Braak stage (tauopathy) and showed more ADNP mutations in AD specimens. In cell cultures, the ADNP-derived snippet NAP inhibited mutated-ADNP-microtubule (MT) toxicity and enhanced Tau–MT association. We propose a paradigm-shifting concept in the perception of AD whereby accumulating mosaic somatic mutations promote brain pathology.

Overview

The claims and statistics of this paper haven’t been checked yet.

Run the check — free, no account needed. It reads the open-access text and checks the sources it cites.

A few free checks a day · papers already verified open instantly · results are public

Integrity signals

Registry

Crossref · 10.1038/s41380-019-0563-5

Cites

78 of 78 references verified0 citation errors · 0 not checkable

Statistics

Figures

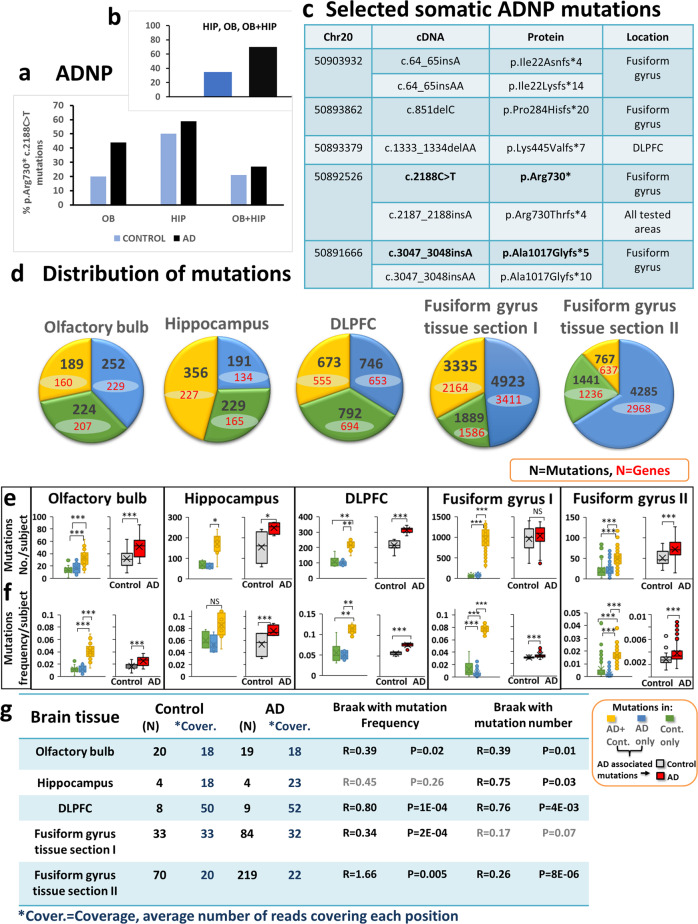
Fig. 1 ADNP c.2188C>T, p.Arg730* mutations/AD—multiple somatic mutations in multiple brain areas correlate with tauopathy. a, b Positive subjects who were found to carry the ADNP c.2188C>T, p.Arg730* mutations and negative cases who were found to be non-carriers. a Relative fractions of ADNP c.2188C>T, p.Arg730* mutation positive AD (black) and mutation positive controls (blue) were calculated, in each brain region (Table S1, including 2 borderline positives). OB—olfactory bulb and HIP—Hippocampus, results showed similar distribution in AD and control samples. b All mutation positives (OB, HIP, and OB + HIP), excluding borderline positives are shown (14/20; AD; 7/20 controls, Pearson Chi-Square, *P < 0.05). It should be noted that when logistic regression of morbidity as a function of the number of regions with mutations was performed, the result was insignificant. c RNA-seq identification of novel, tissue-associated ADNP-AD mutation, autism-related ADNP mutation are marked in bold. d Mutation analysis of RNA-seq variant calling of four postmortem brain areas: olfactory bulb (our own primary data), Hippocampus (GSE67333), Dorsolateral prefrontal cortex (DLPFC) (GSE53697) and Fusiform gyrus tissue section I (GSE95587) and Fusiform gyrus tissue section II (GSE GSE125583). The pie charts represent distribution of mutations into three different groups: controls (Cont.) only, AD only and both in AD + controls (AD + Cont.). The Box plots represent (e) mutation numbers per subject and (f) mutation frequencies per subject for each group in the four brain areas. Statistical analyses (Table S6b) were performed by the nonparametric Kruskal–Wallis test for the hippocampus and DLPFC and ANOVA for the olfactory bulb and the fusiform gyrus with post hoc Bonferroni for multiple comparisons. AD-associated mutations including AD only and AD + Cont. mutations: mutation numbers and mutation frequencies in AD subjects were compered with aging controls. Statistical analyses was done by T-Test for all calculated mutation frequencies and T-Test for olfactory bulb and fusiform gyrus and Mann–Whitney test for hippocampus and DLPFC for number of mutations per subject. Statistical significance is presented by * = P < 0.05, ** = P < 0.001, *** = P < 0.0001. g Spearman correlations of mutation numbers per subject and mutation frequencies per subject with Braak stage in control and AD subjects grouped together
Fig. 1 ADNP c.2188C>T, p.Arg730* mutations/AD—multiple somatic mutations in multiple brain areas correlate with tauopathy. a, b Positive subjects who were found to carry the ADNP c.2188C>T, p.Arg730* mutations and negative cases who were found to be non-carriers. a Relative fractions of ADNP c.2188C>T, p.Arg730* mutation positive AD (black) and mutation positive controls (blue) were calculated, in each brain region (Table S1, including 2 borderline positives). OB—olfactory bulb and HIP—Hippocampus, results showed similar distribution in AD and control samples. b All mutation positives (OB, HIP, and OB + HIP), excluding borderline positives are shown (14/20; AD; 7/20 controls, Pearson Chi-Square, *P < 0.05). It should be noted that when logistic regression of morbidity as a function of the number of regions with mutations was performed, the result was insignificant. c RNA-seq identification of novel, tissue-associated ADNP-AD mutation, autism-related ADNP mutation are marked in bold. d Mutation analysis of RNA-seq variant calling of four postmortem brain areas: olfactory bulb (our own primary data), Hippocampus (GSE67333), Dorsolateral prefrontal cortex (DLPFC) (GSE53697) and Fusiform gyrus tissue section I (GSE95587) and Fusiform gyrus tissue section II (GSE GSE125583). The pie charts represent distribution of mutations into three different groups: controls (Cont.) only, AD only and both in AD + controls (AD + Cont.). The Box plots represent (e) mutation numbers per subject and (f) mutation frequencies per subject for each group in the four brain areas. Statistical analyses (Table S6b) were performed by the nonparametric Kruskal–Wallis test for the hippocampus and DLPFC and ANOVA for the olfactory bulb and the fusiform gyrus with post hoc Bonferroni for multiple comparisons. AD-associated mutations including AD only and AD + Cont. mutations: mutation numbers and mutation frequencies in AD subjects were compered with aging controls. Statistical analyses was done by T-Test for all calculated mutation frequencies and T-Test for olfactory bulb and fusiform gyrus and Mann–Whitney test for hippocampus and DLPFC for number of mutations per subject. Statistical significance is presented by * = P < 0.05, ** = P < 0.001, *** = P < 0.0001. g Spearman correlations of mutation numbers per subject and mutation frequencies per subject with Braak stage in control and AD subjects grouped togetherCC BY · PubMed Central
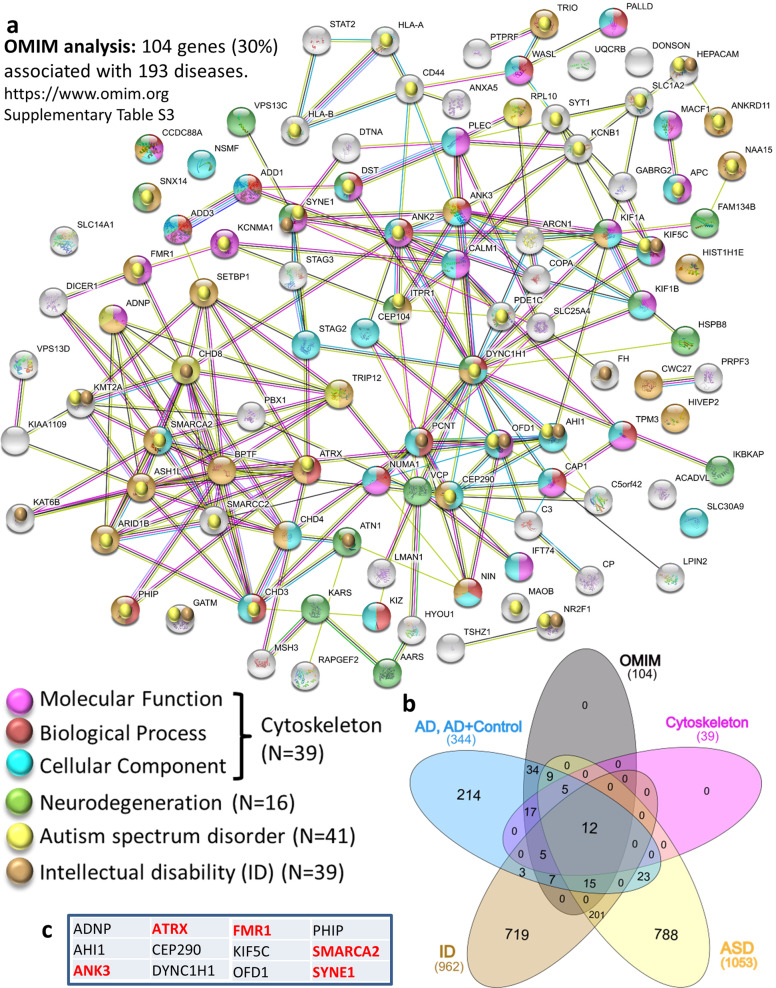
Fig. 2 Somatic mutations/AD—networks in the olfactory bulb (OB). a Interaction network by the STRING tool for 104 mutated genes with OMIM disease association. The comparisons were made with mutated genes, including AD specific + AD-control shared mutations. Results of variant calling from RNA-Seq from 39 samples of OB indicated GO molecular enrichment-Cytoskeletal protein binding (FDR = 2E-08) colored with light purple, GO Biological process-cytoskeletal enrichment-cytoskeleton organization (FDR = 2.4E-4) colored with red/brown. GO cellular component-cytoskeleton (FDR = 8.9E-8) colored with light blue. A total of 39 genes (38%) related to the cytoskeleton OMIM-identified mutated genes. b Venn graph (http://www.interactivenn.net/) identifying genes that are shared with Autism: https://gene.sfari.org/database/human-gene/ and ID: http://www.ccgenomics.cn/IDGenetics/gene.php?dataset=IDGD_gene_detail and http://gfuncpathdb.ucdenver.edu/iddrc/iddrc/data/IDgenelist_gsym.html.c Shared genes described in (b) are named in table (red, AD—only mutations). Precise description of the genes can be found in Table S10
Fig. 2 Somatic mutations/AD—networks in the olfactory bulb (OB). a Interaction network by the STRING tool for 104 mutated genes with OMIM disease association. The comparisons were made with mutated genes, including AD specific + AD-control shared mutations. Results of variant calling from RNA-Seq from 39 samples of OB indicated GO molecular enrichment-Cytoskeletal protein binding (FDR = 2E-08) colored with light purple, GO Biological process-cytoskeletal enrichment-cytoskeleton organization (FDR = 2.4E-4) colored with red/brown. GO cellular component-cytoskeleton (FDR = 8.9E-8) colored with light blue. A total of 39 genes (38%) related to the cytoskeleton OMIM-identified mutated genes. b Venn graph (http://www.interactivenn.net/) identifying genes that are shared with Autism: https://gene.sfari.org/database/human-gene/ and ID: http://www.ccgenomics.cn/IDGenetics/gene.php?dataset=IDGD_gene_detail and http://gfuncpathdb.ucdenver.edu/iddrc/iddrc/data/IDgenelist_gsym.html.c Shared genes described in (b) are named in table (red, AD—only mutations). Precise description of the genes can be found in Table S10CC BY · PubMed Central
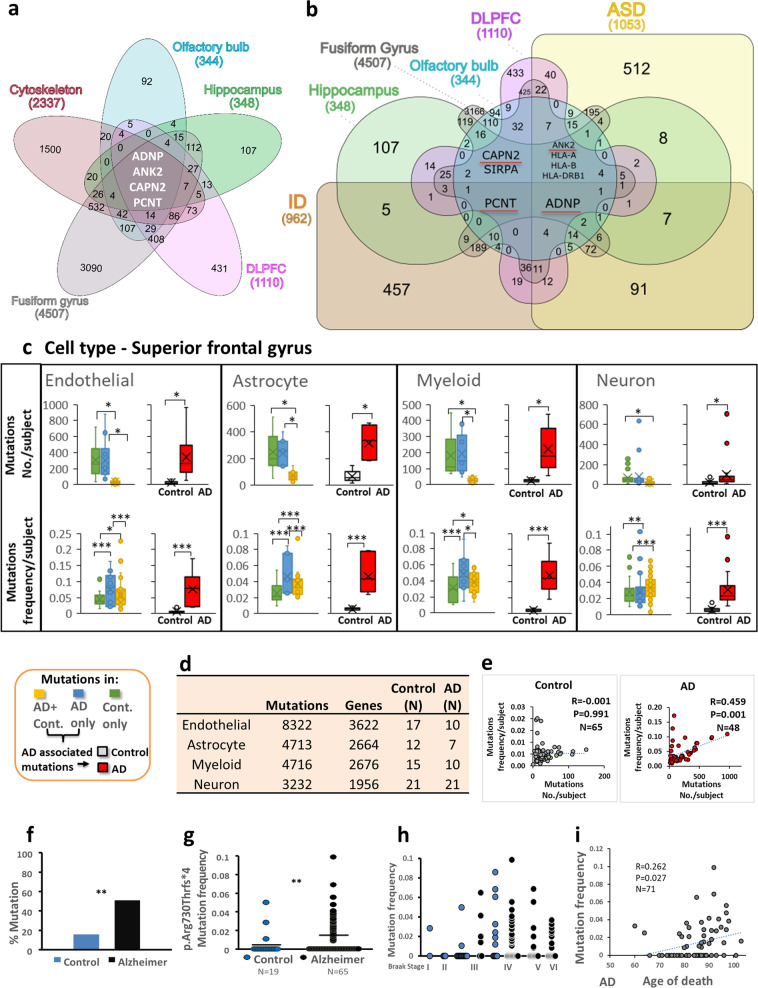
Fig. 3 ADNP mutations are shared by all tested brain regions and cytoskeletal proteins/ID/autism, ADNP c.2187_2188insA correlate with AD tauopathy. a, b Venn graphs (http://www.interactivenn.net/) showing comparisons of mutated genes, including AD specific+ AD-control shared mutations, from four postmortem brain areas: olfactory bulb, Hippocampus (GSE67333), dorsolateral prefrontal cortex (DLPFC) (GSE53697) and fusiform gyrus (GSE95587) shared with a cytoskeletal genes (GO:020954 and GO:020801), b Autism and ID genes. Note, the numbers of mutated genes are lower than the numbers depicted in Fig. 1d as there are shared genes between AD-specific and AD+ controls shared mutations, however, the mutations/gene are unique in the two different groups. c Mutation analysis of RNA-seq variant calling of postmortem superior frontal gyrus from different cell types: Endothelial (CD31+), Astrocyte (GFAP+) Myeloid (CD11B+) and Neuron (NeuN+) (GSE125050). The mutations were devided into three different groups: Controls (Cont.) only, AD only and both in AD+ controls (AD+Cont.). The Box plots represent number of mutations per subject and frequencies of mutations per subject for each group in all cell types. AD-associated mutations including AD only and AD+Cont. mutations: mutation numbers and mutation frequencies in AD subjects were compered with controls. Statistical analyses (Table S12b) were performed by the nonparametric Kruskal–Wallis test for mutation numbers with post hoc Bonferroni for multiple comparisons. For all mutation frequencies ANOVA were performed with post hoc Bonferroni for multiple comparisons. AD-associated mutations including AD only and AD+Cont. mutations: statistical analyses were done by T-Test for all calculated mutation frequencies and for the average mutations number per subject. The Kolmogorov–Smirnov test of normality was used to test normal distribution. Statistical significance is presented by * = P < 0.05, ** = P < 0.001, *** = P < 0.0001. d The table represents the distribution of mutations in different cell types. e Pearson correlations of mutation numbers per subject with mutation frequencies per subject in control and AD subjects in all cell types grouped together are shown. f Percentage of ADNP c.2187_2188insA, p.Arg730Thrfs*4 mutation positive AD (black) and mutation positive controls (blue) in the respective tested populations were calculated showing significantly higher mutation frequency in AD samples (Braak stage IV–VI) compared to age-matched controls (Braak stage I-III) (Pearson Chi-Square, P = 0.007). Positive cases are subjects who were found to carry the c.2187_2188insA, p.Arg730Thrfs*4, in the GEO database GSE95587 (postmortem fusiform gyrus tissue sections, see Fig. S8). g c.2187_2188insA, p.Arg730Thrfs*4 mutation frequency to the intact ADNP sequence within the cDNA reads, shows a significant differences between controls (blue) and AD (black) samples, one tailed Mann–Whitney Test, P = 0.006. h ADNP c.2187_2188insA, p.Arg730Thrfs*4 mutation positive showing mutation frequency to intact ADNP (as in g) for all the different Braak stages (control—blue, AD-black) with increased mutation frequency in the control correlated with increased Braak stage, Spearman correlation, R = 0.394, P = 0.028. i Pearson correlation between ADNP mutation ratio and age of death in AD
Fig. 3 ADNP mutations are shared by all tested brain regions and cytoskeletal proteins/ID/autism, ADNP c.2187_2188insA correlate with AD tauopathy. a, b Venn graphs (http://www.interactivenn.net/) showing comparisons of mutated genes, including AD specific+ AD-control shared mutations, from four postmortem brain areas: olfactory bulb, Hippocampus (GSE67333), dorsolateral prefrontal cortex (DLPFC) (GSE53697) and fusiform gyrus (GSE95587) shared with a cytoskeletal genes (GO:020954 and GO:020801), b Autism and ID genes. Note, the numbers of mutated genes are lower than the numbers depicted in Fig. 1d as there are shared genes between AD-specific and AD+ controls shared mutations, however, the mutations/gene are unique in the two different groups. c Mutation analysis of RNA-seq variant calling of postmortem superior frontal gyrus from different cell types: Endothelial (CD31+), Astrocyte (GFAP+) Myeloid (CD11B+) and Neuron (NeuN+) (GSE125050). The mutations were devided into three different groups: Controls (Cont.) only, AD only and both in AD+ controls (AD+Cont.). The Box plots represent number of mutations per subject and frequencies of mutations per subject for each group in all cell types. AD-associated mutations including AD only and AD+Cont. mutations: mutation numbers and mutation frequencies in AD subjects were compered with controls. Statistical analyses (Table S12b) were performed by the nonparametric Kruskal–Wallis test for mutation numbers with post hoc Bonferroni for multiple comparisons. For all mutation frequencies ANOVA were performed with post hoc Bonferroni for multiple comparisons. AD-associated mutations including AD only and AD+Cont. mutations: statistical analyses were done by T-Test for all calculated mutation frequencies and for the average mutations number per subject. The Kolmogorov–Smirnov test of normality was used to test normal distribution. Statistical significance is presented by * = P < 0.05, ** = P < 0.001, *** = P < 0.0001. d The table represents the distribution of mutations in different cell types. e Pearson correlations of mutation numbers per subject with mutation frequencies per subject in control and AD subjects in all cell types grouped together are shown. f Percentage of ADNP c.2187_2188insA, p.Arg730Thrfs*4 mutation positive AD (black) and mutation positive controls (blue) in the respective tested populations were calculated showing significantly higher mutation frequency in AD samples (Braak stage IV–VI) compared to age-matched controls (Braak stage I-III) (Pearson Chi-Square, P = 0.007). Positive cases are subjects who were found to carry the c.2187_2188insA, p.Arg730Thrfs*4, in the GEO database GSE95587 (postmortem fusiform gyrus tissue sections, see Fig. S8). g c.2187_2188insA, p.Arg730Thrfs*4 mutation frequency to the intact ADNP sequence within the cDNA reads, shows a significant differences between controls (blue) and AD (black) samples, one tailed Mann–Whitney Test, P = 0.006. h ADNP c.2187_2188insA, p.Arg730Thrfs*4 mutation positive showing mutation frequency to intact ADNP (as in g) for all the different Braak stages (control—blue, AD-black) with increased mutation frequency in the control correlated with increased Braak stage, Spearman correlation, R = 0.394, P = 0.028. i Pearson correlation between ADNP mutation ratio and age of death in ADCC BY · PubMed Central
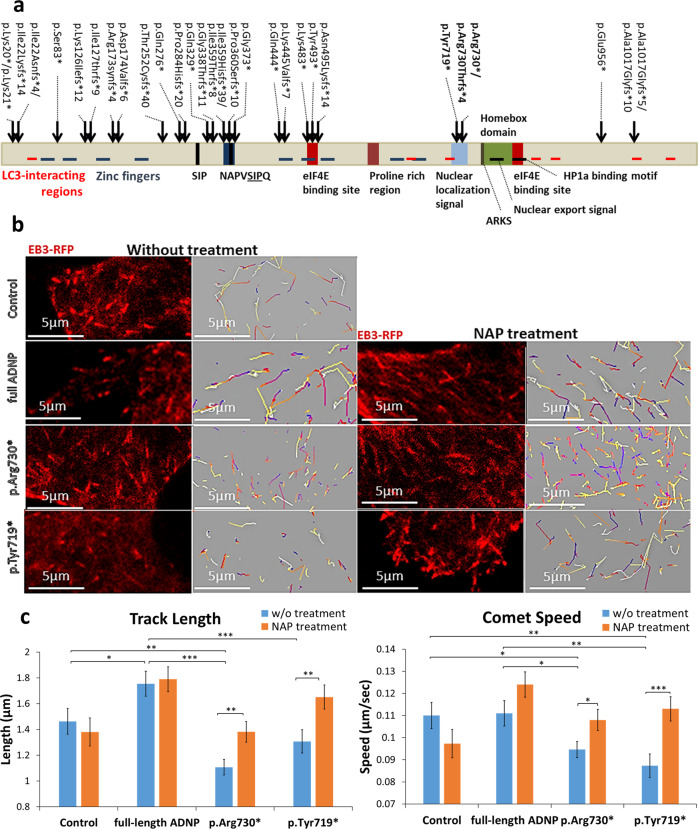
Fig. 4 ADNP mutations inhibit MT dynamics, NAP protects. a Location of functional protein regions are depicted along full-length human ADNP coding sequence. The arrows point out all ADNP mutations identified in the current study, including the mutations that were examined below. The figure was constructed according previously published data [4–7, 11, 19, 21, 25, 53, 71–75]. b Live imaging of N1E-115 cells expressing EB3-RFP with GFP conjugated to full-length ADNP or truncated ADNP proteins with or without NAP treatment (10−12M) for 4 h. Transfection with backbone plasmid (pEGFP-C1) expressing non-conjugated GFP, was performed as a control. Time-lapse images were automatically captured every 3 s during a 1 min using the Leica LAS AF software. Tracks of EB3 comet-like structures presented as colored lines and were obtained by the Imaris software. c Graphs represent quantification of the average track length and comet speed. Data from three independent experiments were collected in unbiased fashion by the Imaris software, and statistical analysis (Table S14) of the data was performed by Two-Way ANOVA (SigmaPlot11). Statistical significance is presented by *P < 0.05, **P < 0.01, ***P < 0.001. Control n = 26; Control + NAP n = 11; full-length ADNP n = 28; full-length ADNP + NAP n = 28; p.Arg730* n = 43; p.Arg730* + NAP n = 20; p.Tyr719* n = 32; p.Tyr719* + NAP n = 30
Fig. 4 ADNP mutations inhibit MT dynamics, NAP protects. a Location of functional protein regions are depicted along full-length human ADNP coding sequence. The arrows point out all ADNP mutations identified in the current study, including the mutations that were examined below. The figure was constructed according previously published data [4–7, 11, 19, 21, 25, 53, 71–75]. b Live imaging of N1E-115 cells expressing EB3-RFP with GFP conjugated to full-length ADNP or truncated ADNP proteins with or without NAP treatment (10−12M) for 4 h. Transfection with backbone plasmid (pEGFP-C1) expressing non-conjugated GFP, was performed as a control. Time-lapse images were automatically captured every 3 s during a 1 min using the Leica LAS AF software. Tracks of EB3 comet-like structures presented as colored lines and were obtained by the Imaris software. c Graphs represent quantification of the average track length and comet speed. Data from three independent experiments were collected in unbiased fashion by the Imaris software, and statistical analysis (Table S14) of the data was performed by Two-Way ANOVA (SigmaPlot11). Statistical significance is presented by *P < 0.05, **P < 0.01, ***P < 0.001. Control n = 26; Control + NAP n = 11; full-length ADNP n = 28; full-length ADNP + NAP n = 28; p.Arg730* n = 43; p.Arg730* + NAP n = 20; p.Tyr719* n = 32; p.Tyr719* + NAP n = 30CC BY · PubMed Central
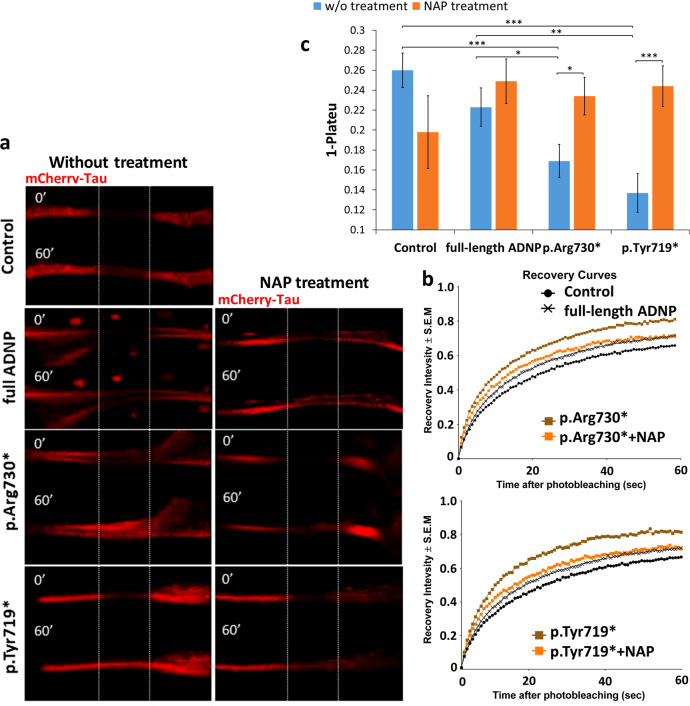
Fig. 5 ADNP mutations destabilize Tau–MT interactions, NAP protects. a Representative images of photobleaching and fluorescence recovery of mCherry-Tau in differentiated N1E-115 cells co-transfected with plasmids expressing mCherry-Tau and GFP conjugated to full-length ADNP or truncated ADNP proteins with or without NAP treatment (10−12M) for 4 h. Transfection with backbone plasmid (pEGFP-C1) expressing non-conjugated GFP, was performed as a control. b FRAP recovery curves of normalized data. c Graph represents averages of the fitted data of immobile fractions (from three independent experiments). Normalized FRAP data were fitted with two-exponential functions (GraphPad Prism 6) and statistical analyses (Table S14) were done by Two-Way ANOVA (SigmaPlot 11). Statistical significance is presented by *P < 0.05; **P < 0.01;*** P < 0.001. Control n = 45; Control + NAP n = 10; full-length ADNP n = 36; full-length ADNP + NAP n = 47; p.Arg730* n = 47; p.Arg730* + NAP n = 37; p.Tyr719* n = 35; p.Tyr719* + NAP n = 42
Fig. 5 ADNP mutations destabilize Tau–MT interactions, NAP protects. a Representative images of photobleaching and fluorescence recovery of mCherry-Tau in differentiated N1E-115 cells co-transfected with plasmids expressing mCherry-Tau and GFP conjugated to full-length ADNP or truncated ADNP proteins with or without NAP treatment (10−12M) for 4 h. Transfection with backbone plasmid (pEGFP-C1) expressing non-conjugated GFP, was performed as a control. b FRAP recovery curves of normalized data. c Graph represents averages of the fitted data of immobile fractions (from three independent experiments). Normalized FRAP data were fitted with two-exponential functions (GraphPad Prism 6) and statistical analyses (Table S14) were done by Two-Way ANOVA (SigmaPlot 11). Statistical significance is presented by *P < 0.05; **P < 0.01;*** P < 0.001. Control n = 45; Control + NAP n = 10; full-length ADNP n = 36; full-length ADNP + NAP n = 47; p.Arg730* n = 47; p.Arg730* + NAP n = 37; p.Tyr719* n = 35; p.Tyr719* + NAP n = 42CC BY · PubMed Central

Verification

Claims the paper makes

The claims and statistics of this paper haven’t been checked yet.

Run the check — free, no account needed. It reads the open-access text and checks the sources it cites.

A few free checks a day · papers already verified open instantly · results are public

Claims other papers make about this one

Each is checked against this paper’s own text: does it say what the citing paper says it does?

Self-check

Percentages, sums and reported differences re-computed from the paper’s own numbers.

The self-check needs the paper’s full text.

Citations

Cites

Show all 78 references

Research works printed but not linked: 1

  1. Gozes I, Levine J. Neuroprotection in autism, schizophrenia and Alzheimer's disease. 1st ed; Academic Press, Elsevier; 2019. p. 322.

Cited by

Sorted by citations

Items 101–107 of 107

Metadata

Authors
Ivashko-Pachima, Y., Hadar, A., Grigg, I., Korenková, V., Kapitansky, O., Karmon, G., Gershovits, M., Sayas, C. L., Kooy, R. F., Attems, J., Gurwitz, D., & Gozes, I.
Affiliations
  • Tel Aviv University (IL)
  • Czech Academy of Sciences (CZ)
  • Weizmann Institute of Science (IL)
  • Universidad de La Laguna (ES)
  • University of Antwerp (BE)
  • Newcastle University (GB)
Corresponding author
Gozes, Illana
Venue
Molecular Psychiatry
Published
2019-10-30
Volume
26
Issue
5
Pages
1619-1633
ISSN
  • 1359-4184 (ISSN-L)
  • 1476-5578
OpenAlex
W2982336643
Cited by
107
References
78
Citations by year
2026: 10 · 2025: 7 · 2024: 31 · 2023: 13 · 2022: 17 · 2021: 16 · 2020: 13
FWCI
7.89
Type
journal article
Language
en
Open access
Locations
  • Molecular Psychiatry (publishedVersion, cc-by)
  • PubMed Central (publishedVersion, cc-by)
  • PubMed (publishedVersion)
  • Newcastle University ePrints (Newcastle Univesity) (cc-by)
Funders
  • Fundación Alicia Koplowitz
  • Alzheimer's Society
  • National Institute for Health and Care Research
  • Newcastle University (G0400074)
  • Ministerstvo Školství, Mládeže a Tělovýchovy (CZ1.05/1.1.00/02.0109, RVO:86652036, CZ.1.05, LQ1604 NPU II, 86652036, LQ1604)
  • Israel Science Foundation (ISF 1424/14, 1424/14)
  • Tel Aviv University
  • Medical Research Council (G0400074)
  • European Regional Development Fund (CZ.1.05/1.100/02.0109, LQ1604, 86652036)
  • NIHR Newcastle Biomedical Research Centre
Topics
  • Life Sciences › Neuroscience › Cellular and Molecular Neuroscience › Alzheimer's disease research and treatments
  • Life Sciences › Biochemistry, Genetics and Molecular Biology › Genetics › Genetics and Neurodevelopmental Disorders
  • Health Sciences › Medicine › Psychiatry and Mental health › Dementia and Cognitive Impairment Research
Keywords
Alzheimer's disease, somatic mutations, ADNP, autism spectrum disorder, intellectual disability, de novo mutations, microtubules, tauopathy, olfactory bulb, hippocampus, NAP peptide, Braak stages
MeSH terms
Alzheimer Disease, Autistic Disorder, Brain, Humans, Intellectual Disability, Mutation, Nerve Tissue Proteins, Homeodomain Proteins

About these checks

Registry, retraction, Cites and statistics results are computed, not judged, with one exception: a printed reference that no index lists is read once by a model before it counts as a citation error. Claims are extracted by a model and kept only when their quote appears verbatim in the text; each cited source is then checked, with a model’s help, for whether it says what the claim relies on. Those verdicts can be wrong — read the claim’s quote and the cited source before relying on one.

Statistics and arithmetic are recomputed, not judged.

Confidence bands are shown only for fields calibrated on our annotated test set. None is calibrated yet, so no band is shown.

What counts as a claim ›How we measure confidence ›How we check this ›

Are you an author, or do you see a problem with this page? Request a review