

The DOI matches its Crossref record; 4 of the 4 references it cites were found in a registry or an index.
Treating ICB-resistant cancer by inhibiting PD-L1 via DHHC3 degradation induced by cell penetrating peptide-induced chimera conjugates
Published version of a preprint
Abstract
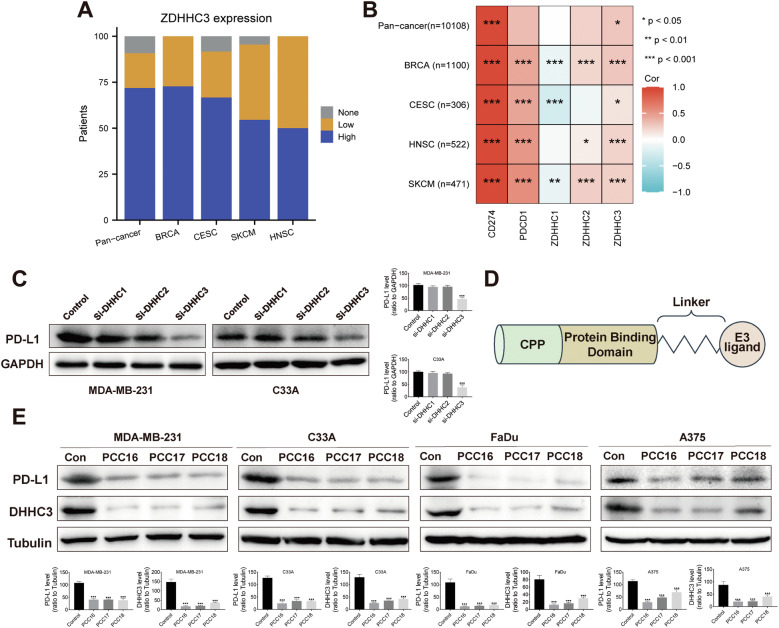
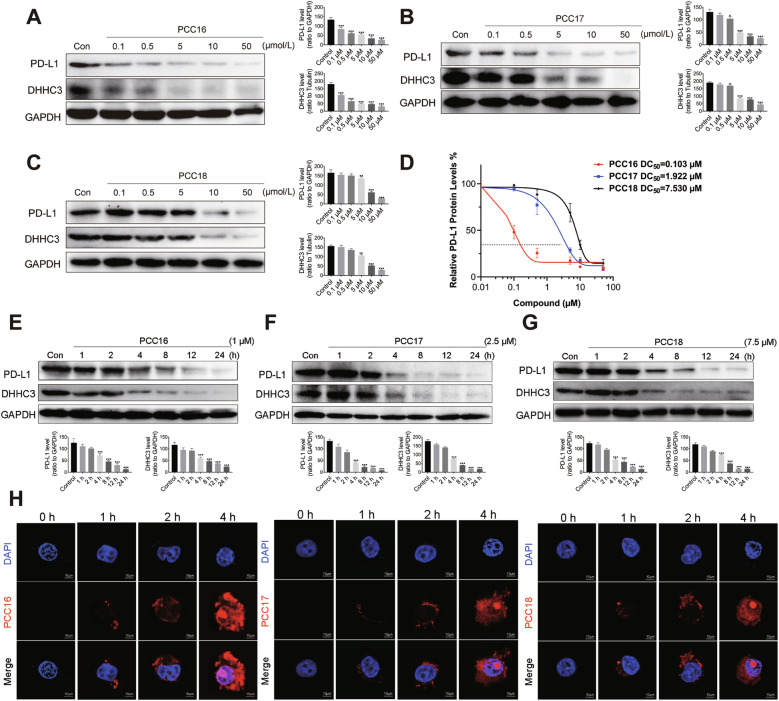
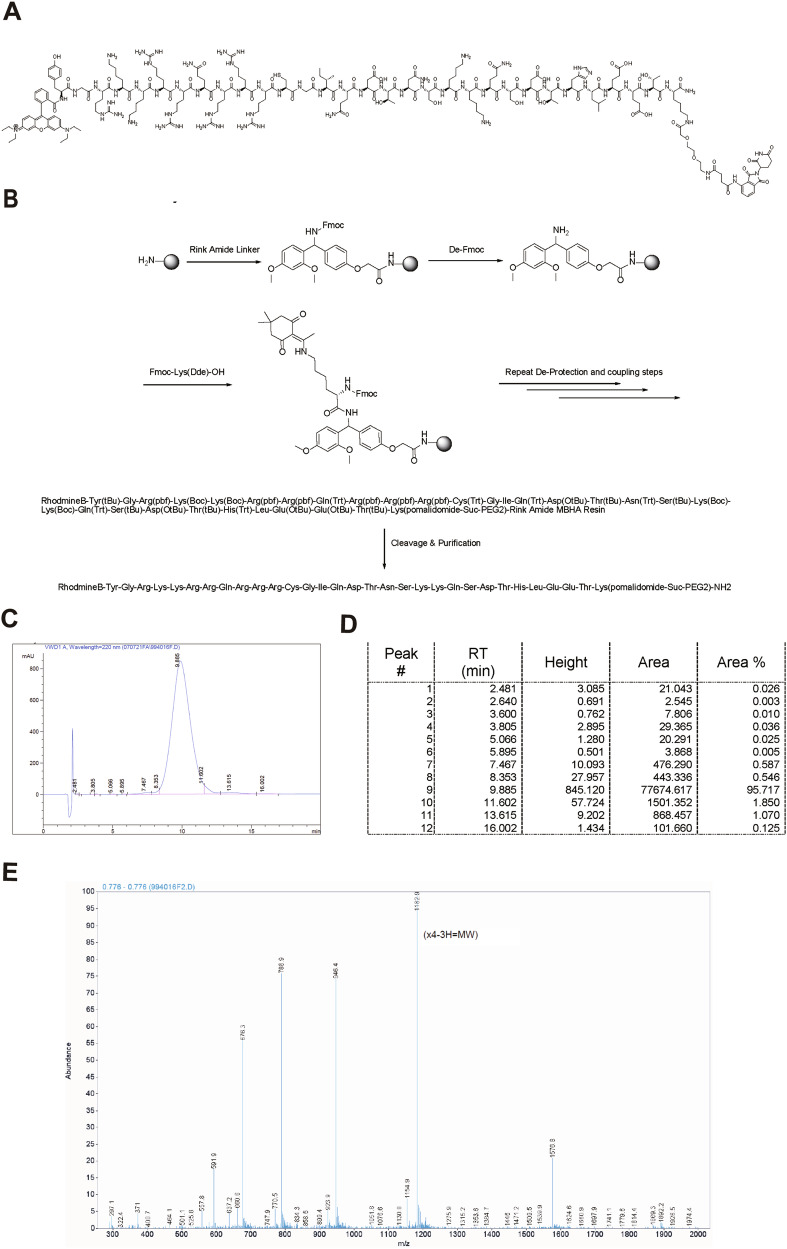
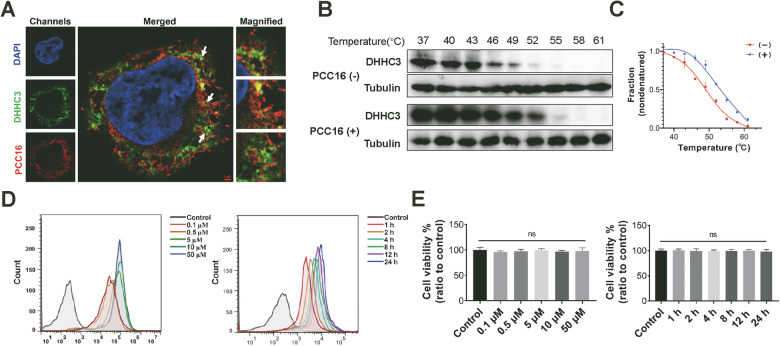
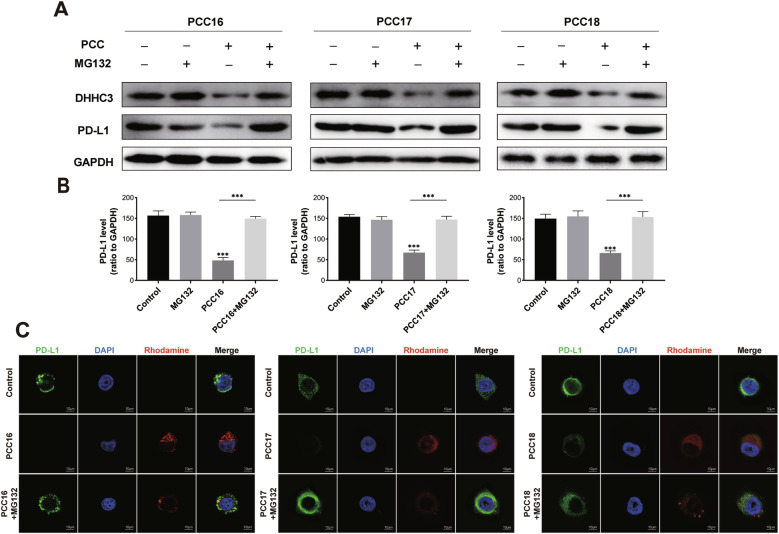
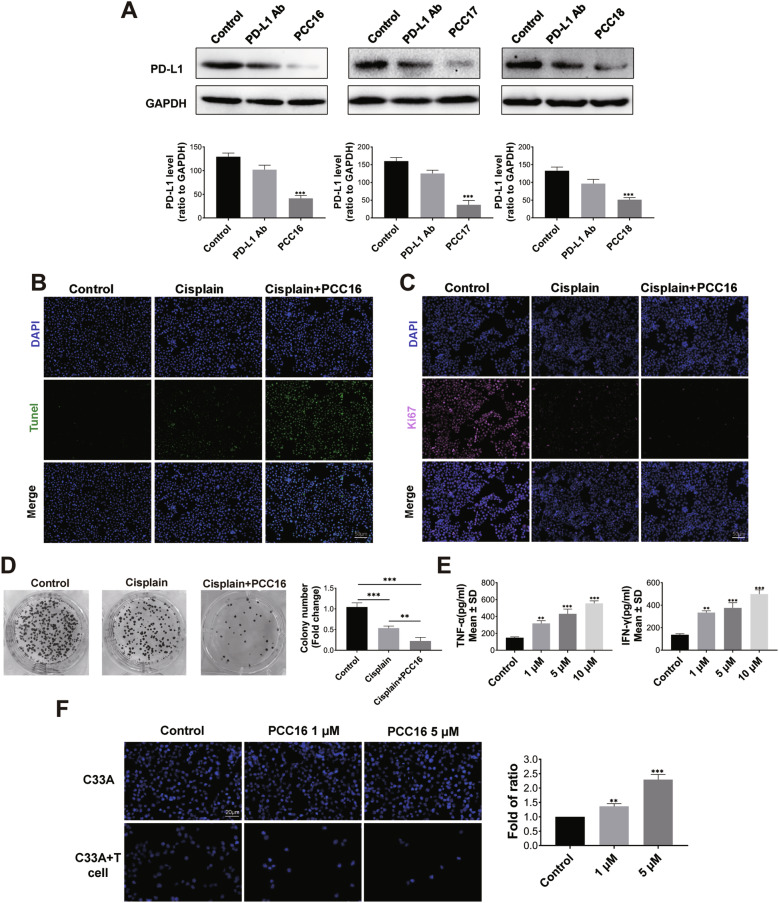
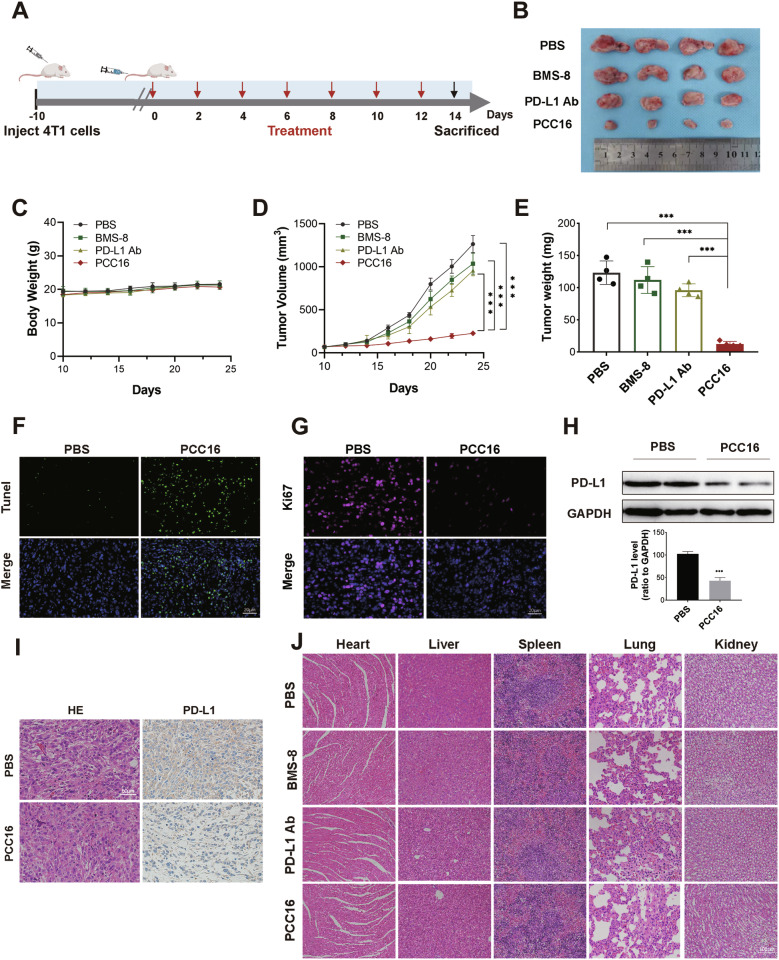
The current selection of ligands for both proteins of interest (POI) and E3 ubiquitin ligase significantly restricts the scope of targeted protein degradation (TPD) technologies. This study introduces cell-penetrating peptide-induced chimera conjugates (cp-PCCs) targeting the DHHC3 enzyme involved in PD-L1 palmitoylation. This approach disrupts PD-L1’s immunosuppressive function, enhancing anti-tumor immunity. We developed cp-PCCs to degrade DHHC3, directly linking DHHC3-mediated PD-L1 palmitoylation to PD-L1 stability on tumor cells. Our research utilized both in vitro assays and in vivo experiments in immune checkpoint blockade-resistant mouse models. We focused on a CRBN-based cp-PCC named PCC16, which demonstrated a DC50 of 102 nmol for DHHC3 degradation and significantly reduced PD-L1 levels. In resistant models, PCC16 not only robustly downregulated PD-L1 but also exhibited substantial anti-tumor activity in vivo without significant toxicity. This outperformed traditional inhibitors, showcasing the potential of cp-PCC technology to bypass current PROTAC limitations. Our findings suggest that cp-PCCs offer a promising method for targeting PD-L1 through DHHC3 inhibition and support their continued exploration as a versatile tool in cancer immunotherapy, especially for tumors resistant to standard treatments.
Overview
The claims and statistics of this paper haven’t been checked yet.
Run the check — free, no account needed. It reads the open-access text and checks the sources it cites.
Integrity signals
Registry
Cites
Statistics
Figures
Verification
Claims the paper makes
The claims and statistics of this paper haven’t been checked yet.
Run the check — free, no account needed. It reads the open-access text and checks the sources it cites.
Claims other papers make about this one
Each is checked against this paper’s own text: does it say what the citing paper says it does?
In the citing paper
“A CPP-induced chimera (cpPCC) recruits CRBN to degrade DHHC3 and indirectly destabilize PD-L1; the lead PCC16 achieved DC50 ~ 0.103 μM in C33A cells and reduced tumor weight to 10.1% of the PBS-treated control in ICB-resistant 4T1 xenografts, outperforming BMS-8 (90.8% of control) and a PD-L1 monoclonal antibody (77.9% of control), as well as small-molecule inhibitor [86].”
From Overcoming tumor microenvironment barriers: transformable and bioinspired nanomedicine strategies for deep tumor penetration (2026) · cites this paper as [86]
Self-check
Percentages, sums and reported differences re-computed from the paper’s own numbers.
The self-check needs the paper’s full text.
Citations
Cites
Tumor mutational burden and response rate to PD-1 inhibition
Yarchoan, M., Hopkins, A., & Jaffee, E. M. (2017) · New England Journal of Medicine · doi:10.1056/nejmc1713444 · Cited by 3,230
Top 10 Challenges in Cancer Immunotherapy
Hegde, P. S., & Chen, D. S. (2020) · Immunity · doi:10.1016/j.immuni.2019.12.011 · Cited by 2,238
Gene disruption by cell-penetrating peptide-mediated delivery of Cas9 protein and guide RNA
Ramakrishna, S., Kwaku Dad, A.-B., Beloor, J., Gopalappa, R., Lee, S.-K., & Kim, H. (2014) · Genome Research · doi:10.1101/gr.171264.113 · Cited by 655
Regulatory mechanisms of PD-L1 expression in cancer cells
Shi, Y. (2018) · Cancer Immunology, Immunotherapy · doi:10.1007/s00262-018-2226-9 · Cited by 92
Self-citation
Research works printed but not linked: 46
- Zhang YD, Cui QL, Xu MM, Liu D, Yao SZ, Chen M. Current Advances in PD-1/PD-L1 Blockade in Recurrent Epithelial Ovarian Cancer. Front Immunol. 2022;13:901772. · DOI
- Sun Q, Hong Z, Zhang C, Wang L, Han Z, Ma D. Immune checkpoint therapy for solid tumours: clinical dilemmas and future trends. Signal Transduct Target Ther. 2023;8:320. · DOI · Paper page
- Cha JH, Chan LC, Li CW, Hsu JL, Hung MC. Mechanisms Controlling PD-L1 Expression in Cancer. Mol Cell. 2019;76:359–70. · DOI
- Liu J, Chen Z, Li Y, Zhao W, Wu J, Zhang Z. PD-1/PD-L1 Checkpoint Inhibitors in Tumor Immunotherapy. Front Pharm. 2021;12:731798. · DOI
- Fritz JM, Lenardo MJ. Development of immune checkpoint therapy for cancer. J Exp Med. 2019;216:1244–54. · DOI
- Kim MJ, Kim K, Park HJ, Kim GR, Hong KH, Oh JH, et al. Deletion of PD-1 destabilizes the lineage identity and metabolic fitness of tumor-infiltrating regulatory T cells. Nat Immunol. 2023;24:148–61. · DOI · Paper page
- Pu Y, Ji Q. Tumor-Associated Macrophages Regulate PD-1/PD-L1 Immunosuppression. Front Immunol. 2022;13:874589. · DOI
- Sun JY, Zhang D, Wu S, Xu M, Zhou X, Lu XJ, et al. Resistance to PD-1/PD-L1 blockade cancer immunotherapy: mechanisms, predictive factors, and future perspectives. Biomark Res. 2020;8:35. · DOI
- Jiang X, Wang J, Deng X, Xiong F, Ge J, Xiang B, et al. Role of the tumor microenvironment in PD-L1/PD-1-mediated tumor immune escape. Mol Cancer. 2019;18:10. · DOI
- Betof Warner A, Palmer JS, Shoushtari AN, Goldman DA, Panageas KS, Hayes SA, et al. Long-Term Outcomes and Responses to Retreatment in Patients With Melanoma Treated With PD-1 Blockade. J Clin Oncol. 2020;38:1655–63. · DOI
- Cohen EEW, Soulieres D, Le Tourneau C, Dinis J, Licitra L, Ahn MJ, et al. Pembrolizumab versus methotrexate, docetaxel, or cetuximab for recurrent or metastatic head-and-neck squamous cell carcinoma (KEYNOTE-040): a randomised, open-label, phase 3 study. Lancet. 2019;393:156–67. · DOI
- Saglam O, Conejo-Garcia J. PD-1/PD-L1 immune checkpoint inhibitors in advanced cervical cancer. Integr Cancer Sci Ther. 2018;5. https://doi.org/10.15761/ICST.1000272. · DOI
- O’Sullivan H, Collins D, O’Reilly S. Atezolizumab and Nab-Paclitaxel in Advanced Triple-Negative Breast Cancer. N Engl J Med. 2019;380:986.
- Kong X, Lu P, Liu C, Guo Y, Yang Y, Peng Y, et al. A combination of PD‑1/PD‑L1 inhibitors: The prospect of overcoming the weakness of tumor immunotherapy (Review). Mol Med Rep. 2021;23:362. · DOI
- Yang N, Kong B, Zhu ZH, Huang F, Zhang LL, Lu T, et al. Recent advances in targeted protein degraders as potential therapeutic agents. Mol Divers. 2024:28:309–33. · DOI
- Li X, Song YC. Proteolysis-targeting chimera (PROTAC) for targeted protein degradation and cancer therapy. J Hematol Oncol. 2020;13:50. · DOI
- Zhao HY, Xin M, Zhang SQ. Progress of small molecules for targeted protein degradation: PROTACs and other technologies. Drug Dev Res. 2023;84:337–94. · DOI
- Liu Z, Hu M, Yang Y, Du C, Zhou H, Liu C, et al. An overview of PROTACs: a promising drug discovery paradigm. Mol Biomed. 2022;3:46. · DOI
- He Y, Khan S, Huo Z, Lv D, Zhang X, Liu X, et al. Proteolysis targeting chimeras (PROTACs) are emerging therapeutics for hematologic malignancies. J Hematol Oncol. 2020;13:103. · DOI · Paper page
- Ishida T, Ciulli A. E3 Ligase Ligands for PROTACs: How They Were Found and How to Discover New Ones. Slas Discov. 2021;26:484–502. · DOI
- Dale B, Cheng M, Park KS, Kaniskan HÜ, Xiong Y, Jin J. Advancing targeted protein degradation for cancer therapy. Nat Rev Cancer. 2021;21:638–54. · DOI
- Shen FF, Dassama LMK. Opportunities and challenges of protein-based targeted protein degradation. Chem Sci. 2023;14:8433–47. · DOI
- Scognamiglio PL, Di Natale C, Perretta G, Marasco D. From Peptides to Small Molecules: An Intriguing but Intricated Way to New Drugs. Curr Med Chem. 2013;20:3803–17. · DOI
- Sakamoto KM, Kim KB, Kumagai A, Mercurio F, Crews CM, Deshaies RJ. Protacs: Chimeric molecules that target proteins to the Skp1-Cullin-F box complex for ubiquitination and degradation. Proc Natl Acad Sci USA. 2001;98:8554–9. · DOI · Paper page
- Bricelj A, Steinebach C, Kuchta R, Gutschow M, Sosic I. E3 Ligase Ligands in Successful PROTACs: An Overview of Syntheses and Linker Attachment Points. Front Chem. 2021;9:707317. · DOI
- Jiang HR, Xiong H, Gu SX, Wang ML. E3 ligase ligand optimization of Clinical PROTACs. Front Chem. 2023;11:1098331. · DOI
- Shi YY, Dong DR, Fan G, Dai MY, Liu M. A cyclic peptide-based PROTAC induces intracellular degradation of palmitoyltransferase and potently decreases PD-L1 expression in human cervical cancer cells. Front Immunol. 2023;14:1237964. · DOI
- Shi YY, Wang AJ, Liu XL, Dai MY, Cai HB. Stapled peptide PROTAC induced significantly greater anti-PD-L1 effects than inhibitor in human cervical cancer cells. Front Immunol. 2023;14:1193222. · DOI
- Qu J, Ren XX, Xue FQ, He Y, Zhang RH, Zheng Y, et al. Specific Knockdown of α-Synuclein by Peptide-Directed Proteasome Degradation Rescued Its Associated Neurotoxicity. Cell Chem Biol. 2020;27:751. · DOI
- Chu TT, Gao N, Li QQ, Chen PG, Yang XF, Chen YX, et al. Specific Knockdown of Endogenous Tau Protein by Peptide-Directed Ubiquitin-Proteasome Degradation. Cell Chem Biol. 2016;23:453–61. · DOI · Paper page
- Hameed DS, Sapmaz A, Gjonaj L, Merkx R, Ovaa H. Enhanced Delivery of Synthetic Labelled Ubiquitin into Live Cells by Using Next-Generation Ub-TAT Conjugates. Chembiochem. 2018;19:2553–7. · DOI
- Frankel AD, Pabo CO. Cellular uptake of the tat protein from human immunodeficiency virus. Cell. 1988;55:1189–93. · DOI
- Kardani K, Milani A, Bolhassani SHS. A. Cell penetrating peptides: the potent multi-cargo intracellular carriers. Expert Opin Drug Deliv. 2019;16:1227–58. · DOI
- Ziegler A, Nervi P, Dürrenberger M, Seelig J. The cationic cell-penetrating peptide Cpp derived from the HIV-1 protein TAT is rapidly transported into living fibroblasts:: Optical, biophysical, and metabolic evidence. Biochemistry. 2005;44:138–48. · DOI
- Lin J, Jin J, Shen Y, Zhang L, Gong G, Bian H, et al. Emerging protein degradation strategies: expanding the scope to extracellular and membrane proteins. Theranostics. 2021;11:8337–49. · DOI
- Sharma C, Hemler ME. Antioxidant and Anticancer Functions of Protein Acyltransferase DHHC3. Antioxidant. 2022;11:960. · DOI
- Yao H, Lan J, Li CS, Shi HB, Brosseau JP, Wang HB, et al. Inhibiting PD-L1 palmitoylation enhances T-cell immune responses against tumours. Nat Biomed Eng. 2019;3:306–17. · DOI
- Huang X, Wu F, Ye J, Wang L, Wang X, Li X, et al. Expanding the horizons of targeted protein degradation: A non-small molecule perspective. Acta Pharm Sin B. 2024;14:2402–27. · DOI
- Dai MY, Shi YY, Wang AJ, Liu XL, Liu M, Cai HB. High-potency PD-1/PD-L1 degradation induced by Peptide-PROTAC in human cancer cells. Cell Death Dis. 2022;13:924. · DOI
- Lu B, Ye J. Commentary: PROTACs make undruggable targets druggable: Challenge and opportunity. Acta Pharm Sin B. 2021;11:3335–6. · DOI
- Peng X, Hu Z, Zeng L, Zhang M, Xu C, Lu B, et al. Overview of epigenetic degraders based on PROTAC, molecular glue, and hydrophobic tagging technologies. Acta Pharmaceutica Sin B. 2024;14:533–78. · DOI
- Zhang G, Zhang J, Gao Y, Li Y, Li Y. Strategies for targeting undruggable targets. Expert Opin Drug Discov. 2022;17:55–69. · DOI
- Li YQ, Liu XL, Yu L, Huang X, Wang X, Han D, et al. Covalent LYTAC Enabled by DNA Aptamers for Immune Checkpoint Degradation Therapy. J Am Chem Soc. 2023;145:24506–21.
- Schmidt D, Scharf MM, Sydow D, Assmann E, Martí-Solano M, Keul M, et al. Analyzing Kinase Similarity in Small Molecule and Protein Structural Space to Explore the Limits of Multi-Target Screening. Molecules. 2021;26:629. · DOI
- Au YZ, Wang TJ, Sigua LH, Qi J. Peptide-Based PROTAC: The Predator of Pathological Proteins. Cell Chem Biol. 2020;27:637–9. · DOI · Paper page
- Li TW, Fu JX, Zeng ZX, Cohen D, Li J, Chen QM, et al. TIMER2.0 for analysis of tumor-infiltrating immune cells. Nucleic Acids Res. 2020;48:W509–14. · DOI
Cited by
Sorted by citations
Sheng, J., Yuan, W., Zhang, M., Chen, Z., Qi, Y., Zhao, Y., & Zhang, S. (2026) · Journal of Nanobiotechnology · doi:10.1186/s12951-026-04028-7 · Cited by 35
Metadata
- Authors
- Shi, Y.-Y., Fan, G., Tan, R., Li, S., Sun, H.-B., Li, R., Yang, M., Gao, S., Liu, M., & Dai, M.-Y.
- Venue
- Cell Death & Disease
- Published
- 2024-09-30
- Volume
- 15
- Issue
- 9
- ISSN
- 2041-4889
- PMC
- PMC11442653
- Cited by
- 28
- References
- 4
- Language
- en
- Update notices
- correction (2024-11-18)
About these checks
Registry, retraction, Cites and statistics results are computed, not judged, with one exception: a printed reference that no index lists is read once by a model before it counts as a citation error. Claims are extracted by a model and kept only when their quote appears verbatim in the text; each cited source is then checked, with a model’s help, for whether it says what the claim relies on. Those verdicts can be wrong — read the claim’s quote and the cited source before relying on one.
Statistics and arithmetic are recomputed, not judged.
Confidence bands are shown only for fields calibrated on our annotated test set. None is calibrated yet, so no band is shown.
What counts as a claim ›How we measure confidence ›How we check this ›
Are you an author, or do you see a problem with this page? Request a review
