

The DOI matches its Crossref record; 1 of the 1 references it cites were found in a registry or an index.
Integrated analysis of high-throughput sequencing data reveals the key role of LINC00467 in the invasion and metastasis of testicular germ cell tumors
Open accessAbstract
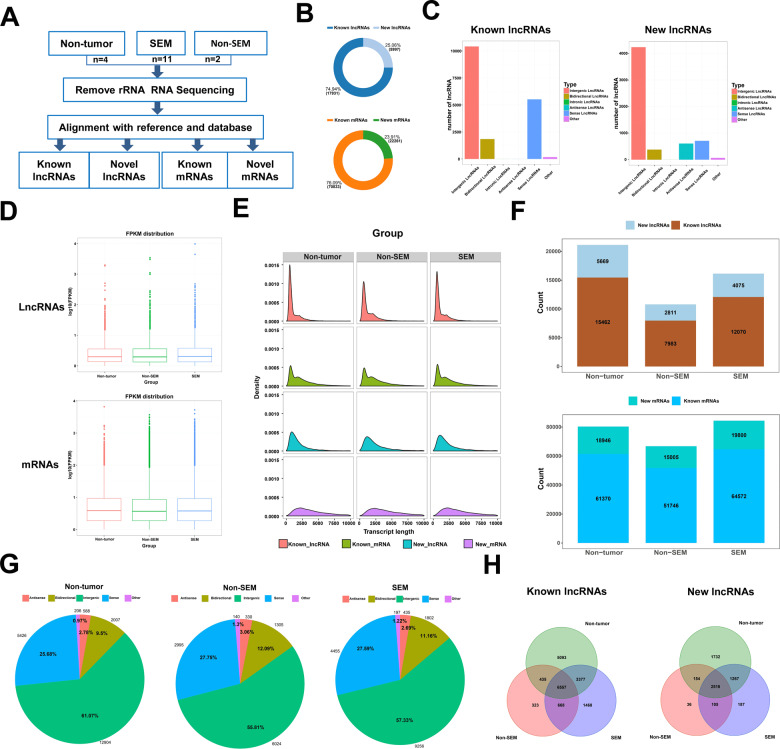
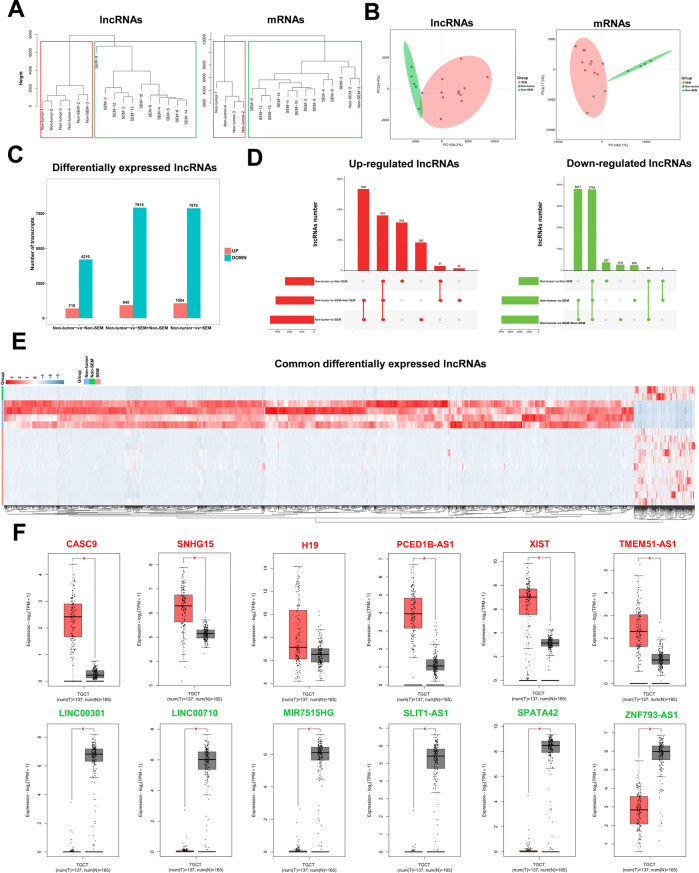
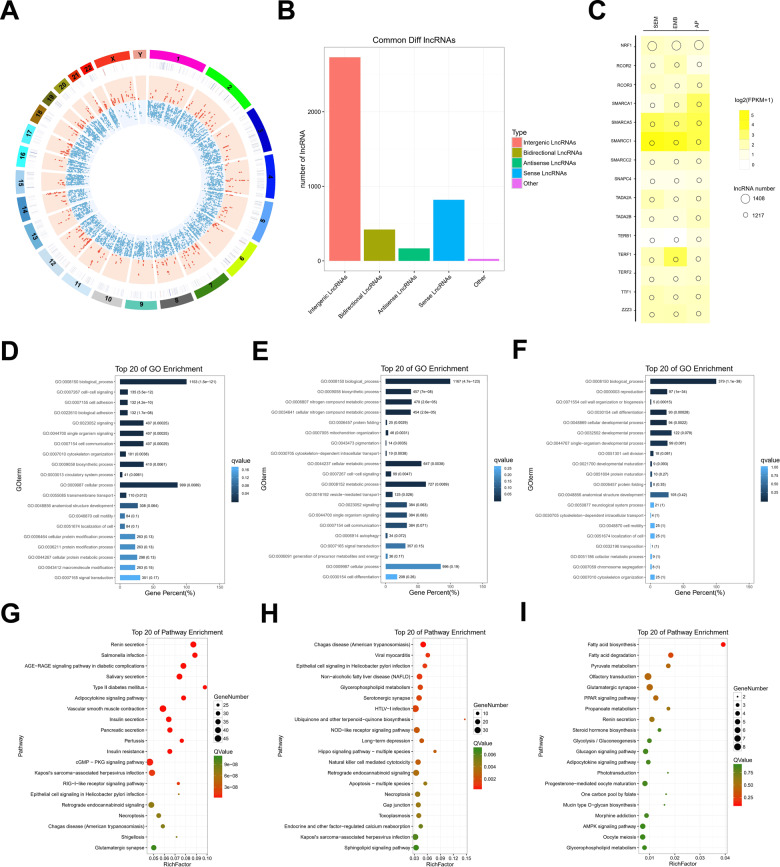
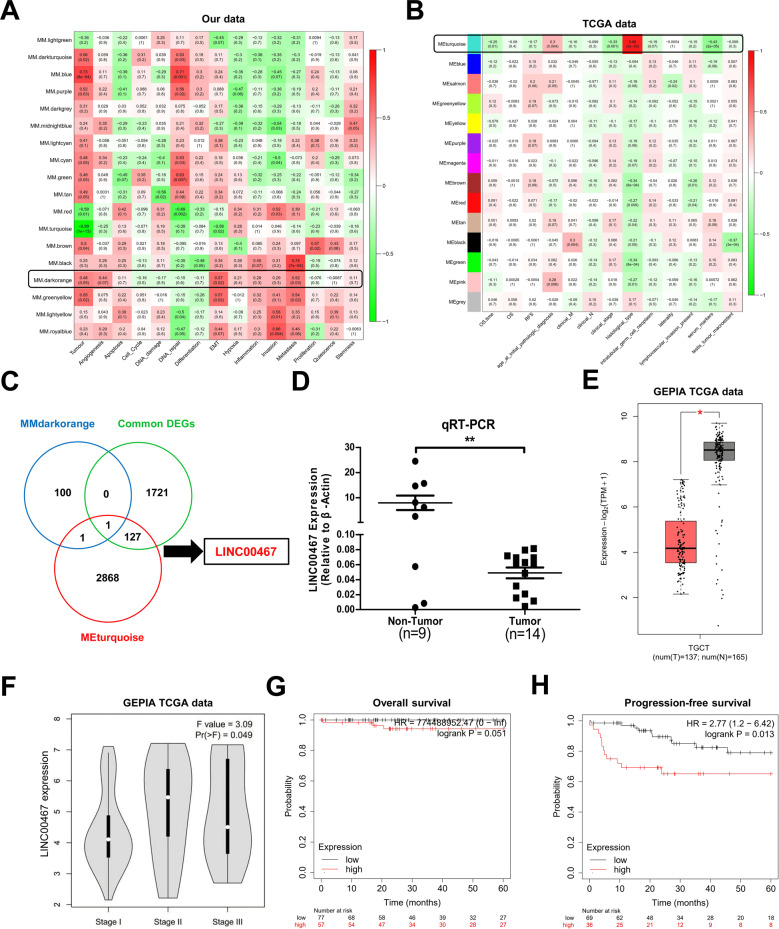
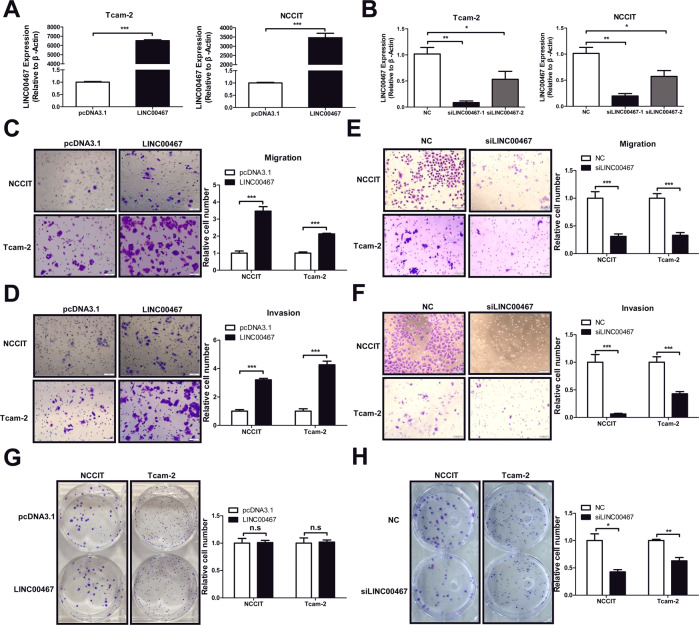
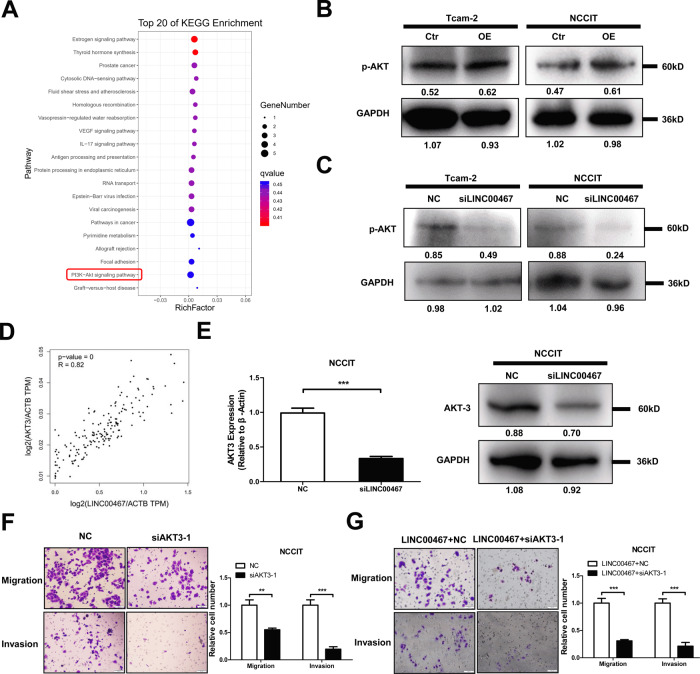
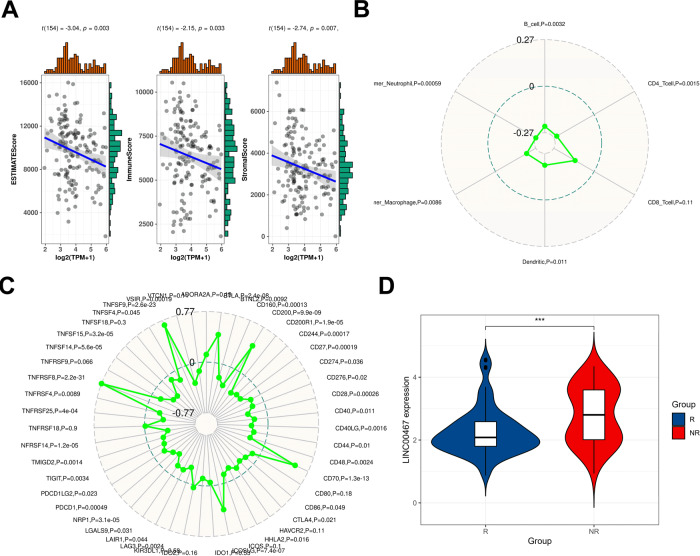
Long noncoding RNAs (lncRNAs) are involved in various physiological and pathological processes. However, the role of lncRNAs in testicular germ cell tumor (TGCT) has been rarely reported. Our purpose is to comprehensively survey the expression and function of lncRNAs in TGCT. In this study, we used RNA sequencing to construct the lncRNA expression profiles of 13 TGCT tissues and 4 paraneoplastic tissues to explore the function of lncRNAs in TGCT. The bioinformatics analysis showed that many lncRNAs are differentially expressed in TGCT. GO and KEGG enrichment analyses revealed that the differentially expressed lncRNAs participated in various biological processes associated with tumorigenesis in cis and trans manners. Further, we found that the expression of LINC00467 was positively correlated with the poor prognosis and pathological grade of TGCT using WGCNA analysis and GEPIA database data mining. In vitro experiments revealed that LNC00467 could promote the migration and invasion of TGCT cells by regulating the expression of AKT3 and influencing total AKT phosphorylation. Further analysis of TCGA data revealed that the expression was negatively correlated with the infiltration of immune cells and the response to PD1 immunotherapy. In summary, this study is the first to construct the expression profile of lncRNAs in TGCT. It is also the first study to identify the metastasis-promoting role of LNC00467, which can be used as a potential predictor of TGCT prognosis and immunotherapeutic response to provide a clinical reference for the treatment and diagnosis of TGCT metastasis.
Overview
The claims and statistics of this paper haven’t been checked yet.
Run the check — free, no account needed. It reads the open-access text and checks the sources it cites.
Integrity signals
Registry
Cites
Statistics
Figures
Verification
Claims the paper makes
The claims and statistics of this paper haven’t been checked yet.
Run the check — free, no account needed. It reads the open-access text and checks the sources it cites.
Claims other papers make about this one
Each is checked against this paper’s own text: does it say what the citing paper says it does?
The source backs part of the claim, not all of it — or backs it for a different population, condition or comparison.
In the citing paper
“Conversely, expression of the long non-coding RNA LNC00467 is negatively correlated with the infiltration of immune cells and response to PD-1 immunotherapy [74].”
From The Immune Landscape and Immunotherapeutic Strategies in Platinum-Refractory Testicular Germ Cell Tumors (2024) · cites this paper as [74]
Experimental — accuracy not yet measured
Self-check
Percentages, sums and reported differences re-computed from the paper’s own numbers.
The self-check needs the paper’s full text.
Citations
Cites
Faghihi, M. A., Modarresi, F., Khalil, A. M., Wood, D. E., Sahagan, B. G., Morgan, T. E., Finch, C. E., St. Laurent III, G., Kenny, P. J., & Wahlestedt, C. (2008) · Nature Medicine · doi:10.1038/nm1784 · Cited by 1,416
Research works printed but not linked: 27
- Chia VM, Quraishi SM, Devesa SS, Purdue MP, Cook MB, McGlynn KA. International trends in the incidence of testicular cancer, 1973-2002. Cancer Epidemiol Biomark Prev. 2010;19:1151–9. · DOI
- Greene MH, Kratz CP, Mai PL, Mueller C, Peters JA, Bratslavsky G, et al. Familial testicular germ cell tumors in adults: 2010 summary of genetic risk factors and clinical phenotype. Endocr Relat Cancer. 2010;17:R109–R121. · DOI
- Shanmugalingam T, Soultati A, Chowdhury S, Rudman S, Van, Hemelrijck M. Global incidence and outcome of testicular cancer. Clin Epidemiol. 2013;5:417–27.
- Albers P, Albrecht W, Algaba F, Bokemeyer C, Cohn-Cedermark G, Fizazi K, et al. Guidelines on testicular cancer: 2015 update. Eur Urol. 2015;68:1054–68. · DOI
- Huarte M. The emerging role of lncRNAs in cancer. Nat Med. 2015;21:1253–61. · DOI
- Bo H, Gong Z, Zhang W, Li X, Zeng Y, Liao Q, et al. Upregulated long non-coding RNA AFAP1-AS1 expression is associated with progression and poor prognosis of nasopharyngeal carcinoma. Oncotarget. 2015;6:20404–18. · DOI
- Ou C, Sun Z, He X, Li X, Fan S, Zheng X, et al. Targeting YAP1/LINC00152/FSCN1 signaling axis prevents the progression of colorectal cancer. Adv Sci. 2020;7:1901380. · DOI
- Zhu Y, Li J, Bo H, He D, Xiao M, Xiang L, et al. LINC00467 is up-regulated by TDG-mediated acetylation in non-small cell lung cancer and promotes tumor progression. Oncogene. 2020;39:6071–84. · DOI
- Tafer H, Hofacker IL. RNAplex: a fast tool for RNA-RNA interaction search. Bioinformatics. 2008;24:2657–63. · DOI
- Mizuno Y, Gotoh A, Kamidono S, Kitazawa S. Establishment and characterization of a new human testicular germ cell tumor cell line (TCam-2). Nihon Hinyokika Gakkai Zasshi. 1993;84:1211–8.
- Teshima S, Shimosato Y, Hirohashi S, Tome Y, Hayashi I, Kanazawa H, et al. Four new human germ cell tumor cell lines. Lab Investig. 1988;59:328–36.
- Das MK, Furu K, Evensen HF, Haugen OP, Haugen TB. Knockdown of SPRY4 and SPRY4-IT1 inhibits cell growth and phosphorylation of Akt in human testicular germ cell tumours. Sci Rep. 2018;8:2462. · DOI
- Yang NQ, Luo XJ, Zhang J, Wang GM, Guo JM. Crosstalk between Meg3 and miR-1297 regulates growth of testicular germ cell tumor through PTEN/PI3K/AKT pathway. Am J Transl Res. 2016;8:1091–9.
- Galon J, Costes A, Sanchez-Cabo F, Kirilovsky A, Mlecnik B, Lagorce-Pages C, et al. Type, density, and location of immune cells within human colorectal tumors predict clinical outcome. Science. 2006;313:1960–4. · DOI · Paper page
- Engreitz JM, Pandya-Jones A, McDonel P, Shishkin A, Sirokman K, Surka C, et al. The Xist lncRNA exploits three-dimensional genome architecture to spread across the X chromosome. Science. 2013;341:1237973. · DOI
- Peng WX, Koirala P, Mo YY. LncRNA-mediated regulation of cell signaling in cancer. Oncogene. 2017;36:5661–7. · DOI
- Lu M, Tian H, Cao YX, He X, Chen L, Song X, et al. Downregulation of miR-320a/383-sponge-like long non-coding RNA NLC1-C (narcolepsy candidate-region 1 genes) is associated with male infertility and promotes testicular embryonal carcinoma cell proliferation. Cell Death Dis. 2015;6:e1960. · DOI
- Atmadibrata B, Liu PY, Sokolowski N, Zhang L, Wong M, Tee AE, et al. The novel long noncoding RNA linc00467 promotes cell survival but is down-regulated by N-Myc. PLoS ONE. 2014;9:e88112. · DOI
- He X, Li S, Yu B, Kuang G, Wu Y, Zhang M, et al. Up-regulation of LINC00467 promotes the tumourigenesis in colorectal cancer. J Cancer. 2019;10:6405–13. · DOI
- Cai K, Li T, Guo L, Guo H, Zhu W, Yan L, et al. Long non-coding RNA LINC00467 regulates hepatocellular carcinoma progression by modulating miR-9-5p/PPARA expression. Open Biol. 2019;9:190074. · DOI
- Jiang W, Cheng X, Wang T, Song X, Zheng Y, Wang L. LINC00467 promotes cell proliferation and metastasis by binding with IGF2BP3 to enhance the mRNA stability of TRAF5 in hepatocellular carcinoma. J Gene Med. 2020;22:e3134. · DOI
- Liu Z, Yang S, Chen X, Dong S, Zhou S, Xu S. LncRNA LINC00467 acted as an oncogene in esophageal squamous cell carcinoma by accelerating cell proliferation and preventing cell apoptosis via the miR-485-5p/DPAGT1 axis. J Gastroenterol Hepatol. 2020;36:721–30. · DOI
- Chen Y, Lu J, Xia L, Xue D, Yu X, Shen D, et al. Testicular orphan receptor 4 promotes tumor progression and implies poor survival through AKT3 regulation in seminoma. Cancer Sci. 2018;109:384–94. · DOI
- Jiang X, Wang J, Deng X, Xiong F, Ge J, Xiang B, et al. Role of the tumor microenvironment in PD-L1/PD-1-mediated tumor immune escape. Mol Cancer. 2019;18:10. · DOI
- Siska PJ, Johnpulle RAN, Zhou A, Bordeaux J, Kim JY, Dabbas B, et al. Deep exploration of the immune infiltrate and outcome prediction in testicular cancer by quantitative multiplexed immunohistochemistry and gene expression profiling. Oncoimmunology. 2017;6:e1305535. · DOI · Paper page
- Langfelder P, Horvath S. WGCNA: an R package for weighted correlation network analysis. BMC Bioinforma. 2008;9:559. · DOI · Paper page
- Miao YR, Zhang Q, Lei Q, Luo M, Xie GY, Wang H, et al. ImmuCellAI: a unique method for comprehensive T-cell subsets abundance prediction and its application in cancer immunotherapy. Adv Sci. 2020;7:1902880. · DOI
Cited by
Guo, J., Wang, S., Jiang, Z., Tang, L., Liu, Z., Cao, J., Hu, Z., Chen, X., Luo, Y., & Bo, H. (2022) · Frontiers in Immunology · doi:10.3389/fimmu.2022.859730 · Cited by 25
Self-citationEvmorfopoulos, K., Marsitopoulos, K., Karachalios, R., Karathanasis, A., Dimitropoulos, K., Tzortzis, V., Zachos, I., & Vlachostergios, P. J. (2024) · Cancers · doi:10.3390/cancers16020428 · Cited by 11
“A novel 150 immune-gene expression signature, named TIMEAS (tumor immune microenvironment activation status), was developed based on TCGA data from TGCTs [74].”
BackgroundMethod
Metadata
- Authors
- Bo, H., Zhu, F., Liu, Z., Deng, Q., Liu, G., Li, R., Zhu, W., Tan, Y., Liu, G., Fan, J., & Fan, L.
- Affiliations
- Central South University (CN)
- Corresponding author
- Fan, Liqing
- Venue
- Cell Death Discovery
- Published
- 2021-08-06
- Volume
- 7
- Issue
- 1
- Pages
- 206-206
- ISSN
- 2058-7716 (ISSN-L)
- PMC
- PMC8346510
- OpenAlex
- W3188659136
- Cited by
- 35
- References
- 1
- Citations by year
- 2026: 3 · 2025: 4 · 2024: 5 · 2023: 9 · 2022: 13 · 2021: 1
- FWCI
- 2.78
- Type
- journal article
- Language
- en
- Open access
- gold
- doi.org
- Locations
- Cell Death Discovery (publishedVersion, cc-by)
- PubMed Central (publishedVersion, cc-by)
- PubMed (publishedVersion)
- DOAJ (DOAJ: Directory of Open Access Journals) (submittedVersion, cc-by-sa)
- Funders
- the National Key Research and Development Program of China
- the Special Fund of Clinical Medicine of the Chinese Medical Association
- Topics
- Life Sciences › Biochemistry, Genetics and Molecular Biology › Cancer Research › Cancer-related molecular mechanisms research
- Health Sciences › Medicine › Surgery › Testicular diseases and treatments
- Life Sciences › Biochemistry, Genetics and Molecular Biology › Molecular Biology › RNA modifications and cancer
- Keywords
- long non-coding RNA, testicular germ cell tumors, tumor invasion, metastasis, AKT3, Akt phosphorylation, cell migration, lncRNA expression profiling, prognosis, immune cell infiltration, tumor suppressor lncRNA
About these checks
Registry, retraction, Cites and statistics results are computed, not judged, with one exception: a printed reference that no index lists is read once by a model before it counts as a citation error. Claims are extracted by a model and kept only when their quote appears verbatim in the text; each cited source is then checked, with a model’s help, for whether it says what the claim relies on. Those verdicts can be wrong — read the claim’s quote and the cited source before relying on one.
Statistics and arithmetic are recomputed, not judged.
Confidence bands are shown only for fields calibrated on our annotated test set. None is calibrated yet, so no band is shown.
What counts as a claim ›How we measure confidence ›How we check this ›
Are you an author, or do you see a problem with this page? Request a review
How to cite
Cite CoChat for the checks on this page, and the paper for its own findings.
- This page
- CoChat. (2026). Citation check: Integrated analysis of high-throughput sequencing data reveals the key role of LINC00467 in the invasion and metastasis of testicular germ cell tumors. https://app.cochat.ai/papers/10.1038/s41420-021-00588-9
- The paper
- Bo, H., Zhu, F., Liu, Z., Deng, Q., Liu, G., Li, R., Zhu, W., Tan, Y., Liu, G., Fan, J., & Fan, L. (2021). Integrated analysis of high-throughput sequencing data reveals the key role of LINC00467 in the invasion and metastasis of testicular germ cell tumors. Cell Death Discovery. https://doi.org/10.1038/s41420-021-00588-9
