Cited by 127

The DOI matches its Crossref record.

A phase 2/3 randomized clinical trial followed by an open-label extension to evaluate the effectiveness of elamipretide in Barth syndrome, a genetic disorder of mitochondrial cardiolipin metabolism

Reid Thompson, W., Hornby, Brittany, Manuel, Ryan, Bradley, Elena, Laux, Janice, Carr, Jim, Vernon, Hilary J.·2021·Genetics in Medicine

Overview

The claims and statistics of this paper haven’t been checked yet.

Run the check — free, no account needed. It reads the open-access text and checks the sources it cites.

A few free checks a day · papers already verified open instantly · results are public

Integrity signals

Registry

Crossref · 10.1038/s41436-020-01006-8

Cites

Statistics

Figures

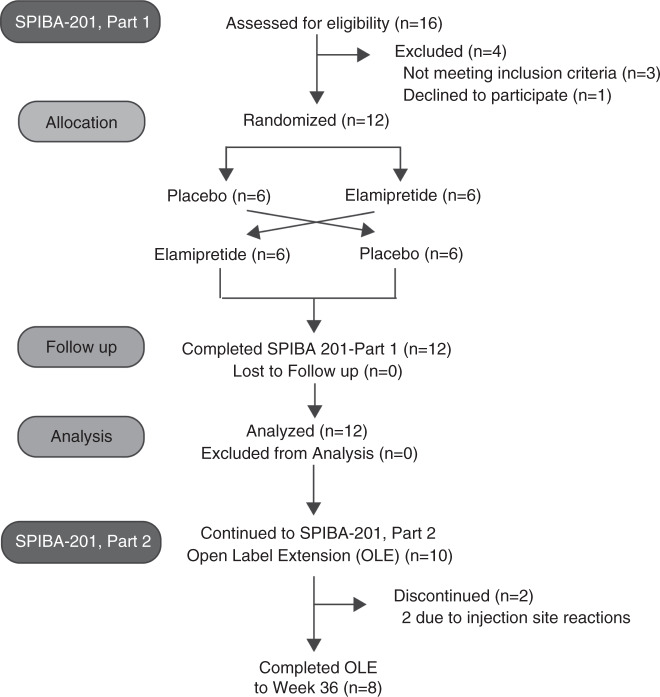
Fig. 1 Study participant flowsheet for SPIBA 201 to test the efficacy and safety of single daily subcutaneous (SC) doses of 40 mg elamipretide (vs. placebo) in subjects with Barth syndrome. Subjects were randomized (1:1) to one of two sequence groups: 12 weeks of single daily SC doses of 40 mg elamipretide in treatment period 1 followed by 12 weeks of treatment with placebo in treatment period 2 (separated by 4-week washout period), or vice versa. The crossover design was selected because of the additional anticipated power of subjects serving as their own control, given the anticipated scarcity of subjects available to participate in this study due to the ultrarare nature of Barth syndrome.
Fig. 1 Study participant flowsheet for SPIBA 201 to test the efficacy and safety of single daily subcutaneous (SC) doses of 40 mg elamipretide (vs. placebo) in subjects with Barth syndrome. Subjects were randomized (1:1) to one of two sequence groups: 12 weeks of single daily SC doses of 40 mg elamipretide in treatment period 1 followed by 12 weeks of treatment with placebo in treatment period 2 (separated by 4-week washout period), or vice versa. The crossover design was selected because of the additional anticipated power of subjects serving as their own control, given the anticipated scarcity of subjects available to participate in this study due to the ultrarare nature of Barth syndrome.CC BY-NC-ND · PubMed Central
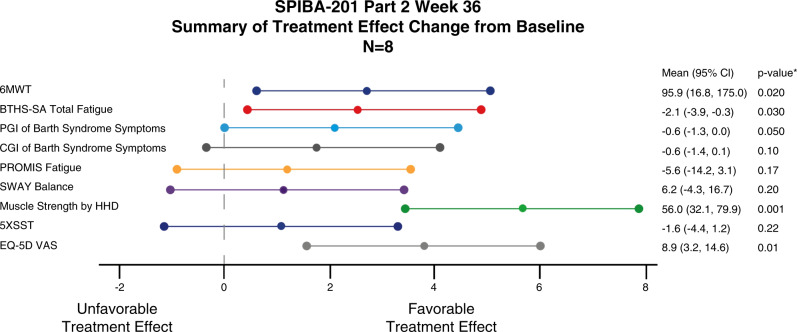
Fig. 2 Outcome measures at week 36, part 2 in 8 patients. Statistical significance was achieved in improved measures for 6-minute walk test (m), the Barth Syndrome Symptom Assessment (BTHS-SA) total fatigue scale (mean score), Patient Global Impression (PGI) of symptoms (mean score), muscle strength measured by handheld dynamometry (HHD) (newtons), and the EQ-5D questionnaire Fig. 2. Favorable treatment effects were also seen in other measures (Promis Fatigue [mean score], Clinician Global Impression [CGI] of Barth syndrome symptoms [mean score], and SWAY balance), though not achieving statistical significance. Treatment effect was rescaled to a T-score and standard error unit of 1. *p values represent a t-test for matched pairs, comparing mean at baseline to mean at week 36 in part 2.
Fig. 2 Outcome measures at week 36, part 2 in 8 patients. Statistical significance was achieved in improved measures for 6-minute walk test (m), the Barth Syndrome Symptom Assessment (BTHS-SA) total fatigue scale (mean score), Patient Global Impression (PGI) of symptoms (mean score), muscle strength measured by handheld dynamometry (HHD) (newtons), and the EQ-5D questionnaire Fig. 2. Favorable treatment effects were also seen in other measures (Promis Fatigue [mean score], Clinician Global Impression [CGI] of Barth syndrome symptoms [mean score], and SWAY balance), though not achieving statistical significance. Treatment effect was rescaled to a T-score and standard error unit of 1. *p values represent a t-test for matched pairs, comparing mean at baseline to mean at week 36 in part 2.CC BY-NC-ND · PubMed Central
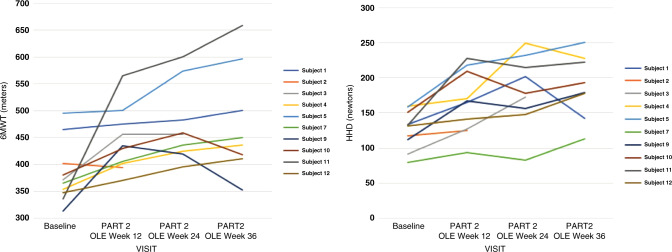
Fig. 3 6-minute walk test and hand held dynamometry results per participant from baseline to open label extension, week 36. (a) Change in 6-minute walk test (6MWT) results per participant from baseline to open label extension (OLE) week 36. The mean distance walked on the 6MWT increased from baseline across ten subjects at week 12, part 2, with a mean improvement of 60.5 m (16% increase, paired t-test: p = 0.02). At week 36, part 2 across eight subjects the mean improvement from baseline was 95.9 m (25% improvement, paired t-test: p = 0.02). (b) Change in handheld dynamometry (HHD) results per participant from baseline to open label extension (OLE) week 36. At week 12, part 2 there was a mean improvement from baseline HHD of 37.9 newtons (a 30% improvement, paired t-test: p = 0.003) across the ten subjects. At week 36, part 2 there was a mean improvement of +56.0 newtons (a 42% improvement, paired t-test: p = 0.001) across the eight participants who reached the 36 week study visit.
Fig. 3 6-minute walk test and hand held dynamometry results per participant from baseline to open label extension, week 36. (a) Change in 6-minute walk test (6MWT) results per participant from baseline to open label extension (OLE) week 36. The mean distance walked on the 6MWT increased from baseline across ten subjects at week 12, part 2, with a mean improvement of 60.5 m (16% increase, paired t-test: p = 0.02). At week 36, part 2 across eight subjects the mean improvement from baseline was 95.9 m (25% improvement, paired t-test: p = 0.02). (b) Change in handheld dynamometry (HHD) results per participant from baseline to open label extension (OLE) week 36. At week 12, part 2 there was a mean improvement from baseline HHD of 37.9 newtons (a 30% improvement, paired t-test: p = 0.003) across the ten subjects. At week 36, part 2 there was a mean improvement of +56.0 newtons (a 42% improvement, paired t-test: p = 0.001) across the eight participants who reached the 36 week study visit.CC BY-NC-ND · PubMed Central

Verification

Claims the paper makes

The claims and statistics of this paper haven’t been checked yet.

Run the check — free, no account needed. It reads the open-access text and checks the sources it cites.

A few free checks a day · papers already verified open instantly · results are public

Claims other papers make about this one

Each is checked against this paper’s own text: does it say what the citing paper says it does?

Self-check

Percentages, sums and reported differences re-computed from the paper’s own numbers.

The self-check needs the paper’s full text.

Citations

Cited by

Sorted by citations

Metadata

Authors
Reid Thompson, W., Hornby, B., Manuel, R., Bradley, E., Laux, J., Carr, J., & Vernon, H. J.
Venue
Genetics in Medicine
Publisher
Elsevier BV
Published
2021-03
Volume
23
Issue
3
Pages
471-478
ISSN
1098-3600
Cited by
127
References
0
Language
en

About these checks

Registry, retraction, Cites and statistics results are computed, not judged, with one exception: a printed reference that no index lists is read once by a model before it counts as a citation error. Claims are extracted by a model and kept only when their quote appears verbatim in the text; each cited source is then checked, with a model’s help, for whether it says what the claim relies on. Those verdicts can be wrong — read the claim’s quote and the cited source before relying on one.

Statistics and arithmetic are recomputed, not judged.

Confidence bands are shown only for fields calibrated on our annotated test set. None is calibrated yet, so no band is shown.

What counts as a claim ›How we measure confidence ›How we check this ›

Are you an author, or do you see a problem with this page? Request a review