

The DOI matches its Crossref record; 72 of the 72 references it cites were found in a registry or an index.
Switching between H- and J-type electronic coupling in single conjugated polymer aggregates
Open accessAbstract
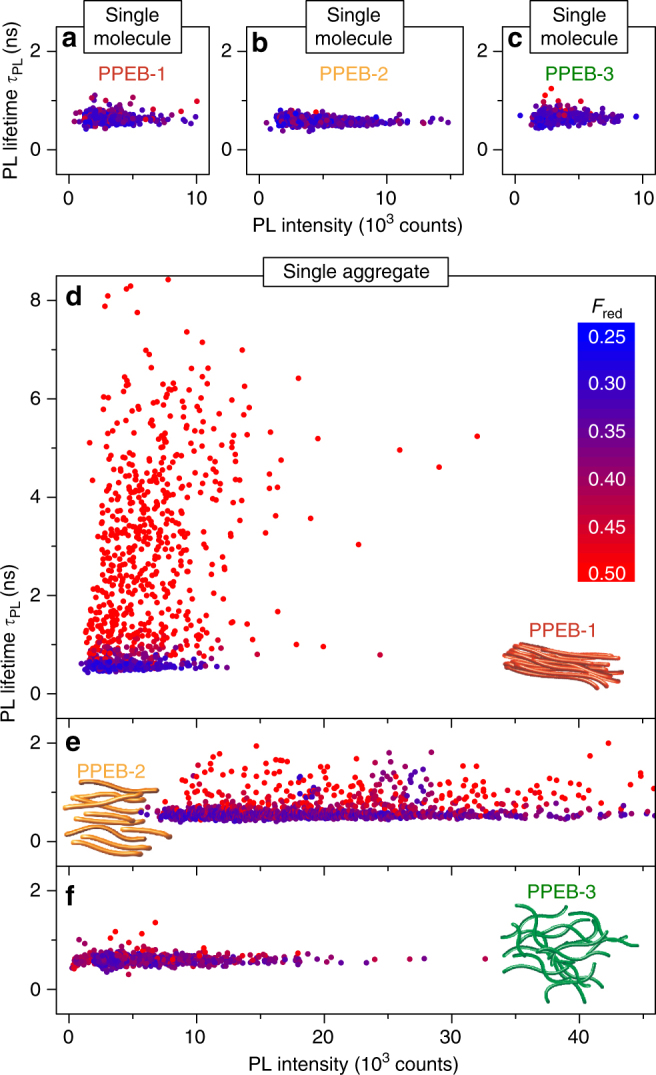
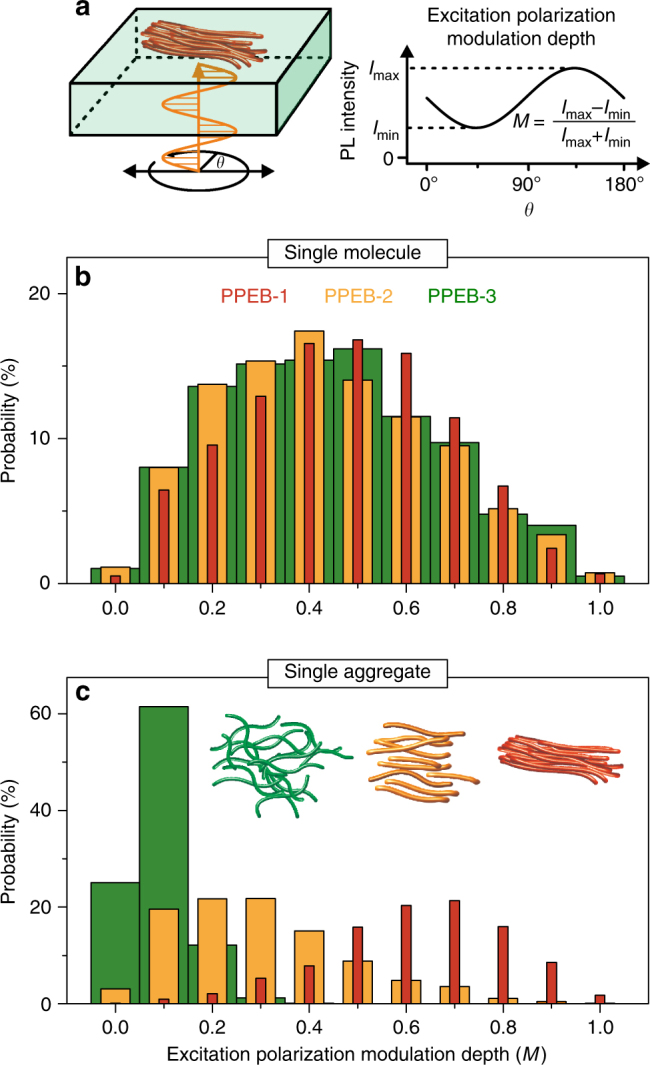
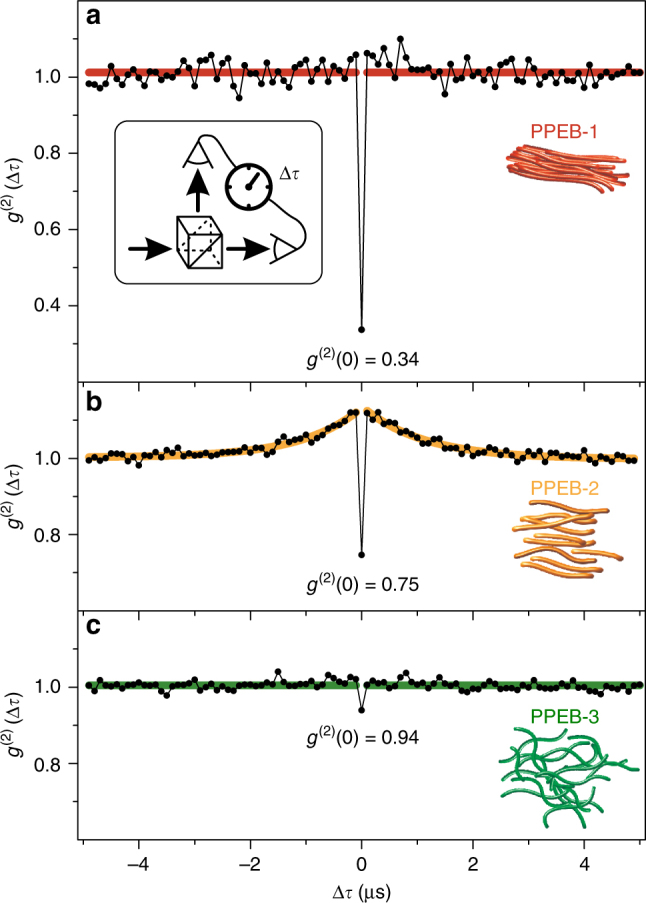
The aggregation of conjugated polymers and electronic coupling of chromophores play a central role in the fundamental understanding of light and charge generation processes. Here we report that the predominant coupling in isolated aggregates of conjugated polymers can be switched reversibly between H-type and J-type coupling by partially swelling and drying the aggregates. Aggregation is identified by shifts in photoluminescence energy, changes in vibronic peak ratio, and photoluminescence lifetime. This experiment unravels the internal electronic structure of the aggregate and highlights the importance of the drying process in the final spectroscopic properties. The electronic coupling after drying is tuned between H-type and J-type by changing the side chains of the conjugated polymer, but can also be entirely suppressed. The types of electronic coupling correlate with chain morphology, which is quantified by excitation polarization spectroscopy and the efficiency of interchromophoric energy transfer that is revealed by the degree of single-photon emission.
Overview
The claims and statistics of this paper haven’t been checked yet.
Run the check — free, no account needed. It reads the open-access text and checks the sources it cites.
Integrity signals
Registry
Cites
Statistics
Figures
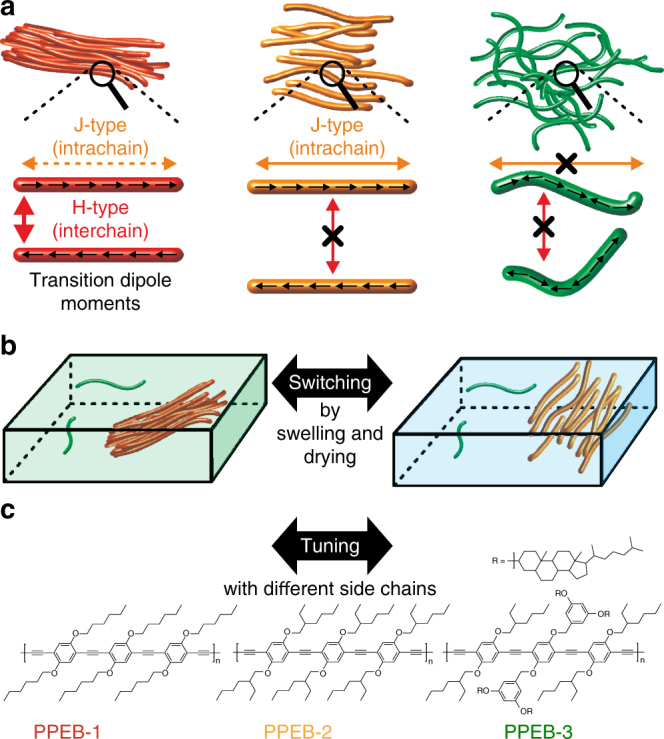
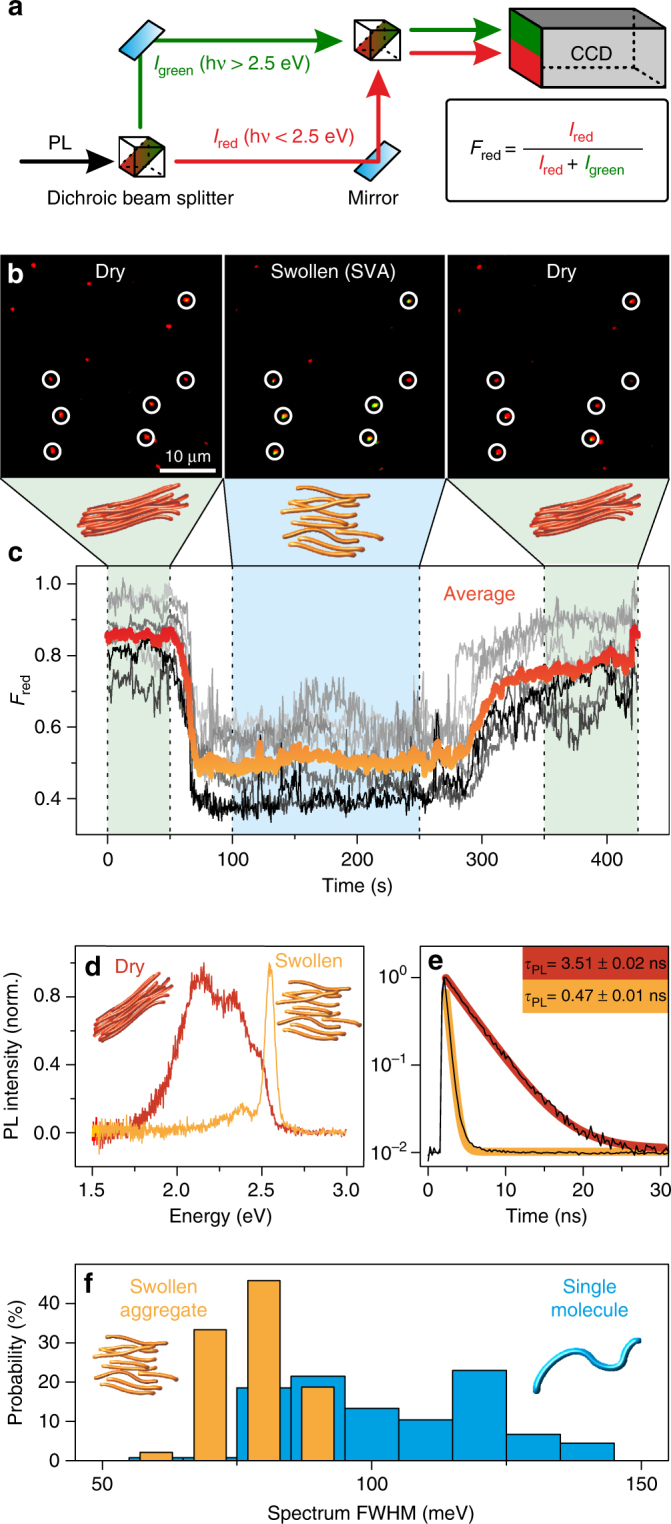
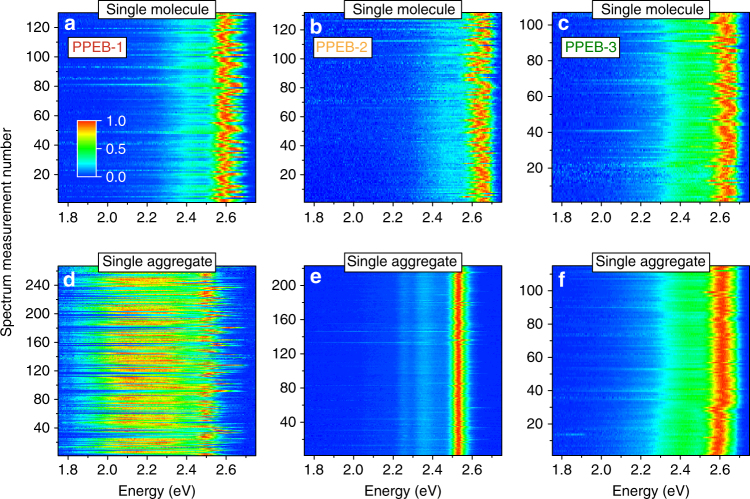
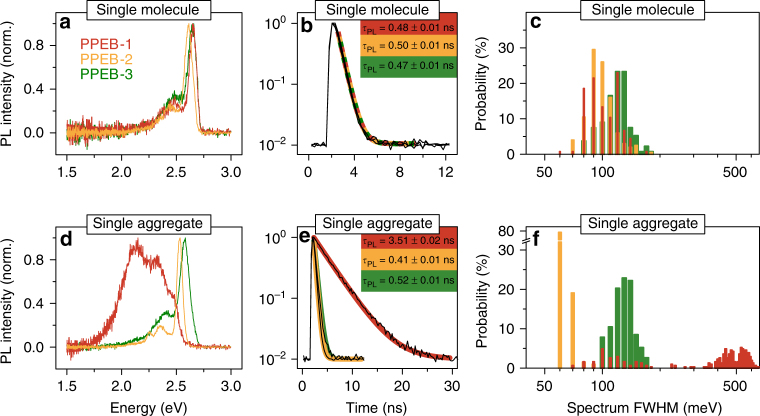
Verification
Claims the paper makes
The claims and statistics of this paper haven’t been checked yet.
Run the check — free, no account needed. It reads the open-access text and checks the sources it cites.
Claims other papers make about this one
Each is checked against this paper’s own text: does it say what the citing paper says it does?
The cited source says what the claim attributes to it.
In the citing paper
“Depending on their aggregation states (i.e., J-, H-, or random aggregates), CP aggregates that contain tens of CP chains showed fluorescence emission from a different number of the chromophores, in some cases only from a few chromophores.165−167”
From The Pursuit of Shortwave Infrared-Emitting Nanoparticles with Bright Fluorescence through Molecular Design and Excited-State Engineering of Molecular Aggregates (2022) · cites this paper as [166]
Self-check
Percentages, sums and reported differences re-computed from the paper’s own numbers.
The self-check needs the paper’s full text.
Citations
Cites
Evidence for wavelike energy transfer through quantum coherence in photosynthetic systems
Engel, G. S., Calhoun, T. R., Read, E. L., Ahn, T.-K., Mančal, T., Cheng, Y.-C., Blankenship, R. E., & Fleming, G. R. (2007) · Nature · doi:10.1038/nature05678 · Cited by 3,315
Energy Transfer Mechanisms and the Molecular Exciton Model for Molecular Aggregates
Kasha, M. (1963) · Radiation Research · doi:10.2307/3571331 · Cited by 1,664
Coherently wired light-harvesting in photosynthetic marine algae at ambient temperature
Collini, E., Wong, C. Y., Wilk, K. E., Curmi, P. M. G., Brumer, P., & Scholes, G. D. (2010) · Nature · doi:10.1038/nature08811 · Cited by 1,649
Spectral Absorption and Fluorescence of Dyes in the Molecular State
Jelley, E. E. (1936) · Nature · doi:10.1038/1381009a0 · Cited by 1,419
H- and J-Aggregate Behavior in Polymeric Semiconductors
Spano, F. C., & Silva, C. (2014) · Annual Review of Physical Chemistry · doi:10.1146/annurev-physchem-040513-103639 · Cited by 1,158
Long-lived quantum coherence in photosynthetic complexes at physiological temperature
Panitchayangkoon, G., Hayes, D., Fransted, K. A., Caram, J. R., Harel, E., Wen, J., Blankenship, R. E., & Engel, G. S. (2010) · Proceedings of the National Academy of Sciences · doi:10.1073/pnas.1005484107 · Cited by 1,072
Energy Transfer Mechanisms and the Molecular Exciton Model for Molecular Aggregates 1, 2
Kasha, M. (2012) · Radiation Research · doi:10.1667/rrav03.1 · Cited by 1,070
Clark, J., Silva, C., Friend, R. H., & Spano, F. C. (2007) · Physical Review Letters · doi:10.1103/physrevlett.98.206406 · Cited by 968
Enhancement of Phosphorescence Ability upon Aggregation of Dye Molecules
McRae, E. G., & Kasha, M. (1958) · The Journal of Chemical Physics · doi:10.1063/1.1744225 · Cited by 931
Using coherence to enhance function in chemical and biophysical systems
Scholes, G. D., Fleming, G. R., Chen, L. X., Aspuru-Guzik, A., Buchleitner, A., Coker, D. F., Engel, G. S., van Grondelle, R., Ishizaki, A., Jonas, D. M., et al. (2017) · Nature · doi:10.1038/nature21425 · Cited by 668
Cited by
Sorted by citations
Items 101–135 of 135
Dual-Responsive Fluorescent Polymer Films for Wide-Range Temperature and Humidity Sensing
Habbal, R. K. E., Salvi, S. S., Jain, A., & Karam, P. (2025) · ACS Applied Polymer Materials · doi:10.1021/acsapm.5c02854 · Cited by 4
Beyond p‐Hexaphenylenes: Synthesis of Unsubstituted p‐Nonaphenylene by a Precursor Protocol
Abdulkarim, A., Nathusius, M., Bäuerle, R., Strunk, K., Beck, S., Räder, H. J., Pucci, A., Melzer, C., Jänsch, D., Freudenberg, J., et al. (2020) · Chemistry - A European Journal · doi:10.1002/chem.202001531 · Cited by 4
Controlled aggregation of DNA functionalized poly(phenylene-vinylene)
Gudnason, D., Madsen, M., Krissanaprasit, A., Gothelf, K. V., & Birkedal, V. (2018) · Chemical Communications · doi:10.1039/c8cc00943k · Cited by 4
Noncovalent functionalization of boron nitride nanotubes using poly(2,7‐carbazole)s
Rice, N. A., Bodnaryk, W. J., Tamblyn, I., Jakubek, Z. J., Lefebvre, J., Lopinski, G. P., Adronov, A., & Homenick, C. M. (2020) · Journal of Polymer Science · doi:10.1002/pol.20200164 · Cited by 4
Chou, H., Hsu, W., Yang, Y., Schanze, K. S., Luo, S., & Chen, C. (2021) · Macromolecular Chemistry and Physics · doi:10.1002/macp.202100135 · Cited by 4
Yücel, M., Önbaş, R., Yıldız, A. A., & Yıldız, Ü. H. (2023) · Macromolecular Bioscience · doi:10.1002/mabi.202300402 · Cited by 3
Naturally J-aggregated F-BODIPYs: Self-assembly organization driven by substitution pattern
Gómez, A. M., Infantes, L., Chambi, J. T., Duque-Redondo, E., Gartzia‐Rivero, L., Uriel, C., Bañuelos, J., García‐Moreno, I., & Lopez, J. C. (2023) · Journal of Molecular Liquids · doi:10.1016/j.molliq.2023.123773 · Cited by 3
“The design of self-assembled organic dyes has become an appealing approach in the development of advanced functional materials with wide-ranging applications in photonics and plasmonics [1 – 6].”
Song, Y., & Im, S. H. (2024) · Colloids and Surfaces A Physicochemical and Engineering Aspects · doi:10.1016/j.colsurfa.2024.134819 · Cited by 3
Eder, T., Vogelsang, J., Bange, S., Remmerssen, K., Schmitz, D., Jester, S., Keller, T. J., Höger, S., & Lupton, J. M. (2019) · Angewandte Chemie · doi:10.1002/ange.201912374 · Cited by 3
Self-citationBerzansky, A., Parker, M. A., Garden, K., & Whittaker‐Brooks, L. (2026) · ACS Applied Polymer Materials · doi:10.1021/acsapm.5c04417 · Cited by 2
Pressure Dependence on the Thermal Conductivity of H‐ and J‐type Nanocomposites
Hong, Y., & Goh, M. (2022) · Advanced Materials Interfaces · doi:10.1002/admi.202200027 · Cited by 2
Organic BODIPY Based Gels: Optical, Electrochemical and Self‐Assembly Properties
Rao, R. S., Rao, G. H., Venkateswararao, A., Nizamuddin, S., Narayanaswamy, K., & Singh, S. P. (2024) · Chemistry - An Asian Journal · doi:10.1002/asia.202400807 · Cited by 2
Kerfoot, J., James, T. S. S., Taniguchi, T., Watanabe, K., Beton, P. H., Rance, G. A., & George, M. W. (2025) · Optics Communications · doi:10.1016/j.optcom.2025.131945 · Cited by 2
Jyothi, M., Annadhasan, M., Pradeep, V. V., & Chandrasekar, R. (2020) · Soft Matter · doi:10.1039/d0sm00108b · Cited by 2
Royakkers, J., Guo, K., Toolan, D. T. W., Feng, L., Minotto, A., Congrave, D. G., Danowska, M., Zeng, W., Bond, A. D., Al‐Hashimi, M., et al. (2021) · Angewandte Chemie · doi:10.1002/ange.202110139 · Cited by 2
Imoto, K., Yamaguchi, I., & Wang, A. (2021) · Materials Today Chemistry · doi:10.1016/j.mtchem.2021.100601 · Cited by 2
Savedra, R. M. L., de Morais, M. N. B. L., & Siqueira, M. F. (2022) · Journal of Molecular Graphics and Modelling · doi:10.1016/j.jmgm.2022.108279 · Cited by 2
Chen, B., Hu, B., Chen, Y., Lu, Z., Wang, Y., Yang, L., & Huang, Y. L. (2023) · Organic Electronics · doi:10.1016/j.orgel.2023.106851 · Cited by 2
Supramolecular and electrical properties of ruthenium-based organometallic gels
Eryilmaz, I. H., Gallonde, W. T., Caytan, E., Jeannin, O., Camerel, F., Rigaut, S., Galangau, O., & Orgiu, E. (2025) · Journal of Materials Chemistry C · doi:10.1039/d4tc04486j · Cited by 1
Vineetha, P. K., Perumbalathodi, N., Krishnan, A., Kannankutty, K., Das, N., Su, T., & Anas, S. (2025) · ACS Applied Electronic Materials · doi:10.1021/acsaelm.5c01976 · Cited by 1
Emad, A. A., El‐Dean, A. M. K., Mohammed, A. A. K., Sayed, M., & Saddik, A. A. (2026) · Journal of Molecular Structure · doi:10.1016/j.molstruc.2026.146288 · Cited by 1
Organic photonic nanostructures
O’Carroll, D. M. (2019) · Elsevier eBooks · doi:10.1016/b978-0-08-102284-9.00004-8 · Cited by 1
Chattopadhyay, S., & Biteen, J. S. (2024) · ACS Measurement Science Au · doi:10.1021/acsmeasuresciau.4c00026 · Cited by 1
Sreedharan, A., & Das, B. C. (2022) · Organic Electronics · doi:10.1016/j.orgel.2022.106728 · Cited by 1
Molina-Osorio, A. F., Yamamoto, S., Gamero‐Quijano, A., Nagatani, H., & Scanlon, M. D. (2021) · ChemRxiv · doi:10.26434/chemrxiv.14378897
Aggregation and Emission Modulations of Two-Component Gel Phase Systems Induced by H-Bonds
Simalou, O., Eloh, K., Agbodan, K. A., & Lu, R. (2023) · Chemistry Africa · doi:10.1007/s42250-023-00731-2
“H-aggregates where molecules are aligned parallel to each other with strong intermolecular interaction tend to induce the nonradiative deactivation process [58, 61–69].”
Molecular dynamics simulation of semiconducting polymers
Makki, H., Burke, C., & Troisi, A. (2025) · Elsevier eBooks · doi:10.1016/b978-0-44-327314-8.00019-1
Nucleotide-Induced Supramolecular Assembly of Phosphonium-Containing Conjugated Polyelectrolytes
Barboza-Ramos, I., Zhao, Y., Sun, H., Li, Z., & Schanze, K. S. (2025) · Langmuir · doi:10.1021/acs.langmuir.5c04508
Side chain linkages control aggregate structure in poly(phenylene ethynylene) conjugated polymers
Yang, Y., Zeman, C. J., Gobeze, H. B., & Schanze, K. S. (2026) · Research on Chemical Intermediates · doi:10.1007/s11164-025-05896-8
Yang, Z., Gui, C., Wang, Y., Fan, X., Zheng, X., Dong, C., Zhang, Q., & Zhang, Y. (2026) · Applied Surface Science · doi:10.1016/j.apsusc.2026.166565
Ramesan, A. B., & Joseph, J. (2026) · Journal of Photochemistry and Photobiology A Chemistry · doi:10.1016/j.jphotochem.2026.117219
DNA‐Based Exciton Collider to Monitor Exciton Diffusion and Annihilation
Schröder, T., Wutz, P., Lupton, J. M., Tinnefeld, P., & Vogelsang, J. (2026) · Small Structures · doi:10.1002/sstr.202500889
“…SSA in the multichromophoric system. psTRAB was previously demonstrated on well-defined multichro-mophoric systems, using the DNA origami technique to place up to five organic dye molecules at specific distances of 3 nm [33, 57 – 59], as well as on poorly-defined conjugated polymer aggregates [62].”
Self-citationControlling crystallization-induced orange-to-NIR emission in acridinium donor–acceptor conjugates
Yoon, S., Kim, R., Kim, D., Kim, H., Chu, J., Min, S., Kim, J., & Kim, J. (2026) · Organic Chemistry Frontiers · doi:10.1039/d6qo00475j
Abdelaziz, B. B., Mustapha, N., Ali, M. K. M., Aljameel, A. I., Altoub, T., Hjiri, M., Alarifi, N., Al-Gawati, M., & AL-badri, A. M. S. (2026) · Materials Science and Engineering B · doi:10.1016/j.mseb.2026.119752
Metadata
- Authors
- Eder, T., Stangl, T., Gmelch, M., Remmerssen, K., Laux, D., Höger, S., Lupton, J. M., & Vogelsang, J.
- Affiliations
- University of Regensburg (DE)
- University of Bonn (DE)
- Corresponding author
- Vogelsang, Jan
- Venue
- Nature Communications
- Published
- 2017-11-21
- Volume
- 8
- Issue
- 1
- Pages
- 1641-1641
- ISSN
- 2041-1723 (ISSN-L)
- PMC
- PMC5696370
- OpenAlex
- W2770794788
- Cited by
- 135
- References
- 72
- Citations by year
- 2026: 9 · 2025: 10 · 2024: 17 · 2023: 14 · 2022: 21 · 2021: 21 · 2020: 22 · 2019: 10 · 2018: 11
- FWCI
- 8.65
- Type
- journal article
- Language
- en
- Open access
- gold
- doi.org
- Locations
- Nature Communications (publishedVersion, cc-by)
- Europe PMC (PubMed Central) (publishedVersion, cc-by)
- PubMed Central (publishedVersion, cc-by)
- PubMed (publishedVersion)
- University of Regensburg Publication Server (University of Regensburg) (acceptedVersion)
- RePEc: Research Papers in Economics (submittedVersion)
- DOAJ (DOAJ: Directory of Open Access Journals) (submittedVersion, cc-by-sa)
- DOAJ (DOAJ: Directory of Open Access Journals) (submittedVersion)
- University of Regensburg Publication Server (University of Regensburg)
- Funders
- Deutsche Forschungsgemeinschaft (GRK 1570)
- Volkswagen Foundation
- FP7 Ideas: European Research Council (305020)
- Topics
- Physical Sciences › Chemistry › Physical and Theoretical Chemistry › Photochemistry and Electron Transfer Studies
- Physical Sciences › Engineering › Electrical and Electronic Engineering › Organic Electronics and Photovoltaics
- Physical Sciences › Materials Science › Materials Chemistry › Luminescence and Fluorescent Materials
- Keywords
- conjugated polymers, polymer aggregates, reversible switching, side-chain engineering, chain morphology, photoluminescence, vibronic coupling, single-photon emission
About these checks
Registry, retraction, Cites and statistics results are computed, not judged, with one exception: a printed reference that no index lists is read once by a model before it counts as a citation error. Claims are extracted by a model and kept only when their quote appears verbatim in the text; each cited source is then checked, with a model’s help, for whether it says what the claim relies on. Those verdicts can be wrong — read the claim’s quote and the cited source before relying on one.
Statistics and arithmetic are recomputed, not judged.
Confidence bands are shown only for fields calibrated on our annotated test set. None is calibrated yet, so no band is shown.
What counts as a claim ›How we measure confidence ›How we check this ›
Are you an author, or do you see a problem with this page? Request a review
