

The DOI matches its Crossref record; 65 of the 65 references it cites were found in a registry or an index.
Elucidating the genomic architecture of Asian EGFR-mutant lung adenocarcinoma through multi-region exome sequencing
Open accessAbstract
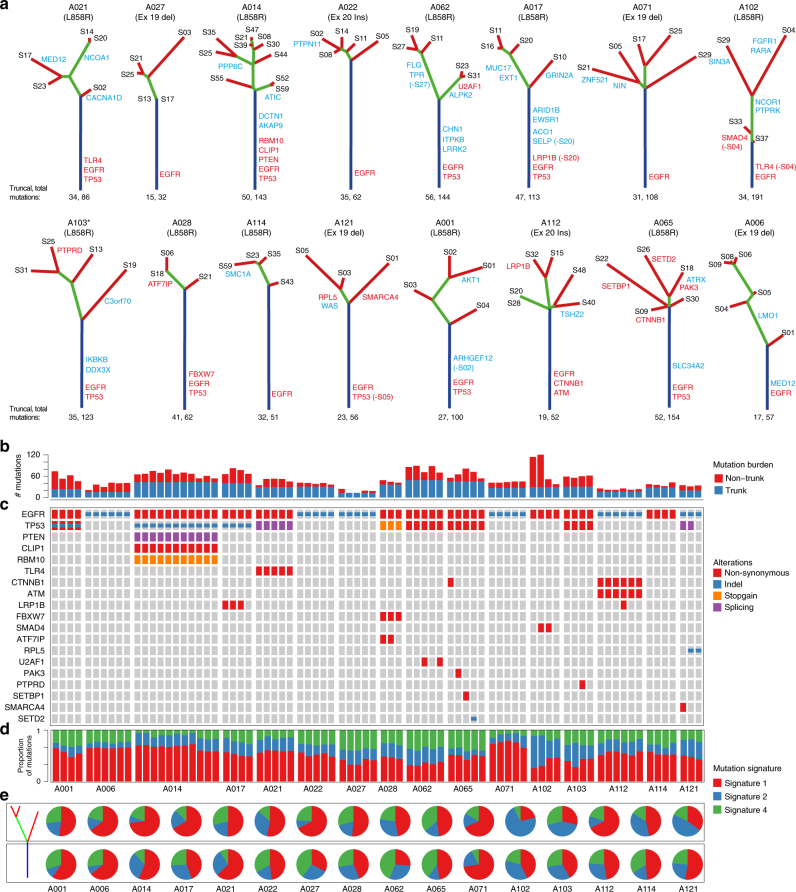
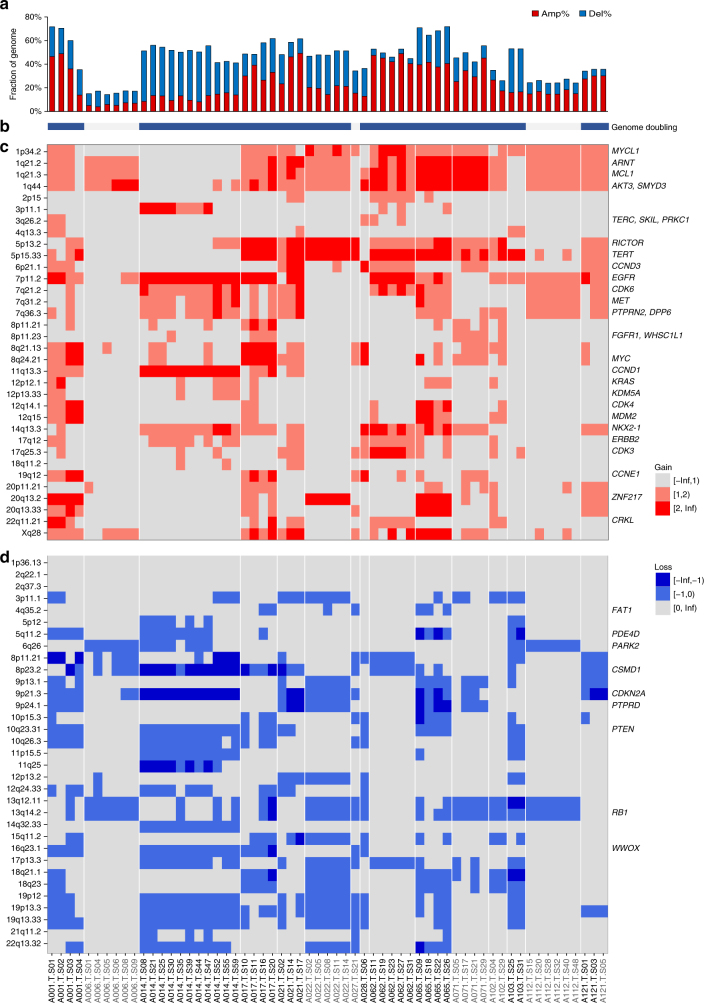
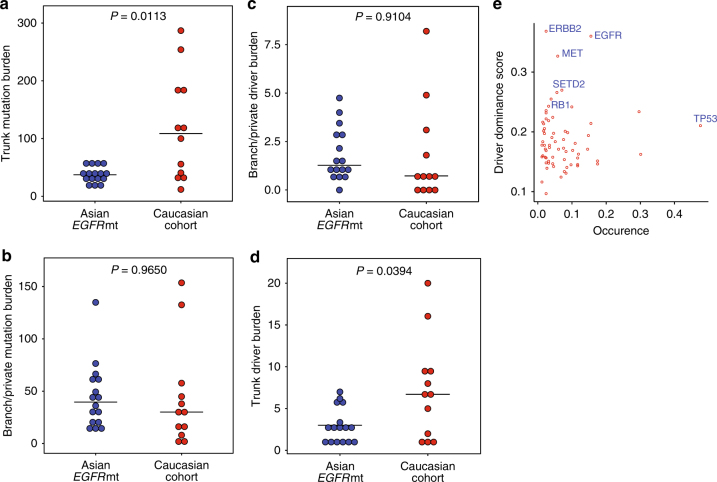
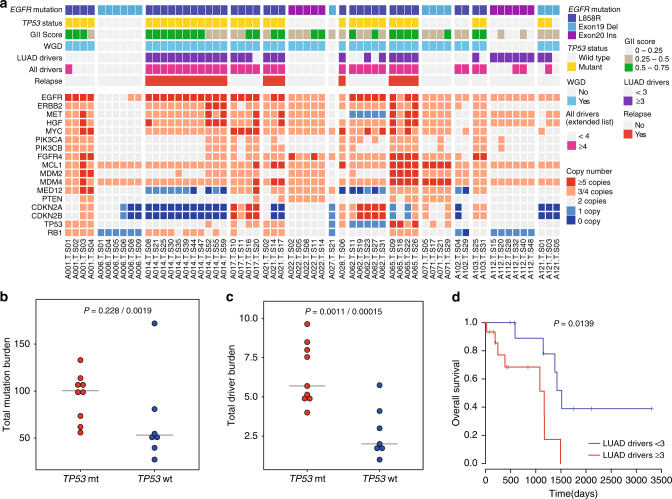
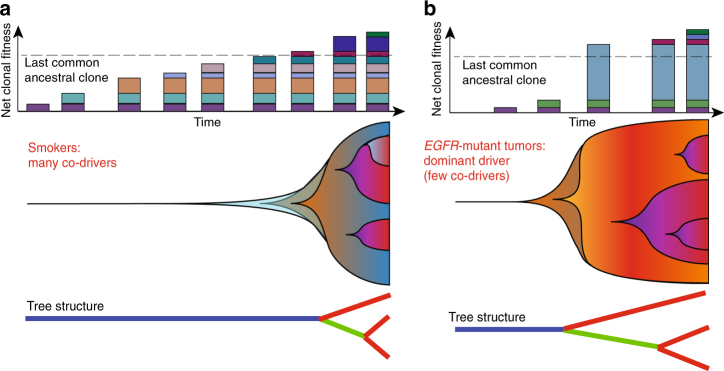
EGFR-mutant lung adenocarcinomas (LUAD) display diverse clinical trajectories and are characterized by rapid but short-lived responses to EGFR tyrosine kinase inhibitors (TKIs). Through sequencing of 79 spatially distinct regions from 16 early stage tumors, we show that despite low mutation burdens, EGFR-mutant Asian LUADs unexpectedly exhibit a complex genomic landscape with frequent and early whole-genome doubling, aneuploidy, and high clonal diversity. Multiple truncal alterations, including TP53 mutations and loss of CDKN2A and RB1, converge on cell cycle dysregulation, with late sector-specific high-amplitude amplifications and deletions that potentially beget drug resistant clones. We highlight the association between genomic architecture and clinical phenotypes, such as co-occurring truncal drivers and primary TKI resistance. Through comparative analysis with published smoking-related LUAD, we postulate that the high intra-tumor heterogeneity observed in Asian EGFR-mutant LUAD may be contributed by an early dominant driver, genomic instability, and low background mutation rates.
Overview
The claims and statistics of this paper haven’t been checked yet.
Run the check — free, no account needed. It reads the open-access text and checks the sources it cites.
Integrity signals
Registry
Cites
Statistics
Figures
Verification
Claims the paper makes
The claims and statistics of this paper haven’t been checked yet.
Run the check — free, no account needed. It reads the open-access text and checks the sources it cites.
Claims other papers make about this one
Each is checked against this paper’s own text: does it say what the citing paper says it does?
In the citing paper
“Thus, data from genetically engineered mouse models (GEMMs) point towards a context-dependent, conditional haplo-insufficient role for Atm loss in KrasG12D-driven lung tumorigenesis.”
From Co-occurring genomic alterations in non-small-cell lung cancer biology and therapy (2019) · cites this paper as [104]
In the citing paper
“In contrast, complete Atm inactivation is incompatible with cellular viability in the context of KrasG12D expression and bi-allelic Trp53 inactivation, suggesting that excessive DNA damage in this context removes incipient cancer cells from the proliferative pool.”
From Co-occurring genomic alterations in non-small-cell lung cancer biology and therapy (2019) · cites this paper as [104]
In the citing paper
“Interestingly, Kras-driven lung carcinogenesis is accelerated by incomplete Atm loss in a p53 deficient setting”
From Co-occurring genomic alterations in non-small-cell lung cancer biology and therapy (2019) · cites this paper as [104]
In the citing paper
“In murine models the impact of Atm inactivation on Kras-driven lung carcinogenesis is context-dependent and varies according to the functional status of p53104.”
From Co-occurring genomic alterations in non-small-cell lung cancer biology and therapy (2019) · cites this paper as [104]
Self-check
Percentages, sums and reported differences re-computed from the paper’s own numbers.
The self-check needs the paper’s full text.
Citations
Cites
Fast and accurate short read alignment with Burrows-Wheeler transform
Li, H., & Durbin, R. (2009) · Bioinformatics · doi:10.1093/bioinformatics/btp324 · Cited by 58,607
ANNOVAR: functional annotation of genetic variants from high-throughput sequencing data
Wang, K., Li, M., & Hakonarson, H. H. (2010) · Nucleic Acids Research · doi:10.1093/nar/gkq603 · Cited by 14,724
A framework for variation discovery and genotyping using next-generation DNA sequencing data
DePristo, M. A., Banks, E., Poplin, R. E., Garimella, K. V., Maguire, J., Hartl, C., Philippakis, A., del Angel, G., Rivas, M. A., Hanna, M., et al. (2011) · Nature Genetics · doi:10.1038/ng.806 · Cited by 11,508
APE: analyses of phylogenetics and evolution in R language
Paradis, E., Claude, J., & Strimmer, K. (2004) · Bioinformatics · doi:10.1093/bioinformatics/btg412 · Cited by 11,335
Signatures of mutational processes in human cancer
Initiative, A. P. C. G., Alexandrov, L. B., ICGC Breast Cancer Consortium, ICGC MMML-Seq Consortium, PedBrain, I., Nik-Zainal, S., Wedge, D. C., Aparicio, S. A. J. R., Behjati, S., Biankin, A. V., et al. (2013) · Nature · doi:10.1038/nature12477 · Cited by 9,660
Gefitinib or Carboplatin–Paclitaxel in Pulmonary Adenocarcinoma
Mok, T. S., Wu, Y.-L., Thongprasert, S., Yang, C.-H., Chu, D.-T., Saijo, N., Sunpaweravong, P., Han, B., Margono, B., Ichinose, Y., et al. (2009) · New England Journal of Medicine · doi:10.1056/nejmoa0810699 · Cited by 8,261
Comprehensive molecular profiling of lung adenocarcinoma
The Cancer Genome Atlas Research Network (2014) · Nature · doi:10.1038/nature13385 · Cited by 5,732
Rosell, R., Carcereny, E., Gervais, R., Vergnenegre, A., Massuti, B., Felip, E., Palmero, R., Garcia-Gomez, R., Pallares, C., Sanchez, J. M., et al. (2012) · The Lancet Oncology · doi:10.1016/s1470-2045(11)70393-x · Cited by 5,489
Mutational heterogeneity in cancer and the search for new cancer-associated genes
Lawrence, M. S., Stojanov, P., Polak, P., Kryukov, G. V., Cibulskis, K., Sivachenko, A., Carter, S. L., Stewart, C., Mermel, C. H., Roberts, S. A., et al. (2013) · Nature · doi:10.1038/nature12213 · Cited by 5,461
Sensitive detection of somatic point mutations in impure and heterogeneous cancer samples
Cibulskis, K., Lawrence, M. S., Carter, S. L., Sivachenko, A., Jaffe, D. B., Sougnez, C. L., Gabriel, S., Meyerson, M. M., Lander, E. S., & Getz, G. A. (2013) · Nature Biotechnology · doi:10.1038/nbt.2514 · Cited by 4,965
Cited by
Sorted by citations
Items 101–174 of 174
Morimoto, K., Yamada, T., Sawada, R., Azuma, K., Gotô, Y., Harada, T., Shiotsu, S., Tamiya, N., Chihara, Y., Takeda, T., et al. (2023) · Cancer Immunology Immunotherapy · doi:10.1007/s00262-023-03370-1 · Cited by 10
Metabolic heterogeneity in tumor cells impacts immunology in lung squamous cell carcinoma
Wang, Q., Sun, N., Zhang, C., Kunzke, T., Zens, P., Feuchtinger, A., Berezowska, S., & Walch, A. K. (2025) · OncoImmunology · doi:10.1080/2162402x.2025.2457797 · Cited by 9
Chang, E., & An, J. (2024) · BMB Reports · doi:10.5483/bmbrep.2023-0244 · Cited by 8
Suda, K., Sakai, K., Obata, K., Ohara, S., Fujino, T., Koga, T., Hamada, A., Soh, J., Nishio, K., & Mitsudomi, T. (2020) · Clinical Lung Cancer · doi:10.1016/j.cllc.2020.09.009 · Cited by 9
What We Have Learned From Adjuvant Therapy for Resected EGFR-Mutant Non–Small-Cell Lung Cancer
Liu, S., Zhang, J., & Wu, Y.-L. L. C. (2021) · Journal of Clinical Oncology · doi:10.1200/jco.21.02443 · Cited by 9
Protocol for Chinese lung cancer evolution and microenvironment tracking under therapy study
Wang, W., He, Y., Yuan, X., Weng, L., Bai, J., Liu, X., Han, L., Xu, J., Wang, S., Lu, S., et al. (2025) · Journal of Translational Internal Medicine · doi:10.1515/jtim-2025-0047 · Cited by 8
Self-citationZhang, X., Xu, Y., Xu, Y., Chao, Y., Hu, Q., Li, C., Ye, M., Zhu, X., Cui, L., Bai, J., et al. (2022) · British Journal of Cancer · doi:10.1038/s41416-022-01969-2 · Cited by 7
Huang, C., Jiang, N., Shen, M., Lai, G. G. Y., Tan, A. C., Jain, A., Saw, S. P. L., Ang, M., Ng, Q. S., Lim, W., et al. (2024) · Cancer Research · doi:10.1158/0008-5472.can-23-2551 · Cited by 8
Self-citationZhao, J., Wang, L., Zhou, A., Wen, S., Fang, W., Zhang, L., Duan, J., Bai, H., Zhong, J., Wan, R., et al. (2024) · Med · doi:10.1016/j.medj.2024.04.011 · Cited by 7
Genomic landscape of ground glass opacities (GGOs) in East Asians
Cao, P., Hu, S., Kong, K., Han, P., Yue, J., Deng, Y. L., Zhao, B., & Li, F. (2021) · Journal of Thoracic Disease · doi:10.21037/jtd-21-82 · Cited by 7
Genomic features and its potential implication in bone oligometastatic NSCLC
Liao, R., Yi, G., Shen, L., Zhang, X., Xu, Z., Peng, Y., & Yang, Z. (2023) · BMC Pulmonary Medicine · doi:10.1186/s12890-023-02354-2 · Cited by 6
Fan, X., Wang, Y., & Tang, X.-Q. (2019) · BMC Bioinformatics · doi:10.1186/s12859-019-2739-z · Cited by 7
Zhang, J., Dong, A., Li, S., Ren, X., & Zhang, X. (2020) · Journal of Thoracic Disease · doi:10.21037/jtd-20-3162 · Cited by 7
Developmental Insights into Lung Cancer
Desai, T. (2021) · Annual Review of Cancer Biology · doi:10.1146/annurev-cancerbio-070820-032858 · Cited by 6
Modeling metastatic progression from cross-sectional cancer genomics data
Rupp, K., Lösch, A., Hu, Y. L., Nie, C., Schill, R., Klever, M., Pfahler, S., Grasedyck, L., Tilo Wettig, B., Beerenwinkel, N., et al. (2024) · Bioinformatics · doi:10.1093/bioinformatics/btae250 · Cited by 6
Experimental and bioinformatics considerations in cancer application of single cell genomics
Tan, J. H. J., Kong, S. L., Tai, J. A., Poh, H. M., Yao, F., Sia, Y. Y., Lim, E. K. H., Takano, A. M., Tan, D. S.-W., Javed, A., et al. (2020) · Computational and Structural Biotechnology Journal · doi:10.1016/j.csbj.2020.12.021 · Cited by 6
Self-citationChoong, W.-K., & Sung, T. (2021) · iScience · doi:10.1016/j.isci.2021.102522 · Cited by 6
Zhang, J., Dong, S., Ji, L., Zhou, J., Chen, Z. H., Su, J., Zhu, Q., Wang, M., Ke, E., Sun, H., et al. (2022) · Thoracic Cancer · doi:10.1111/1759-7714.14393 · Cited by 5
Zhang, H. S., Lu, D., Li, Q., Lu, F., Zhang, J., Wang, Z., Lu, X.-C., & Wang, J. (2021) · Frontiers in Genetics · doi:10.3389/fgene.2021.755245 · Cited by 5
Liu, X., Chen, J., Li, J., Zeng, Z., Jiang, X., Gao, Y., Huang, Z., Wu, Q., Gong, Y. Q., & Xie, C. (2023) · Frontiers in Genetics · doi:10.3389/fgene.2023.1032683 · Cited by 5
Self-citationKobayashi, K. (2023) · Journal of Respiration · doi:10.3390/jor3040021 · Cited by 6
Zhang, Y., Wang, W., Xu, X., Li, Y., Zhang, H., Li, J., & Li, Z. (2021) · Cancer Management and Research · doi:10.2147/cmar.s299563 · Cited by 5
Zhao, J., Wu, Y., Chen, M., Xu, Y., Zhong, W., & Wang, M. (2022) · Journal of Thoracic Disease · doi:10.21037/jtd-22-909 · Cited by 4
Wang, Y., Liu, H., Yu, N., & Xiang, X. (2023) · Current Oncology · doi:10.3390/curroncol30090616 · Cited by 4
Targeting Resistance to Targeted Therapies: Combating a Resilient Foe
Devarakonda, S. H. K., & Govindan, R. (2018) · Clinical Cancer Research · doi:10.1158/1078-0432.ccr-18-3178 · Cited by 4
Frequently mutated genes in predicting the relapse of stage I lung adenocarcinoma
Rao, W., Yang, L., Dai, N., Zhang, L., Liu, J., Yang, B., Li, M., Shan, J., Wang, Q., & Wang, D. (2023) · Clinical & Translational Oncology · doi:10.1007/s12094-023-03074-z · Cited by 4
Huang, Y., Zhang, Y., Duan, X., Hou, R., Wang, Q., & Shi, J. (2024) · Thoracic Cancer · doi:10.1111/1759-7714.15375 · Cited by 4
Yang, H., Zhang, J., Zhang, L., Wen, X., Luo, Y., Yao, D., Cheng, T., Cheng, H., Wang, H., Lou, F., et al. (2019) · Oncology Letters · doi:10.3892/ol.2019.10791 · Cited by 4
Park, B. J., Shim, H. S., Lee, C. Y., Lee, J. G., Kim, H. R., Lee, S. H., Hong, M. H., & Park, S. Y. (2021) · Cancers · doi:10.3390/cancers13112549 · Cited by 5
Sun, P., Zhang, M., Wang, S., He, Y., Lin, C., Tian, Y., Luo, J., & Wang, K. (2026) · Discover Oncology · doi:10.1007/s12672-025-04362-6 · Cited by 3
Masuda, T., Katsumata, S., Isaka, M., Serizawa, M., Kawata, T., 桃子, 浅., Yamaguchi, D., Matsushima, K., Hayasaka, K., Kojima, H., et al. (2025) · Clinical Lung Cancer · doi:10.1016/j.cllc.2025.04.009 · Cited by 3
Fujino, T., Suda, K., Sakai, K., Murakami, I., Shimizu, S., Ohara, S., Koga, T., Hamada, A., Soh, J., Nishio, K., et al. (2021) · Clinical Lung Cancer · doi:10.1016/j.cllc.2021.09.005 · Cited by 3
Wang, C., Yan, J., Lin, S., Ding, Y., & Qin, Y. (2023) · Journal of Cancer Research and Clinical Oncology · doi:10.1007/s00432-023-04801-3 · Cited by 3
Clinical Impact of Genomic and Pathway Alterations in Stage I EGFR-Mutant Lung Adenocarcinoma
Lee, J. S., Kim, E., Kim, K., & Shim, H. S. (2023) · Cancer Research and Treatment · doi:10.4143/crt.2023.728 · Cited by 3
Li, H., Huang, Z., Guo, C., Wang, Y., Li, B., Wang, S., Bai, N., Chen, H., Xue, J., Wang, D., et al. (2024) · npj Precision Oncology · doi:10.1038/s41698-024-00726-3 · Cited by 3
Pal, A. S., Agredo, A., Lanman, N. A., Clingerman, J., Gates, K., & Kasinski, A. L. (2020) · bioRxiv (Cold Spring Harbor Laboratory) · doi:10.1101/2020.03.17.995951 · Cited by 3
Wang, M., Wang, Y., Li, Y., Zhang, C., Li, C., & Bi, N. (2025) · Frontiers in Bioinformatics · doi:10.3389/fbinf.2025.1613761 · Cited by 2
Yang, Y., Qiao, S., Sun, D., Zhang, Z., Zhao, Y., Zhan, J., Huang, Y., Zhao, H., Yang, Y., Wu, K., et al. (2026) · Cell Communication and Signaling · doi:10.1186/s12964-026-02793-4 · Cited by 2
Li, L., Li, J., Jia, J., He, H., Li, M., Xu, Y., Yu, Q., Guo, H., Wang, H., Lv, Z., et al. (2022) · Frontiers in Oncology · doi:10.3389/fonc.2022.963884 · Cited by 3
Correcting for Observation Bias in Cancer Progression Modeling
Schill, R., Klever, M., Lösch, A., Hu, Y. L., Vocht, S., Rupp, K., Grasedyck, L., Spang, R., & Beerenwinkel, N. (2024) · Journal of Computational Biology · doi:10.1089/cmb.2024.0666 · Cited by 7
Takakuwa, K., Mogushi, K., Han, M. J., Fujii, T., Hosoya, M., Yamanami, A., Akita, T., Yamashita, C., Hayashida, T., Kato, S., et al. (2020) · Scientific Reports · doi:10.1038/s41598-020-63200-7 · Cited by 2
Circulating tumour DNA genomics in EGFR-mutant lung adenocarcinoma
Rosell, R., & Karachaliou, N. (2018) · The Lancet Respiratory Medicine · doi:10.1016/s2213-2600(18)30292-3 · Cited by 2
Cancer: Genetics and Important Pathways
Roy, M., & Datta, A. (2019) · Springer eBooks · doi:10.1007/978-981-13-9471-3_2 · Cited by 3
Zatzman, M., Quintanal-Villalonga, À., Salehi, S., Ceglia, N., Lee, J. J.-K., Pupo, A., Falcon, C. J., Rusk, N., Masilionis, I., Chaudhary, O., et al. (2025) · bioRxiv (Cold Spring Harbor Laboratory) · doi:10.1101/2025.05.07.652714 · Cited by 2
Lau, L. Y., Sahib, N. R. B. M., Cangco, C. Y. P., & Tan, A. C. (2026) · Drugs · doi:10.1007/s40265-026-02329-7 · Cited by 1
Zhang, C., Jiang, B., Yan, L.-X., Peng, L., Li, J.-H., Chen, Z.-Y., Sun, Y.-X., su, J., Liao, R.-Q., Dong, S., et al. (2026) · EClinicalMedicine · doi:10.1016/j.eclinm.2026.103994 · Cited by 1
Rare Cancer-Associated Mutations May Affect the AF1 Phosphoregulatory Domain of RARγ
Kopf, E. (2026) · Genes · doi:10.3390/genes17091119 · Cited by 1
Liquid Biopsy and Genomic Assessment for Lung Cancer
Hofman, V., Heeke, S., Allégra, M., Ilié, M., & Hofman, P. M. (2018) · Elsevier eBooks · doi:10.1016/b978-0-12-811785-9.00011-9 · Cited by 1
Qiao, S., Hao, Y., Cai, L., Duan, X., Wang, L., Zhou, A., & Zhu, X. (2023) · Radiation Oncology · doi:10.1186/s13014-023-02239-y · Cited by 1
Deficiency of the splicing factor RBM10 limits EGFR inhibitor response in EGFR mutant lung cancerPreprint
Nanjo, S., Wu, W., Karachaliou, N., Blakely, C. M., Suzuki, J., Ali, S. M., Kerr, D. L., Olivas, V. R., Shue, J., Rotow, J. K., et al. (2020) · bioRxiv (Cold Spring Harbor Laboratory) · doi:10.1101/2020.10.26.356352 · Cited by 1
Self-citationCurrent achievements and future perspectives with liquid biopsy
Sueoka‐Aragane, N. (2020) · Personalized Medicine Universe · doi:10.46459/pmu.2020010
ADAURA: The role of adjuvant EGFR TKI and future consideration (Pro)
Ma, P. C. (2021) · Precision Cancer Medicine · doi:10.21037/pcm-2020-mnsclc-10
Phylomedicine of mutational processes in somatic cancer cell populationsPreprint
Miura, S., Vu, T., Choi, J., & Kumar, S. (2021) · bioRxiv (Cold Spring Harbor Laboratory) · doi:10.1101/2021.04.02.438268
An Update on Targeted Therapy in Advanced Non-small Cell Lung Cancer
Ichihara, E. (2021) · Haigan · doi:10.2482/haigan.61.377
Dong, S., Zhang, J., Ji, L., Zhou, J., Chen, Z., Su, J., Zhu, Q.-G., Wang, M.-M., Ke, E., Sun, H., et al. (2021) · SSRN Electronic Journal · doi:10.2139/ssrn.3924146
Rodriguez, J. G. N., Poma, L. O., Gálvez, M. H. L., Zavaleta, M. C. R., & Pantigoso, W. R. (2021) · Cancer therapy & Oncology International Journal · doi:10.19080/ctoij.2021.18.555979
Zhang, C., Reuben, A., Frank, M. L., Liu, S., Xie, Z., Yan, L., Qiu, Z., Hong, H.-Z., Su, J. J., Tu, H., et al. (2022) · Research Square · doi:10.21203/rs.3.rs-1084110/v1
He, J., Zhang, W., Qian, H., Liu, P., Xu, J., & Gao, W. (2020) · Research Square · doi:10.21203/rs.3.rs-107218/v1
Serna‐Blasco, R., Sánchez‐Herrero, E., de Lope, L. R., Sanz‐Moreno, S., Rodríguez-Festa, A., Trotta, D. A., Cruz‐Bermúdez, A., Franco, F., Sánchez-Hernández, A., Campayo, M. D. J., et al. (2022) · Cancers · doi:10.3390/cancers14184446
Weeden, C. E., Gayevskiy, V., Marceaux, C., Batey, D., Tan, T., Yokote, K., Ribera, N. T., Clatch, A., Christo, S. N., Teh, C. E., et al. (2022) · SSRN Electronic Journal · doi:10.2139/ssrn.4187262
Statistical detecting of genes associated with PIK3C2B on lung disease
Wei, J., Wei, H., Xing, Y., Wang, B., Han, L., Tong, L., & Zhou, Y. (2023) · BIO Web of Conferences · doi:10.1051/bioconf/20235903011
Huang, C., Jiang, N., Shen, M., Lai, G. G. Y., Tan, A. C., Jain, A., Saw, S. P. L., Ang, M., Ng, Q. S., Lim, W., et al. (2023) · bioRxiv (Cold Spring Harbor Laboratory) · doi:10.1101/2023.07.04.547310
Self-citationModeling metastatic progression from cross-sectional cancer genomics dataPreprint
Rupp, K., Lösch, A., Hu, Y. L., Nie, C., Schill, R., Klever, M., Pfahler, S., Grasedyck, L., Tilo Wettig, B., Beerenwinkel, N., et al. (2024) · bioRxiv (Cold Spring Harbor Laboratory) · doi:10.1101/2024.01.30.577989
Additional file 1 of Genomic features and its potential implication in bone oligometastatic NSCLC
Liao, R., Yi, G., Shen, L., Zhang, X., Xu, Z., Peng, Y., & Yang, Z. (2023) · Figshare · doi:10.6084/m9.figshare.22609952
Lim, Z.-F. (2024) · The Research Repository @ WVU (West Virginia University) · doi:10.33915/etd.12594
New therapeutic approaches for EGFR mutated non-small cell lung cancer on osimertinib era
Rubio, J., Hernández, R., Santolaya, C., Martin-Soberon, M. C., Zazo, S., Carvajal, N., & Rojo, F. (2025) · Cancer Treatment and Research Communications · doi:10.1016/j.ctarc.2025.100945 · Cited by 1
Additional file 2 of Genomic features and its potential implication in bone oligometastatic NSCLC
Liao, R., Yi, G., Shen, L., Zhang, X., Xu, Z., Peng, Y., & Yang, Z. (2023) · Figshare · doi:10.6084/m9.figshare.22609955
Qiao, S., Hao, Y., Linbo, C., Duan, X., Wang, L., Zhou, A., & Zhu, X. (2023) · Figshare · doi:10.6084/m9.figshare.22624649
Qiao, S., Hao, Y., Linbo, C., Duan, X., Wang, L., Zhou, A., & Zhu, X. (2023) · Figshare · doi:10.6084/m9.figshare.22624655
Early EGFR Inhibition Triggers Actionable Tumor and Microenvironmental Remodeling in Lung Cancer
Tan, A. C., Yeo, J. C., Alvarez, J. J. S., Pang, M., Guo, Y. A., Hoo, R., Takano, A. M., Ong, B., Goh, D. L. M., Yeong, J. P.-S., et al. (2026) · Cancer Research Communications · doi:10.1158/2767-9764.crc-26-0073
Self-citationPrognostic significance of the MELK/TMPO-AS1/hsa-let-7b-5p network in lung adenocarcinoma
Jangir, K., Kumar, N., Saini, C., Vats, P., Baweja, B., Patidar, P., Soni, R., Lakdawala, H., Singh, J. K., & Nema, R. (2026) · Frontiers in Oncology · doi:10.3389/fonc.2026.1956981
DNA and RNA EGFR Variant Allele Fractions and Clinical Outcomes in Lung Adenocarcinoma
Espinoza, R., Chang, G., Tan, D. S. W., Hsieh, M., Lin, M., Hsu, H., Pang, M., Saw, S. P. L., Skanderup, A., Chen, Y., et al. (2026) · Journal of Thoracic Oncology · doi:10.1016/j.jtho.2026.104176
Self-citationRobles, A. P., Christopoulos, P., Allgäuer, M., Kluck, K., Graf, S., Savai, R., Heußel, C. P., Winter, H., Herth, F. J. F., Thomas, M., et al. (2026) · Lung Cancer · doi:10.1016/j.lungcan.2026.109628
Laaksonen, S., Odintsov, I., Shaw, A. T., & Sholl, L. M. (2026) · Modern Pathology · doi:10.1016/j.modpat.2026.101093
Metadata
- Authors
- Nahar, R., Zhai, W., Zhang, T., Takano, A., Khng, A. J., Lee, Y. Y., Liu, X., Lim, C. H., Koh, T. P. T., Aung, Z. W., Lim, T. K. H., Veeravalli, L., Yuan, J., Teo, A. S. M., Chan, C. X., Poh, H. M., Chua, I. M. L., Liew, A. A., Lau, D. P. X., Kwang, X. L., Toh, C. K., Lim, W.-T., Lim, B., Tam, W. L., Tan, E.-H., Hillmer, A. M., & Tan, D. S. W.
- Affiliations
- Genome Institute of Singapore (SG)
- Nanyang Technological University (SG)
- Singapore General Hospital (SG)
- National Heart Centre Singapore (SG)
- National Cancer Centre Singapore (SG)
- University Hospital Cologne (DE)
- Corresponding author
- Hillmer, Axel M.
- Tan, Daniel S. W.
- ORCID
- Venue
- Nature Communications
- Published
- 2018-01-15
- Volume
- 9
- Issue
- 1
- Pages
- 216-216
- ISSN
- 2041-1723 (ISSN-L)
- PMC
- PMC5768770
- OpenAlex
- W2783397995
- Cited by
- 173
- References
- 65
- Citations by year
- 2026: 10 · 2025: 7 · 2024: 12 · 2023: 26 · 2022: 26 · 2021: 34 · 2020: 25 · 2019: 23 · 2018: 10
- FWCI
- 17.32
- Type
- journal article
- Language
- en
- Open access
- gold
- doi.org
- Locations
- Nature Communications (publishedVersion, cc-by)
- Europe PMC (PubMed Central) (publishedVersion, cc-by)
- PubMed Central (publishedVersion, cc-by)
- PubMed (publishedVersion)
- Kölner Universitäts PublikationsServer (Universität zu Köln) (publishedVersion)
- National University of Singapore (submittedVersion, cc-by)
- RePEc: Research Papers in Economics (submittedVersion)
- DOAJ (DOAJ: Directory of Open Access Journals) (submittedVersion, cc-by-sa)
- DOAJ (DOAJ: Directory of Open Access Journals) (submittedVersion)
- DR-NTU (Nanyang Technological University) (submittedVersion, cc-by)
- Funders
- Francis Crick Institute (10112)
- National Cancer Centre of Singapore
- Nanomaterials Microdevices Research Center, Osaka Institute of Technology
- Singapore General Hospital
- Genome Institute of Singapore
- Medical Research Council
- National Medical Research Council (NMRC/TCR/007-NCC/2013)
- Biomedical Research Council
- Topics
- Health Sciences › Medicine › Pulmonary and Respiratory Medicine › Lung Cancer Treatments and Mutations
- Life Sciences › Biochemistry, Genetics and Molecular Biology › Cancer Research › Cancer Genomics and Diagnostics
- Health Sciences › Medicine › Oncology › Lung Cancer Research Studies
- Keywords
- EGFR-mutant lung adenocarcinoma, Asian patients, whole-genome duplication, aneuploidy, clonal diversity, TP53 mutation, CDKN2A loss, RB1 loss, cell cycle dysregulation, gene amplification, gene deletion, EGFR tyrosine kinase inhibitor resistance, intratumoral heterogeneity, genomic instability, smoking-related lung cancer
- MeSH terms
- Exome Sequencing, Adenocarcinoma, Humans, Lung Neoplasms, Mutation, Drug Resistance, Neoplasm, Genetic Predisposition to Disease, Genomics, Asian People, Cell Line, Tumor, Protein Kinase Inhibitors, ErbB Receptors
About these checks
Registry, retraction, Cites and statistics results are computed, not judged, with one exception: a printed reference that no index lists is read once by a model before it counts as a citation error. Claims are extracted by a model and kept only when their quote appears verbatim in the text; each cited source is then checked, with a model’s help, for whether it says what the claim relies on. Those verdicts can be wrong — read the claim’s quote and the cited source before relying on one.
Statistics and arithmetic are recomputed, not judged.
Confidence bands are shown only for fields calibrated on our annotated test set. None is calibrated yet, so no band is shown.
What counts as a claim ›How we measure confidence ›How we check this ›
Are you an author, or do you see a problem with this page? Request a review
