Cited by 125Pluripotent Stem Cells ResearchDigestive system and related healthTissue Engineering and Regenerative Medicine

The DOI matches its Crossref record; 52 of the 52 references it cites were found in a registry or an index.

Interleukin-2 induces the in vitro maturation of human pluripotent stem cell-derived intestinal organoids

Open access

Abstract

Human pluripotent stem cell (hPSC)-derived intestinal organoids (hIOs) form 3D structures organized into crypt and villus domains, making them an excellent in vitro model system for studying human intestinal development and disease. However, hPSC-derived hIOs still require in vivo maturation to fully recapitulate adult intestine, with the mechanism of maturation remaining elusive. Here, we show that the co-culture with human T lymphocytes induce the in vitro maturation of hIOs, and identify STAT3-activating interleukin-2 (IL-2) as the major factor inducing maturation. hIOs exposed to IL-2 closely mimic the adult intestinal epithelium and have comparable expression levels of mature intestinal markers, as well as increased intestine-specific functional activities. Even after in vivo engraftment, in vitro-matured hIOs retain their maturation status. The results of our study demonstrate that STAT3 signaling can induce the maturation of hIOs in vitro, thereby circumventing the need for animal models and in vivo maturation.

Overview

The claims and statistics of this paper haven’t been checked yet.

Run the check — free, no account needed. It reads the open-access text and checks the sources it cites.

A few free checks a day · papers already verified open instantly · results are public

Integrity signals

Registry

Crossref · 10.1038/s41467-018-05450-8

Cites

52 of 52 references verified0 citation errors · 0 not checkable

Statistics

Figures

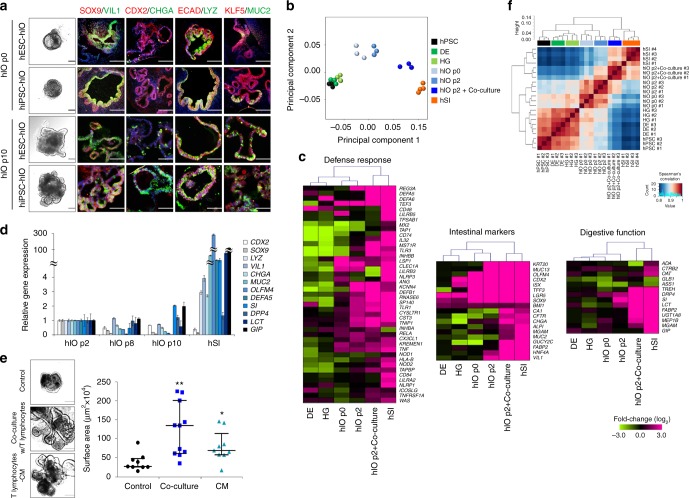
Fig. 1 hPSC-derived hIOs undergo maturation during co-culture with immune cells. a Representative morphology and immunofluorescent staining of hIOs (p0, p10) for gut-specific markers (SOX9, CDX2, and KLF5); the enterocyte marker, VIL1; the goblet cell marker, MUC2; the Paneth cell marker, LYZ; the enteroendocrine cell marker, CHGA; and the epithelial marker, ECAD. Scale bar, 200 μm. b Principal component analysis (PCA) of differentially expressed genes (>2-fold change) from microarray experiments comparing definitive endoderm cells (DE) (n = 3), hindgut cells (HG) (n = 3), hIOs (p0) (n = 3), hIOs (p2) (n = 3), co-cultured hIOs (n = 3) and adult human small intestine (hSI) (n = 4). c Heatmaps of genes involved in the defense response, intestinal markers and genes required for digestion, demonstrating that co-cultured hIOs are the cell type most similar to adult hSI. d qPCR analysis of the expression of intestinal markers and maturation markers in hIO (p2, p8, p10) and hSI. e Representative images of morphological changes occurring in hIOs following co-culture with PMA/ionophore-stimulated Jurkat T cells or treatment with stimulated Jurkat T cell-conditioned medium (CM). Scale bar, 1 mm. Quantitative assessment of the size of hIOs after two passages; n = 9 (control), n = 11 (co-culture), n = 9 (CM) hIOs per group. PMA phorbol myristate acetate, CI calcium ionophore. f Spearman’s correlation was used to cluster samples and generate a heatmap. Red indicating the highest level of similarity between samples and blue indicates the lowest level of similarity. The dendrogram indicates that co-cultured hIOs are similar to hSI samples. Data are presented as mean values of replicates ± SEM. **p < 0.01, *p < 0.05, according to t-test
Fig. 1 hPSC-derived hIOs undergo maturation during co-culture with immune cells. a Representative morphology and immunofluorescent staining of hIOs (p0, p10) for gut-specific markers (SOX9, CDX2, and KLF5); the enterocyte marker, VIL1; the goblet cell marker, MUC2; the Paneth cell marker, LYZ; the enteroendocrine cell marker, CHGA; and the epithelial marker, ECAD. Scale bar, 200 μm. b Principal component analysis (PCA) of differentially expressed genes (>2-fold change) from microarray experiments comparing definitive endoderm cells (DE) (n = 3), hindgut cells (HG) (n = 3), hIOs (p0) (n = 3), hIOs (p2) (n = 3), co-cultured hIOs (n = 3) and adult human small intestine (hSI) (n = 4). c Heatmaps of genes involved in the defense response, intestinal markers and genes required for digestion, demonstrating that co-cultured hIOs are the cell type most similar to adult hSI. d qPCR analysis of the expression of intestinal markers and maturation markers in hIO (p2, p8, p10) and hSI. e Representative images of morphological changes occurring in hIOs following co-culture with PMA/ionophore-stimulated Jurkat T cells or treatment with stimulated Jurkat T cell-conditioned medium (CM). Scale bar, 1 mm. Quantitative assessment of the size of hIOs after two passages; n = 9 (control), n = 11 (co-culture), n = 9 (CM) hIOs per group. PMA phorbol myristate acetate, CI calcium ionophore. f Spearman’s correlation was used to cluster samples and generate a heatmap. Red indicating the highest level of similarity between samples and blue indicates the lowest level of similarity. The dendrogram indicates that co-cultured hIOs are similar to hSI samples. Data are presented as mean values of replicates ± SEM. **p < 0.01, *p < 0.05, according to t-testCC BY · PubMed Central
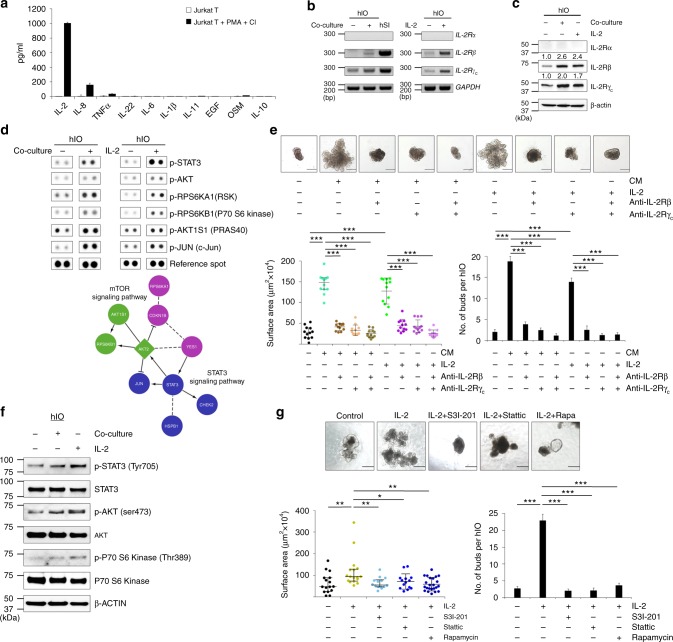
Fig. 2 IL-2 activates STAT3 pathway to induce the in vitro maturation of hIOs. a ELISA quantification of IL-2, IL-8, TNFα, IL-22, IL-6, IL-1β, IL-11, EGF, OSM, and IL-10 concentrations in the culture supernatant of stimulated and unstimulated Jurkat T cells. Expression of IL-2R subunits as analyzed by RT-PCR b and Western blot analyses c in co-cultured or IL-2-treated hIOs. d Phosphorylation levels of proteins from multiple signaling pathways in control, co-cultured and IL-2-treated hIOs as reported by a human phospho-kinase array (upper panels). Analysis by functional interaction (FI) network highlighted a significant enrichment of phospho-proteins in the mTOR and STAT3 signaling pathways (lower panels). In the FI network, arrows represent activating/catalyzing connections, solid lines ending in a perpendicular line represent inhibition, solid lines represent complexes or inputs and dashed lines represent predicted FI connections. e Representative images of the morphology of hIOs cultured in the presence of 1 ng/ml IL-2, a key component of the co-culture system, or stimulated Jurkat T conditioned medium (CM) with or without IL-2R-inactivating antibodies (anti-IL-2Rβ, anti-IL-2Rγc) for two passages. Quantitative assessment of the size of hIOs (left bottom) and the number of budding structure per hIO (right bottom); n = 12 hIOs per group. f Representative Western blot analysis of p-STAT3, p-AKT and p-P70 S6 Kinase levels in co-cultured and IL-2-treated hIOs. g hIOs cultured in the presence of IL-2 (1 ng/ml) with or without the addition of S3I-201 (5 μM), Stattic (1 μM) or Rapamycin (Rapa; 10 nM). Quantitative assessment of the size of hIOs after one passage (14 days) (left bottom) and the number of budding structure per hIO (right bottom); n = 14 hIOs per group. Data are presented as mean values of replicates ± SEM. ***p < 0.001, **p < 0.01, and *p < 0.05 according to t-test. Scale bar, 500 μm
Fig. 2 IL-2 activates STAT3 pathway to induce the in vitro maturation of hIOs. a ELISA quantification of IL-2, IL-8, TNFα, IL-22, IL-6, IL-1β, IL-11, EGF, OSM, and IL-10 concentrations in the culture supernatant of stimulated and unstimulated Jurkat T cells. Expression of IL-2R subunits as analyzed by RT-PCR b and Western blot analyses c in co-cultured or IL-2-treated hIOs. d Phosphorylation levels of proteins from multiple signaling pathways in control, co-cultured and IL-2-treated hIOs as reported by a human phospho-kinase array (upper panels). Analysis by functional interaction (FI) network highlighted a significant enrichment of phospho-proteins in the mTOR and STAT3 signaling pathways (lower panels). In the FI network, arrows represent activating/catalyzing connections, solid lines ending in a perpendicular line represent inhibition, solid lines represent complexes or inputs and dashed lines represent predicted FI connections. e Representative images of the morphology of hIOs cultured in the presence of 1 ng/ml IL-2, a key component of the co-culture system, or stimulated Jurkat T conditioned medium (CM) with or without IL-2R-inactivating antibodies (anti-IL-2Rβ, anti-IL-2Rγc) for two passages. Quantitative assessment of the size of hIOs (left bottom) and the number of budding structure per hIO (right bottom); n = 12 hIOs per group. f Representative Western blot analysis of p-STAT3, p-AKT and p-P70 S6 Kinase levels in co-cultured and IL-2-treated hIOs. g hIOs cultured in the presence of IL-2 (1 ng/ml) with or without the addition of S3I-201 (5 μM), Stattic (1 μM) or Rapamycin (Rapa; 10 nM). Quantitative assessment of the size of hIOs after one passage (14 days) (left bottom) and the number of budding structure per hIO (right bottom); n = 14 hIOs per group. Data are presented as mean values of replicates ± SEM. ***p < 0.001, **p < 0.01, and *p < 0.05 according to t-test. Scale bar, 500 μmCC BY · PubMed Central
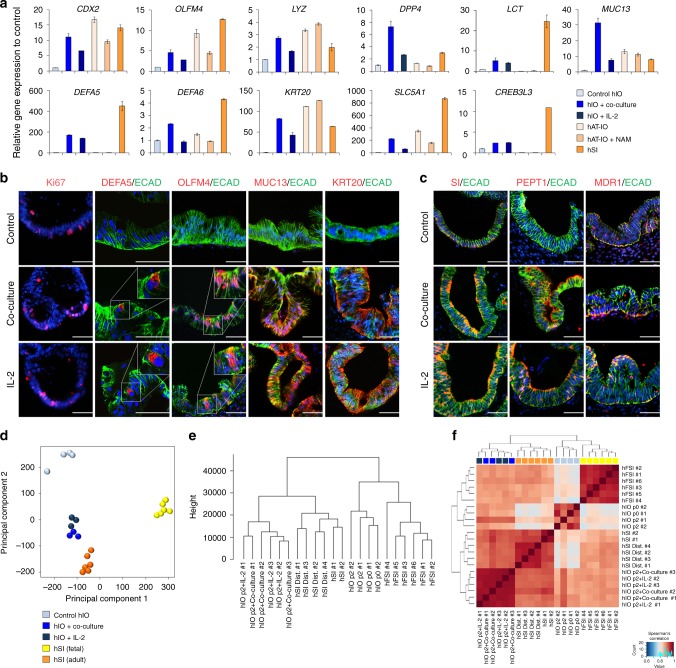
Fig. 3 Co-cultured or IL-2-treated hIOs express the markers of mature small intestine. a qPCR analysis of the expression of markers of intestinal maturation in control, co-cultured and IL-2-treated hIOs, human adult tissue-derived intestinal organoids (hAT-IOs) cultured in the presence or absence of nicotinamide (NAM), and hSI. NAM was used to improve the culture efficiency of hAT-IOs. Fold changes in expression level are relative to control hIOs. b Immunofluorescent staining of control, co-cultured and IL-2-treated hIOs with a proliferation marker (Ki-67), an epithelial marker (ECAD) and mature intestinal markers (DEFA5, OLFM4, MUC13, and KRT20). Scale bar, 50 μm. c Immunofluorescent staining for the intestinal enzyme sucrase-isomaltase (SI) and intestinal transporters (peptide transporter 1, PEPT1; multidrug resistance protein 1, MDR1). Scale bar, 50 μm. d PCA of the RNA-sequencing datasets for control hIOs (n = 4), co-cultured hIOs (hIO + co-culture, n = 3), IL-2 treated hIOs (hIO + IL-2, n = 3), human fetal small intestine (hFSI) (n = 6) and adult human small intestine (hSI) (n = 6). e A dendrogram based on hierarchical clustering of the gene sets from the RNA-sequencing using Canberra distance. Branch lengths indicate the degree of difference between samples. f Spearman’s correlation was used to cluster samples and generate a heatmap. Red indicates the highest level of similarity between samples and blue indicates the lowest level of similarity. Data are presented as mean values of replicates ± SEM
Fig. 3 Co-cultured or IL-2-treated hIOs express the markers of mature small intestine. a qPCR analysis of the expression of markers of intestinal maturation in control, co-cultured and IL-2-treated hIOs, human adult tissue-derived intestinal organoids (hAT-IOs) cultured in the presence or absence of nicotinamide (NAM), and hSI. NAM was used to improve the culture efficiency of hAT-IOs. Fold changes in expression level are relative to control hIOs. b Immunofluorescent staining of control, co-cultured and IL-2-treated hIOs with a proliferation marker (Ki-67), an epithelial marker (ECAD) and mature intestinal markers (DEFA5, OLFM4, MUC13, and KRT20). Scale bar, 50 μm. c Immunofluorescent staining for the intestinal enzyme sucrase-isomaltase (SI) and intestinal transporters (peptide transporter 1, PEPT1; multidrug resistance protein 1, MDR1). Scale bar, 50 μm. d PCA of the RNA-sequencing datasets for control hIOs (n = 4), co-cultured hIOs (hIO + co-culture, n = 3), IL-2 treated hIOs (hIO + IL-2, n = 3), human fetal small intestine (hFSI) (n = 6) and adult human small intestine (hSI) (n = 6). e A dendrogram based on hierarchical clustering of the gene sets from the RNA-sequencing using Canberra distance. Branch lengths indicate the degree of difference between samples. f Spearman’s correlation was used to cluster samples and generate a heatmap. Red indicates the highest level of similarity between samples and blue indicates the lowest level of similarity. Data are presented as mean values of replicates ± SEMCC BY · PubMed Central
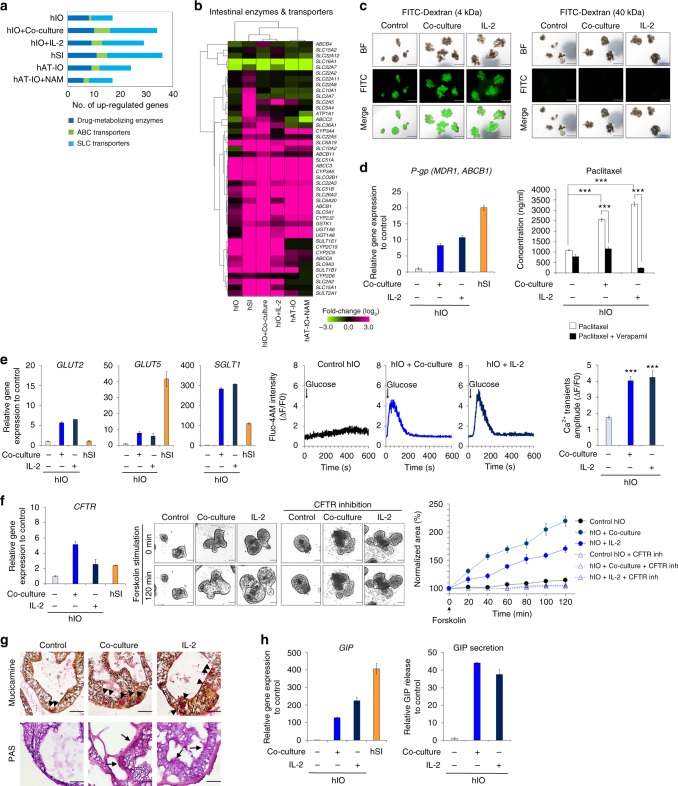
Fig. 4 In vitro-matured hIOs have significantly enhanced functionalities. a Comparison of the gene expression of drug-metabolizing enzymes (phase I/II enzymes) and intestinal transporters (ABC transporters and SLC transporters) among hIOs, hAT-IOs, and hSI. The graph represents the number of genes with expression >2-fold when compared with the control hIOs. b Hierarchical clustering of the expression level of genes encoding intestinal enzymes and transporters in control, co-cultured, and IL-2-treated hIOs, hAT-IOs, and hSI. c Paracellular permeability of hIOs incubated with 4 kDa FITC-Dextran and 40 kDa FITC-Dextran. Scale bar, 1 mm. d Expression levels of the transporter P-gp (MDR1, ABCB1) relative to control hIOs as assessed by qPCR (left panel). Apical concentration of paclitaxel following 2 h incubation in the absence or presence of verapamil in control, co-cultured or IL-2-treated hIOs (right panel, n = 20 per group). e Expression levels of the glucose transporters (GLUT2, GLUT5, SGLT1) in control, co-cultured, IL-2 treated hIOs, and hSI as assessed by qPCR (left panels). Glucose-induced Ca2+ transients in real-time manner in control, co-cultured and IL-2 treated hIOs (middle panels). Mean values of peak fluorescence intensity by using Fluo-4-AM calcium indicator (right panel) (n = 15 per group). f Expression levels of the CFTR in control, co-cultured, IL-2 treated hIO and hSI as assessed by qPCR (left panel). Representative images of the morphological changes of hIOs after treatment with forskolin (middle panel). Scale bar, 200 μm. Normalized forskolin-induced swelling of control, co-cultured, and IL-2 treated hIOs with or without CFTR inhibitors (GlyH101 + CFTRinh 172) (right panel, n = 4 per group). g Mucicarmine staining for secreted mucin and acid mucopolysaccharide (black arrowheads), and PAS staining for the mucous layer (black arrows) and mucous producing goblet cells. Scale bar, 50 μm. h Expression levels of intestinal hormone GIP of control, co-cultured, and IL-2 treated hIOs and hSI (left panel). The levels of secreted GIP from enteroendocrine cells in hIOs ELISA for detection of, and normalized to DNA content (right panel). Data are presented as mean values of replicates ± SEM. ***p < 0.001 according to t-test
Fig. 4 In vitro-matured hIOs have significantly enhanced functionalities. a Comparison of the gene expression of drug-metabolizing enzymes (phase I/II enzymes) and intestinal transporters (ABC transporters and SLC transporters) among hIOs, hAT-IOs, and hSI. The graph represents the number of genes with expression >2-fold when compared with the control hIOs. b Hierarchical clustering of the expression level of genes encoding intestinal enzymes and transporters in control, co-cultured, and IL-2-treated hIOs, hAT-IOs, and hSI. c Paracellular permeability of hIOs incubated with 4 kDa FITC-Dextran and 40 kDa FITC-Dextran. Scale bar, 1 mm. d Expression levels of the transporter P-gp (MDR1, ABCB1) relative to control hIOs as assessed by qPCR (left panel). Apical concentration of paclitaxel following 2 h incubation in the absence or presence of verapamil in control, co-cultured or IL-2-treated hIOs (right panel, n = 20 per group). e Expression levels of the glucose transporters (GLUT2, GLUT5, SGLT1) in control, co-cultured, IL-2 treated hIOs, and hSI as assessed by qPCR (left panels). Glucose-induced Ca2+ transients in real-time manner in control, co-cultured and IL-2 treated hIOs (middle panels). Mean values of peak fluorescence intensity by using Fluo-4-AM calcium indicator (right panel) (n = 15 per group). f Expression levels of the CFTR in control, co-cultured, IL-2 treated hIO and hSI as assessed by qPCR (left panel). Representative images of the morphological changes of hIOs after treatment with forskolin (middle panel). Scale bar, 200 μm. Normalized forskolin-induced swelling of control, co-cultured, and IL-2 treated hIOs with or without CFTR inhibitors (GlyH101 + CFTRinh 172) (right panel, n = 4 per group). g Mucicarmine staining for secreted mucin and acid mucopolysaccharide (black arrowheads), and PAS staining for the mucous layer (black arrows) and mucous producing goblet cells. Scale bar, 50 μm. h Expression levels of intestinal hormone GIP of control, co-cultured, and IL-2 treated hIOs and hSI (left panel). The levels of secreted GIP from enteroendocrine cells in hIOs ELISA for detection of, and normalized to DNA content (right panel). Data are presented as mean values of replicates ± SEM. ***p < 0.001 according to t-testCC BY · PubMed Central
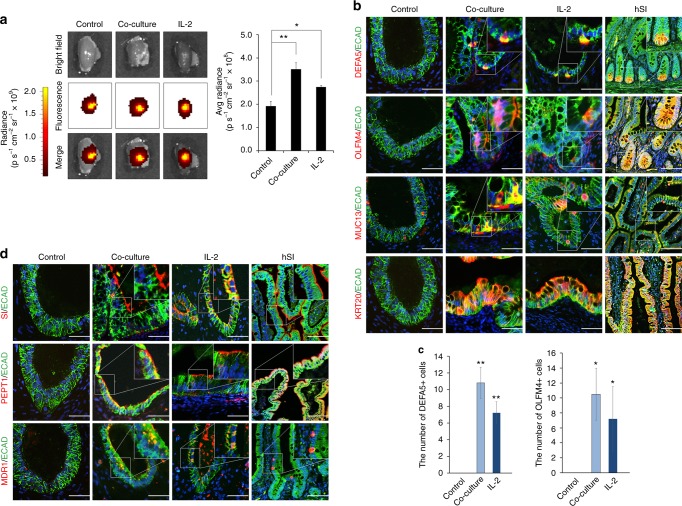
Fig. 5 In vitro-matured hIOs can retain their maturation status in vivo. a Ex vivo fluorescence images of the kidney of immunodeficient (NSG) mice transplanted with DiR-labeled hIOs 1 week after transplantation using an IVIS imaging system (left panels). Quantification of the fluorescence intensity, expressed as the average radiance of the DiR-labeled hIOs (right panels; n = 3). p s−1 cm−2 sr−1, photons per second per cm2 per steradian. b Immunofluorescent staining for the intestinal maturation markers DEFA5, OLFM4, KRT20 and MUC13 in control, co-cultured and IL-2-treated hIOs following transplantation. Adult human small intestine (hSI) tissues were used as controls. c The number of DEFA5+ and OLFM4+ cells in control, co-cultured and IL-2-treated hIOs. Expression of DEFA5+ cells (left panel; n = 5) and OLFM4+ cells (right panel; n = 4). d Immunofluorescent staining for the intestinal enzyme sucrase-isomaltase (SI) and intestinal transporters (peptide transporter 1, PEPT1; multidrug resistance protein 1, MDR1) in control, co-cultured and IL-2-treated hIOs following transplantation. hSI tissues were used as controls. Data are presented as mean values of replicates ± SEM. *p < 0.05 and **p < 0.01 according to t-test
Fig. 5 In vitro-matured hIOs can retain their maturation status in vivo. a Ex vivo fluorescence images of the kidney of immunodeficient (NSG) mice transplanted with DiR-labeled hIOs 1 week after transplantation using an IVIS imaging system (left panels). Quantification of the fluorescence intensity, expressed as the average radiance of the DiR-labeled hIOs (right panels; n = 3). p s−1 cm−2 sr−1, photons per second per cm2 per steradian. b Immunofluorescent staining for the intestinal maturation markers DEFA5, OLFM4, KRT20 and MUC13 in control, co-cultured and IL-2-treated hIOs following transplantation. Adult human small intestine (hSI) tissues were used as controls. c The number of DEFA5+ and OLFM4+ cells in control, co-cultured and IL-2-treated hIOs. Expression of DEFA5+ cells (left panel; n = 5) and OLFM4+ cells (right panel; n = 4). d Immunofluorescent staining for the intestinal enzyme sucrase-isomaltase (SI) and intestinal transporters (peptide transporter 1, PEPT1; multidrug resistance protein 1, MDR1) in control, co-cultured and IL-2-treated hIOs following transplantation. hSI tissues were used as controls. Data are presented as mean values of replicates ± SEM. *p < 0.05 and **p < 0.01 according to t-testCC BY · PubMed Central

Verification

Claims the paper makes

The claims and statistics of this paper haven’t been checked yet.

Run the check — free, no account needed. It reads the open-access text and checks the sources it cites.

A few free checks a day · papers already verified open instantly · results are public

Claims other papers make about this one

Each is checked against this paper’s own text: does it say what the citing paper says it does?

Self-check

Percentages, sums and reported differences re-computed from the paper’s own numbers.

The self-check needs the paper’s full text.

Citations

Cites

Show all 52 references

Research works printed but not linked: 1

  1. Madsen, K.L. & Jijon, H. in Cytokine Knockouts. (ed Fantuzzi, G.) 237–251 (Humana Press, Totowa, 2003).

Cited by

Sorted by citations

See all 125

Metadata

Authors
Jung, K. B., Lee, H., Son, Y. S., Lee, M.-O., Kim, Y.-D., Oh, S. J., Kwon, O., Cho, S., Cho, H.-S., Kim, D.-S., Oh, J.-H., Zilbauer, M., Min, J.-K., Jung, C.-R., Kim, J., & Son, M.-Y.
Affiliations
  • Korea Research Institute of Bioscience and Biotechnology (KR)
  • Asan Medical Center (KR)
  • Korea Institute of Toxicology (KR)
  • Addenbrooke's Hospital (GB)
Corresponding author
  • Kim, Young-Dae
  • Jung, Cho-Rok
  • Kim, Janghwan
  • Son, Mi-Young
Venue
Nature Communications
Published
2018-08-02
Volume
9
Issue
1
Pages
3039-3039
ISSN
2041-1723 (ISSN-L)
OpenAlex
W2883753684
Cited by
125
References
52
Citations by year
2026: 10 · 2025: 10 · 2024: 19 · 2023: 6 · 2022: 18 · 2021: 19 · 2020: 25 · 2019: 14 · 2018: 4
FWCI
5.51
Type
journal article
Language
en
Open access
Locations
  • Nature Communications (publishedVersion, cc-by)
  • Europe PMC (PubMed Central) (publishedVersion, cc-by)
  • PubMed Central (publishedVersion, cc-by)
  • PubMed (publishedVersion)
  • RePEc: Research Papers in Economics (submittedVersion)
  • DOAJ (DOAJ: Directory of Open Access Journals) (submittedVersion)
  • DOAJ (DOAJ: Directory of Open Access Journals) (submittedVersion, cc-by-sa)
  • KRIBB Repository (submittedVersion)
  • Apollo (University of Cambridge) (submittedVersion, cc-by)
  • Apollo (cc-by)
Funders
  • National Research Foundation of Korea (2016R1A2B4013501)
  • Korea Research Institute of Bioscience and Biotechnology (KRIBB Research Initiative Program)
Topics
  • Life Sciences › Biochemistry, Genetics and Molecular Biology › Molecular Biology › Pluripotent Stem Cells Research
  • Health Sciences › Medicine › Gastroenterology › Digestive system and related health
  • Health Sciences › Medicine › Surgery › Tissue Engineering and Regenerative Medicine
Keywords
intestinal organoids, pluripotent stem cells, interleukin-2, STAT3 signaling, organoid maturation, T cells, co-culture, intestinal epithelium, intestinal development
MeSH terms
Cell Differentiation, Humans, Interleukin-2, Intestines, Organoids, T-Lymphocytes, Signal Transduction, Biomarkers, Coculture Techniques, Pluripotent Stem Cells, STAT3 Transcription Factor

About these checks

Registry, retraction, Cites and statistics results are computed, not judged, with one exception: a printed reference that no index lists is read once by a model before it counts as a citation error. Claims are extracted by a model and kept only when their quote appears verbatim in the text; each cited source is then checked, with a model’s help, for whether it says what the claim relies on. Those verdicts can be wrong — read the claim’s quote and the cited source before relying on one.

Statistics and arithmetic are recomputed, not judged.

Confidence bands are shown only for fields calibrated on our annotated test set. None is calibrated yet, so no band is shown.

What counts as a claim ›How we measure confidence ›How we check this ›

Are you an author, or do you see a problem with this page? Request a review