Cited by 47

The DOI matches its Crossref record; 3 of the 3 references it cites were found in a registry or an index.

STAT3-coordinated migration facilitates the dissemination of diffuse large B-cell lymphomas

Pan, Yi-Ru, Chen, Chih-Cheng, Chan, Yu-Tien, Wang, Hsiao-Jung, Chien, Fan-Tso, Chen, Yeng-Long, Liu, Jing-Lan, Yang, Muh-Hwa·2018·Nature Communications

Abstract

The motile characteristics and mechanisms that drive the dissemination of diffuse large B-cell lymphoma (DLBCL) are elusive. Here, we show that DLBCL initiates dissemination through activating STAT3-mediated amoeboid migration. Mechanistically, STAT3 activates RHOH transcription, which competes with the RhoGDP dissociation inhibitor RhoGDIγ to activate RhoA. In addition, activated STAT3 regulates microtubule dynamics and releases ARHGEF2 to activate RhoA. Both the JAK inhibitor ruxolitinib and the microtubule stabilizer Taxol suppress DLBCL cell dissemination in vivo. A clinical DLBCL sample analysis shows that STAT3-driven amoeboid movement is particularly important for the transition from stage I to stage II. This study elucidates the mechanism of DLBCL dissemination and progression and highlights the potential of combating advanced DLBCL with a JAK/STAT inhibitor or microtubule stabilizer to reduce DLBCL motility; these findings may have a great impact on the development of patient-tailored treatments for DLBCL.

Overview

The claims and statistics of this paper haven’t been checked yet.

Run the check — free, no account needed. It reads the open-access text and checks the sources it cites.

A few free checks a day · papers already verified open instantly · results are public

Integrity signals

Registry

Crossref · 10.1038/s41467-018-06134-z

Cites

3 of 3 references verified0 citation errors · 0 not checkable

Statistics

Figures

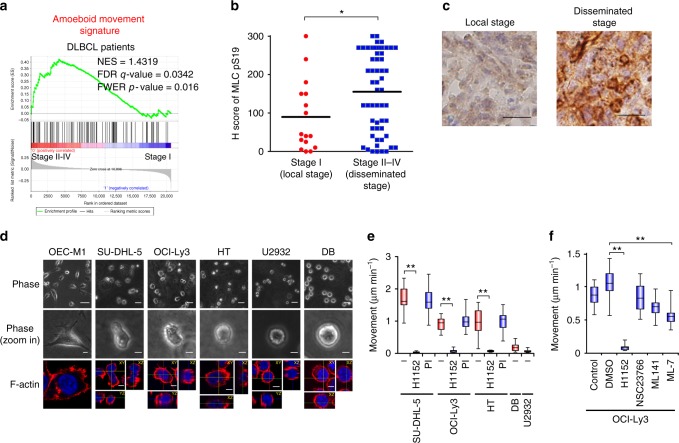
Fig. 1 Amoeboid movement is involved in the early dissemination of DLBCL. a GSEA for examining the association between the amoeboid movement signature and gene expression array from DLBCL patients with stage II–IV vs. stage I (GSE11318). b Distribution of the H score for MLC S19 phosphorylation (MLCpS19) from DLBCL patients. n = 72. c Representative results of immunohistochemical staining for MLC S19 phosphorylation. Scale bar = 20 μm. d SU-DHL-5, OCI-Ly3, HT, U2932, and DB cells were grown in collagen gels and OEC-M1 cells were grown on top of collagen gels overnight. Upper and middle: representative phase-contrast images. Scale bar = 50 μm (Upper) or 10 μm (middle). Lower: immunofluorescent staining for F-actin (red). Blue, nuclei. Scale bar = 5 μm. e Quantification of movement speeds of lymphoma cell lines treated with inhibitors (n = 20). PI: proteinase inhibitor. f Quantification of movement speeds of OCI-Ly3 cells treated with inhibitors (n = 20). *P < 0.05, **P < 0.005 by Student’s t-test; Kolmogorov–Smirnov tests for GSEA. See also Supplementary Fig. 1 and Supplementary Movie 1. See Supplementary Table 1 for patient demographics in b and c; Supplementary Data 2 for amoeboid signature in a; Supplementary Table 4 for working concentration of inhibitors in e and f
Fig. 1 Amoeboid movement is involved in the early dissemination of DLBCL. a GSEA for examining the association between the amoeboid movement signature and gene expression array from DLBCL patients with stage II–IV vs. stage I (GSE11318). b Distribution of the H score for MLC S19 phosphorylation (MLCpS19) from DLBCL patients. n = 72. c Representative results of immunohistochemical staining for MLC S19 phosphorylation. Scale bar = 20 μm. d SU-DHL-5, OCI-Ly3, HT, U2932, and DB cells were grown in collagen gels and OEC-M1 cells were grown on top of collagen gels overnight. Upper and middle: representative phase-contrast images. Scale bar = 50 μm (Upper) or 10 μm (middle). Lower: immunofluorescent staining for F-actin (red). Blue, nuclei. Scale bar = 5 μm. e Quantification of movement speeds of lymphoma cell lines treated with inhibitors (n = 20). PI: proteinase inhibitor. f Quantification of movement speeds of OCI-Ly3 cells treated with inhibitors (n = 20). *P < 0.05, **P < 0.005 by Student’s t-test; Kolmogorov–Smirnov tests for GSEA. See also Supplementary Fig. 1 and Supplementary Movie 1. See Supplementary Table 1 for patient demographics in b and c; Supplementary Data 2 for amoeboid signature in a; Supplementary Table 4 for working concentration of inhibitors in e and fCC BY · PubMed Central
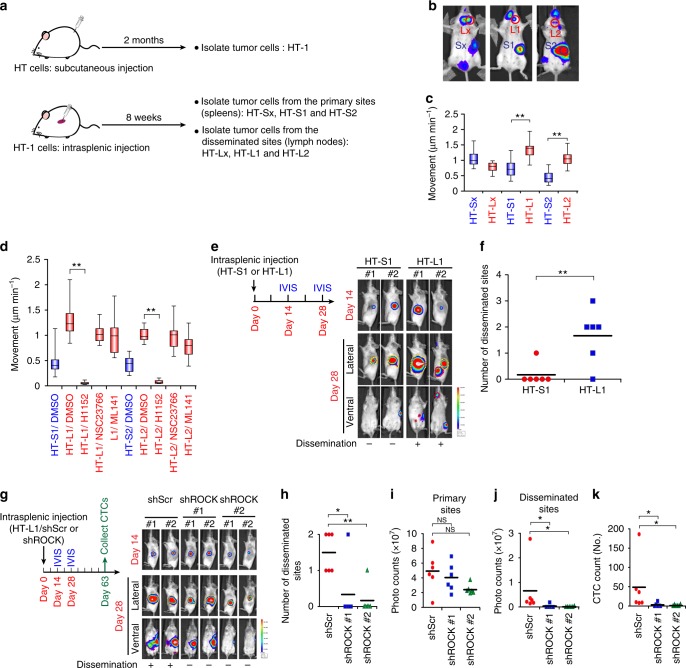
Fig. 2 Amoeboid movement mediates DLBCL dissemination in vivo. a A schema for showing the establishment of DLBCL sublines with increased tumorigenic and disseminating capability. b Mice experiments for generating the HT sublines. HT-1 subline cells were injected into the splenic parenchyma, and the bioluminescent signals were detected on day 56. c Quantification of movement speeds of different sublines (n = 20). d Quantification of movement speeds of different sublines treated with corresponding inhibitors (n = 20). e Investigation of the in vivo dissemination of the HT-S1 or HT-L1 sublines. Cells were injected into the splenic parenchyma. Mice bioluminescent signals on indicated days were detected (n = 6; other 4 mice in Supplementary Fig. 2d). f Quantification of disseminated numbers (red dotted lines) in e and Supplementary Fig. 2d. g Investigation of the in vivo dissemination of HT-L1 receiving shRNAs specific to ROCK I (shROCK; clones #1, #2) or a scramble sequence (shScr). The cells were injected into the splenic parenchyma. Mice bioluminescent signals on indicated days were detected (n = 6; other 4 mice in Supplementary Fig. 2h). h Quantification of the numbers disseminated lesions in g and Supplementary Fig. 2h. i, j Quantification of bioluminescent intensity of g and Supplementary Fig. 2h from the primary sites (yellow dotted line circled area in photos)(i) and the disseminated sites (red dotted lines circled area in photos) (j). NS, not significant. k Quantification of the CTCs (circulating tumor cells) collected from the mice described in panel g (n = 6). *P < 0.05, **P < 0.005 by Student’s t-test. See also Supplementary Fig. 2 and Supplementary Movie 2. See Supplementary Table 4 for working concentration of inhibitors
Fig. 2 Amoeboid movement mediates DLBCL dissemination in vivo. a A schema for showing the establishment of DLBCL sublines with increased tumorigenic and disseminating capability. b Mice experiments for generating the HT sublines. HT-1 subline cells were injected into the splenic parenchyma, and the bioluminescent signals were detected on day 56. c Quantification of movement speeds of different sublines (n = 20). d Quantification of movement speeds of different sublines treated with corresponding inhibitors (n = 20). e Investigation of the in vivo dissemination of the HT-S1 or HT-L1 sublines. Cells were injected into the splenic parenchyma. Mice bioluminescent signals on indicated days were detected (n = 6; other 4 mice in Supplementary Fig. 2d). f Quantification of disseminated numbers (red dotted lines) in e and Supplementary Fig. 2d. g Investigation of the in vivo dissemination of HT-L1 receiving shRNAs specific to ROCK I (shROCK; clones #1, #2) or a scramble sequence (shScr). The cells were injected into the splenic parenchyma. Mice bioluminescent signals on indicated days were detected (n = 6; other 4 mice in Supplementary Fig. 2h). h Quantification of the numbers disseminated lesions in g and Supplementary Fig. 2h. i, j Quantification of bioluminescent intensity of g and Supplementary Fig. 2h from the primary sites (yellow dotted line circled area in photos)(i) and the disseminated sites (red dotted lines circled area in photos) (j). NS, not significant. k Quantification of the CTCs (circulating tumor cells) collected from the mice described in panel g (n = 6). *P < 0.05, **P < 0.005 by Student’s t-test. See also Supplementary Fig. 2 and Supplementary Movie 2. See Supplementary Table 4 for working concentration of inhibitorsCC BY · PubMed Central
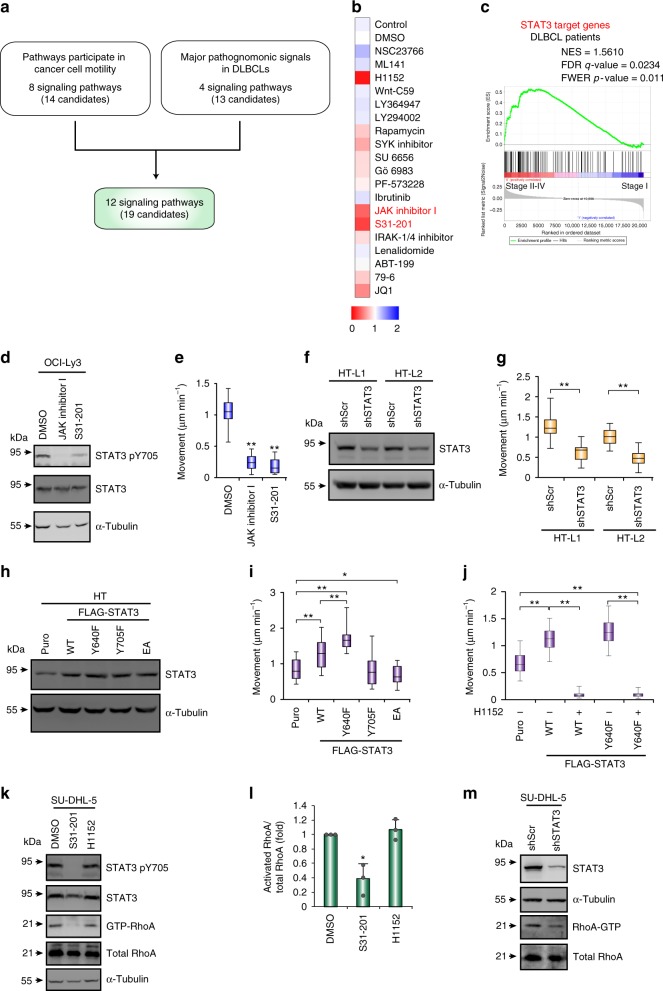
Fig. 3 JAK-STAT3 signaling is the major pathway mediating cell movement in DLBCL. a A schema for showing the mining process for identification of the signaling pathways that regulate amoeboid movement in DLBCL. See Supplementary Table 3 for the information and references for the signal pathways. b A heat map showing the relative cell movement of SU-DHL-5 cells upon the treatment of inhibitors. The velocity of the cells was measured and expressed as fold relative the level control cells. Red, decreased motility level; blue, increased motility level. c A GSEA plot for showing the association between STAT3-regulated signature (Supplementary Data 2) and DLBCL stage I vs. II–IV (GSE11318). d Western blots for showing the efficacy of OCI-Ly3 cells treated with indicated inhibitors. e Quantification of movement speeds of inhibitor treated OCI-Ly3 cells (n = 20). f Western blots for showing the knockdown efficacy of HT-L1 and HT-L2 sublines receiving shRNAs specific to STAT3 (shSTAT3) or scramble (shScr). g Quantification of movement speeds of the cells described in panel f (n = 30). h Western blots for showing the transfection efficacy of HT cells expressing FLAG-STAT3 WT and its mutants. i Quantification of movement speeds of cells described in panel h (n = 20). j Quantification of movement speeds of HT cells expressing STAT3 WT, Y640F or control vector (puro) treated H1152 or DMSO (n = 30). k–l Representative results of western blots and pull down assay for showing the level of Y705-phosphorylated STAT3, STAT3, α-tubulin, active RhoA, and total RhoA in SU-DHL-5 cells under the treatment of different inhibitors for 6 h (k). Quantification of RhoA activity from three independent experiments (l). Data represent mean ± S.D. m Western blots and pull down assay for showing the level of STAT3, α-tubulin, active RhoA, and total RhoA in SU-DHL-5 cells receiving shRNA against STAT3 or a scramble sequence. *P < 0.05, **P < 0.005 by Student’s t-test; Kolmogorov–Smirnov tests for GSEA. See also Supplementary Fig. 3 and Supplementary Movie 3. See Supplementary Table 4 for working concentration of inhibitors
Fig. 3 JAK-STAT3 signaling is the major pathway mediating cell movement in DLBCL. a A schema for showing the mining process for identification of the signaling pathways that regulate amoeboid movement in DLBCL. See Supplementary Table 3 for the information and references for the signal pathways. b A heat map showing the relative cell movement of SU-DHL-5 cells upon the treatment of inhibitors. The velocity of the cells was measured and expressed as fold relative the level control cells. Red, decreased motility level; blue, increased motility level. c A GSEA plot for showing the association between STAT3-regulated signature (Supplementary Data 2) and DLBCL stage I vs. II–IV (GSE11318). d Western blots for showing the efficacy of OCI-Ly3 cells treated with indicated inhibitors. e Quantification of movement speeds of inhibitor treated OCI-Ly3 cells (n = 20). f Western blots for showing the knockdown efficacy of HT-L1 and HT-L2 sublines receiving shRNAs specific to STAT3 (shSTAT3) or scramble (shScr). g Quantification of movement speeds of the cells described in panel f (n = 30). h Western blots for showing the transfection efficacy of HT cells expressing FLAG-STAT3 WT and its mutants. i Quantification of movement speeds of cells described in panel h (n = 20). j Quantification of movement speeds of HT cells expressing STAT3 WT, Y640F or control vector (puro) treated H1152 or DMSO (n = 30). k–l Representative results of western blots and pull down assay for showing the level of Y705-phosphorylated STAT3, STAT3, α-tubulin, active RhoA, and total RhoA in SU-DHL-5 cells under the treatment of different inhibitors for 6 h (k). Quantification of RhoA activity from three independent experiments (l). Data represent mean ± S.D. m Western blots and pull down assay for showing the level of STAT3, α-tubulin, active RhoA, and total RhoA in SU-DHL-5 cells receiving shRNA against STAT3 or a scramble sequence. *P < 0.05, **P < 0.005 by Student’s t-test; Kolmogorov–Smirnov tests for GSEA. See also Supplementary Fig. 3 and Supplementary Movie 3. See Supplementary Table 4 for working concentration of inhibitorsCC BY · PubMed Central
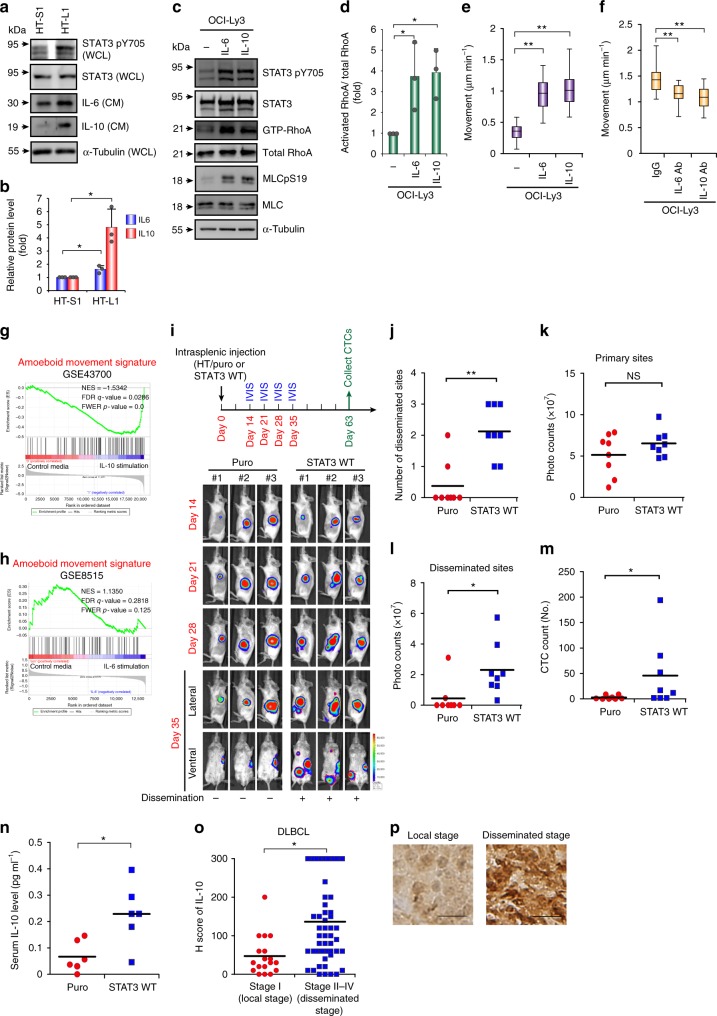
Fig. 4 The IL10-JAK-STAT3 positive feedback loop contributes to DLBCL motility. a, b Representative results of western blots of indicated proteins in whole-cell lysates (WCL), IL-6 and IL-10 in conditioned media (CM) from HT-S1 and HT-L1 sublines. Quantification of IL-6 and IL-10 expression. n = 3. Data represent mean ± S.D. c, d OCI-Ly3 cells were grown in collagen gels and treated with IL-6 or IL-10. Representative western blots and pull down assay for showing the level of indicated proteins. Quantification of RhoA activity. n = 3. Data represent mean ± S.D. e Quantification of movement speeds of OCI-Ly3 cells treated with IL-6 or IL-10 (n = 30). f Quantification of movement speeds of OCI-Ly3 cells treated with IgG, IL-6, or IL-10 neutralizing antibody (n = 30). g GSEA for showing the association between the signature of amoeboid movement and gene expression array from healthy peripheral blood mononuclear cells stimulated with IL-10 or control media (GSE43700). h GSEA for showing the association between the signature of amoeboid movement and gene expression array from monocyte-derived macrophages stimulated with IL-6 or control media (GSE8515). i HT cells expressing WT STAT3 or a control vector (puro) were injected into the spleen of SCID/beige mice. Mice bioluminescent signals on indicated days were detected (n = 8; other 5 mice in Supplementary Fig. 4i). j Quantification of disseminated numbers in i and Supplementary Fig. 4i. k-l Quantification of bioluminescent intensity of i and Supplementary Fig. 4i. from the primary sites (yellow dotted lines circled area) and the disseminated sites (red dotted lines circled area). NS, not significant. m Quantification of the circulating tumor cells (CTCs) collected from the mice described in panel i. n = 8. n HT cells expressing WT STAT3 or a control vector (puro) were intraperitoneal injected into SCID/beige mice for 9 weeks. The dot plot shows the serum concentrations of IL-10. n = 6. o Distribution of the H score for IL-10 expression from 73 DLBCL patients. p Representative results of immunohistochemical staining for IL-10. Scale bar = 20 μm.*, P < 0.05; **, P < 0.005 by Student’s t-test; Kolmogorov–Smirnov tests for GSEA. See also Supplementary Fig. 4
Fig. 4 The IL10-JAK-STAT3 positive feedback loop contributes to DLBCL motility. a, b Representative results of western blots of indicated proteins in whole-cell lysates (WCL), IL-6 and IL-10 in conditioned media (CM) from HT-S1 and HT-L1 sublines. Quantification of IL-6 and IL-10 expression. n = 3. Data represent mean ± S.D. c, d OCI-Ly3 cells were grown in collagen gels and treated with IL-6 or IL-10. Representative western blots and pull down assay for showing the level of indicated proteins. Quantification of RhoA activity. n = 3. Data represent mean ± S.D. e Quantification of movement speeds of OCI-Ly3 cells treated with IL-6 or IL-10 (n = 30). f Quantification of movement speeds of OCI-Ly3 cells treated with IgG, IL-6, or IL-10 neutralizing antibody (n = 30). g GSEA for showing the association between the signature of amoeboid movement and gene expression array from healthy peripheral blood mononuclear cells stimulated with IL-10 or control media (GSE43700). h GSEA for showing the association between the signature of amoeboid movement and gene expression array from monocyte-derived macrophages stimulated with IL-6 or control media (GSE8515). i HT cells expressing WT STAT3 or a control vector (puro) were injected into the spleen of SCID/beige mice. Mice bioluminescent signals on indicated days were detected (n = 8; other 5 mice in Supplementary Fig. 4i). j Quantification of disseminated numbers in i and Supplementary Fig. 4i. k-l Quantification of bioluminescent intensity of i and Supplementary Fig. 4i. from the primary sites (yellow dotted lines circled area) and the disseminated sites (red dotted lines circled area). NS, not significant. m Quantification of the circulating tumor cells (CTCs) collected from the mice described in panel i. n = 8. n HT cells expressing WT STAT3 or a control vector (puro) were intraperitoneal injected into SCID/beige mice for 9 weeks. The dot plot shows the serum concentrations of IL-10. n = 6. o Distribution of the H score for IL-10 expression from 73 DLBCL patients. p Representative results of immunohistochemical staining for IL-10. Scale bar = 20 μm.*, P < 0.05; **, P < 0.005 by Student’s t-test; Kolmogorov–Smirnov tests for GSEA. See also Supplementary Fig. 4CC BY · PubMed Central
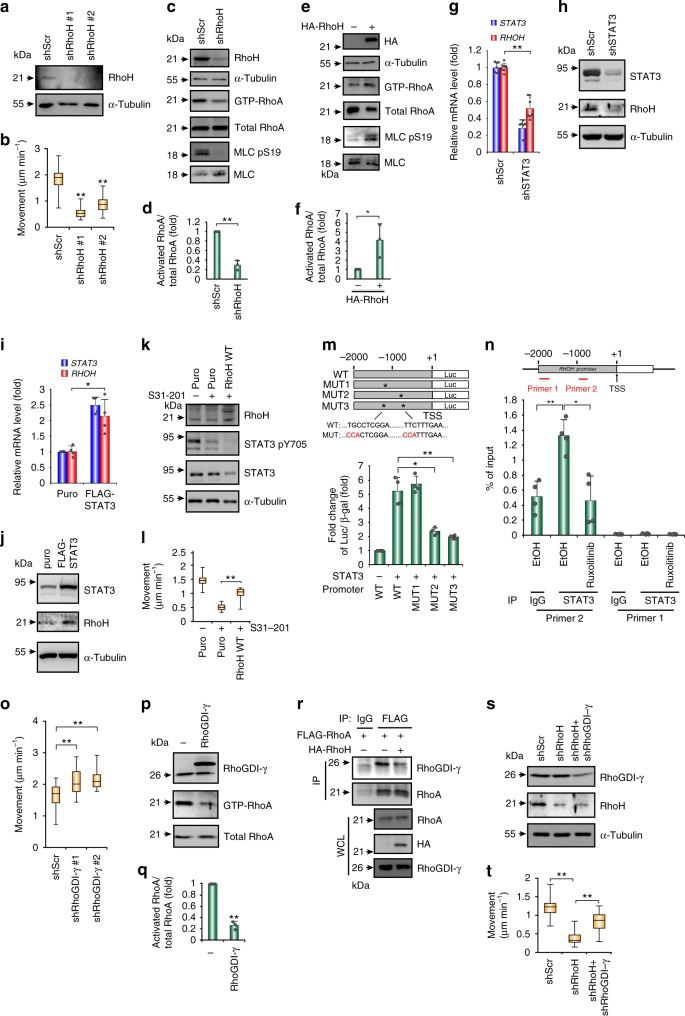
Fig. 5 STAT3 induces RHOH transcription to activate RhoA through competitive interaction with RhoGDIγ. a Western blots of RhoH in SU-DHL-5 cells receiving shRNAs specific to RhoH (shRhoH; clones #1, #2) or a scramble sequence (shScr). b Quantification of movement speeds (n = 30). c, d Western blots for the indicated proteins and pull down assay for GTP-bound RhoA in SU-DHL-5 cells receiving shRhoH or shScr (c). Quantification of RhoA activity (n = 3) (d). e, f Pull down assay showing the GTP-RhoA in HT cells transfected with HA-RhoH or a control vector (e). Quantification of RhoA activity (n = 3) (f). g, h Analysis of the mRNA (g) (n = 7) and protein (h) expression of STAT3 and RhoH in SU-DHL-5 cells receiving shRNAs against STAT3 or a scramble sequence. i, j Analysis of the mRNA (i) (n = 4) and protein (j) expression of STAT3 and RhoH in HT cells stably expressed FLAG-STAT3 WT or control vector. k Western blots for showing the efficacy of inhibitors and the expression level of RhoH in SU-DHL-5 cells expressing HA-RhoH or control vector. l Quantification of the movement speeds (n = 20). m Luciferase reporter assay. The result is presented as luciferase activity/β-galactosidase (β-gal). n = 4. A schema for the promoter region of the RHOH gene and reporter constructs. *mutated sites. n ChIP assay in SU-DHL-5 after ruxolitinib treatment for 24 h. Primer 1, control. Primer 2, amplifying fragment containing STAT3-binding element (−992–−983, TTCTTTGAA). n = 4. o Quantification of movement speeds of SU-DHL-5 cells receiving shRNAs specific to RhoGDIγ (shRhoGDI-γ; clones #1, #2) or shScr. n = 30. p, q Western blots and the pull down assay for GTP-bound RhoA in HA-RhoGDI-γ or control vector transfected HT cells (p). Quantification of RhoA activity (n = 3) (q). r Immunoprecipitation-western blot of HT cells stably expressed FLAG-RhoA transfected with indicated plasmids. s Western blots of RhoGDIγ and RhoH in HT cells receiving shRNAs against RhoH, RhoGDIγ, or a scramble sequence. t Quantification of movement speeds (n = 30). Data represent mean ± S.D. in panels d, f, g, i, m, n, and q. *P < 0.05, **P < 0.005 by Student’s t-test. See also Supplementary Fig. 5 and Supplementary Movie 4
Fig. 5 STAT3 induces RHOH transcription to activate RhoA through competitive interaction with RhoGDIγ. a Western blots of RhoH in SU-DHL-5 cells receiving shRNAs specific to RhoH (shRhoH; clones #1, #2) or a scramble sequence (shScr). b Quantification of movement speeds (n = 30). c, d Western blots for the indicated proteins and pull down assay for GTP-bound RhoA in SU-DHL-5 cells receiving shRhoH or shScr (c). Quantification of RhoA activity (n = 3) (d). e, f Pull down assay showing the GTP-RhoA in HT cells transfected with HA-RhoH or a control vector (e). Quantification of RhoA activity (n = 3) (f). g, h Analysis of the mRNA (g) (n = 7) and protein (h) expression of STAT3 and RhoH in SU-DHL-5 cells receiving shRNAs against STAT3 or a scramble sequence. i, j Analysis of the mRNA (i) (n = 4) and protein (j) expression of STAT3 and RhoH in HT cells stably expressed FLAG-STAT3 WT or control vector. k Western blots for showing the efficacy of inhibitors and the expression level of RhoH in SU-DHL-5 cells expressing HA-RhoH or control vector. l Quantification of the movement speeds (n = 20). m Luciferase reporter assay. The result is presented as luciferase activity/β-galactosidase (β-gal). n = 4. A schema for the promoter region of the RHOH gene and reporter constructs. *mutated sites. n ChIP assay in SU-DHL-5 after ruxolitinib treatment for 24 h. Primer 1, control. Primer 2, amplifying fragment containing STAT3-binding element (−992–−983, TTCTTTGAA). n = 4. o Quantification of movement speeds of SU-DHL-5 cells receiving shRNAs specific to RhoGDIγ (shRhoGDI-γ; clones #1, #2) or shScr. n = 30. p, q Western blots and the pull down assay for GTP-bound RhoA in HA-RhoGDI-γ or control vector transfected HT cells (p). Quantification of RhoA activity (n = 3) (q). r Immunoprecipitation-western blot of HT cells stably expressed FLAG-RhoA transfected with indicated plasmids. s Western blots of RhoGDIγ and RhoH in HT cells receiving shRNAs against RhoH, RhoGDIγ, or a scramble sequence. t Quantification of movement speeds (n = 30). Data represent mean ± S.D. in panels d, f, g, i, m, n, and q. *P < 0.05, **P < 0.005 by Student’s t-test. See also Supplementary Fig. 5 and Supplementary Movie 4CC BY · PubMed Central
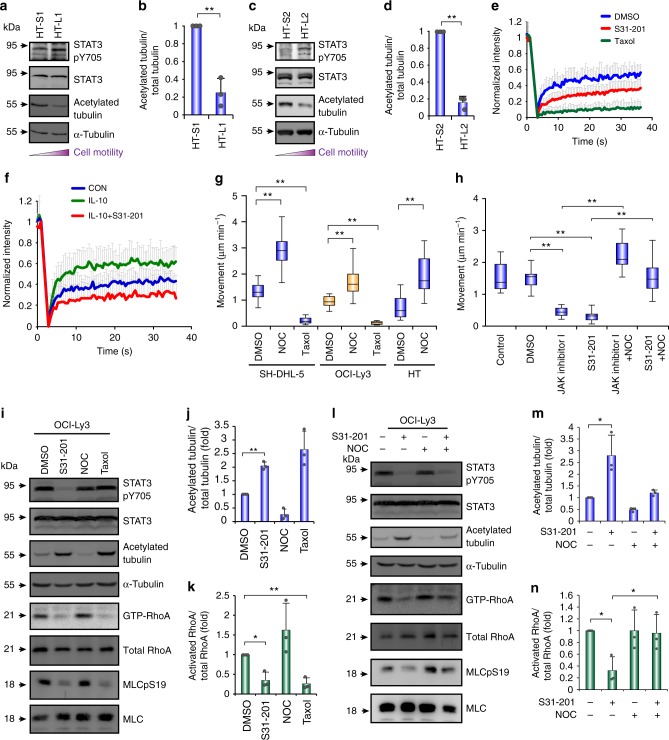
Fig. 6 STAT3 activates RhoA through regulating microtubule dynamics. a, c Western blots for showing the level of Y705-phosphorylated STAT3, total STAT3, and acetylated tubulin in HT-L1 vs. HT-S1 (a) and HT-L2 vs. HT-S2 (c) sublines. b, d Quantification of relative level of acetylated tubulin in a and c, respectively (n = 3). e, f Fluorescence recovery after photobleaching (FRAP) of STAT3 WT-expressed HT cells stably expressing cherry-tubulin. The inhibitors were added 4 h before FRAP (e). FRAP of HT-STAT3 cells, IL-10-treated HT-STAT3 cells, and IL-10-treated HT-STAT3 cells with S31-201 which stably expressed cherry-tubulin. The cells were grown in collagen gels in serum-free medium and then treated with IL-10 (f). Quantification of fluorescence intensity before and after bleaching. The graph illustrates fluorescence recovery curves. (n ≥ 25). g Quantification of movement speeds of SU-DHL-5, OCI-Ly3, or HT cells treated with different inhibitors (n ≥ 20). h Quantification of movement speeds of SU-DHL-5 cells treated with different inhibitors (n = 20). i, l Representative results of western blots and pull down assay for showing the level of Y705-phosphorylated STAT3, acetylated tubulin, and active (GTP-bound) Rho family proteins in OCI-Ly3 cells under the treatment of different inhibitors for 6 h. j, m Quantification of relative level of acetylated tubulin in i and l, respectively (n = 3). k, n Quantification of RhoA activity in i and l, respectively (n = 3). Data represent mean ± S.D. in panels b, d, e, f, j, k, m, and n. *P < 0.05, **P < 0.005 by Student’s t-test. See also Supplementary Fig. 6 and Supplementary Movie 5. See Supplementary Table 4 for the working concentrations of inhibitors
Fig. 6 STAT3 activates RhoA through regulating microtubule dynamics. a, c Western blots for showing the level of Y705-phosphorylated STAT3, total STAT3, and acetylated tubulin in HT-L1 vs. HT-S1 (a) and HT-L2 vs. HT-S2 (c) sublines. b, d Quantification of relative level of acetylated tubulin in a and c, respectively (n = 3). e, f Fluorescence recovery after photobleaching (FRAP) of STAT3 WT-expressed HT cells stably expressing cherry-tubulin. The inhibitors were added 4 h before FRAP (e). FRAP of HT-STAT3 cells, IL-10-treated HT-STAT3 cells, and IL-10-treated HT-STAT3 cells with S31-201 which stably expressed cherry-tubulin. The cells were grown in collagen gels in serum-free medium and then treated with IL-10 (f). Quantification of fluorescence intensity before and after bleaching. The graph illustrates fluorescence recovery curves. (n ≥ 25). g Quantification of movement speeds of SU-DHL-5, OCI-Ly3, or HT cells treated with different inhibitors (n ≥ 20). h Quantification of movement speeds of SU-DHL-5 cells treated with different inhibitors (n = 20). i, l Representative results of western blots and pull down assay for showing the level of Y705-phosphorylated STAT3, acetylated tubulin, and active (GTP-bound) Rho family proteins in OCI-Ly3 cells under the treatment of different inhibitors for 6 h. j, m Quantification of relative level of acetylated tubulin in i and l, respectively (n = 3). k, n Quantification of RhoA activity in i and l, respectively (n = 3). Data represent mean ± S.D. in panels b, d, e, f, j, k, m, and n. *P < 0.05, **P < 0.005 by Student’s t-test. See also Supplementary Fig. 6 and Supplementary Movie 5. See Supplementary Table 4 for the working concentrations of inhibitorsCC BY · PubMed Central
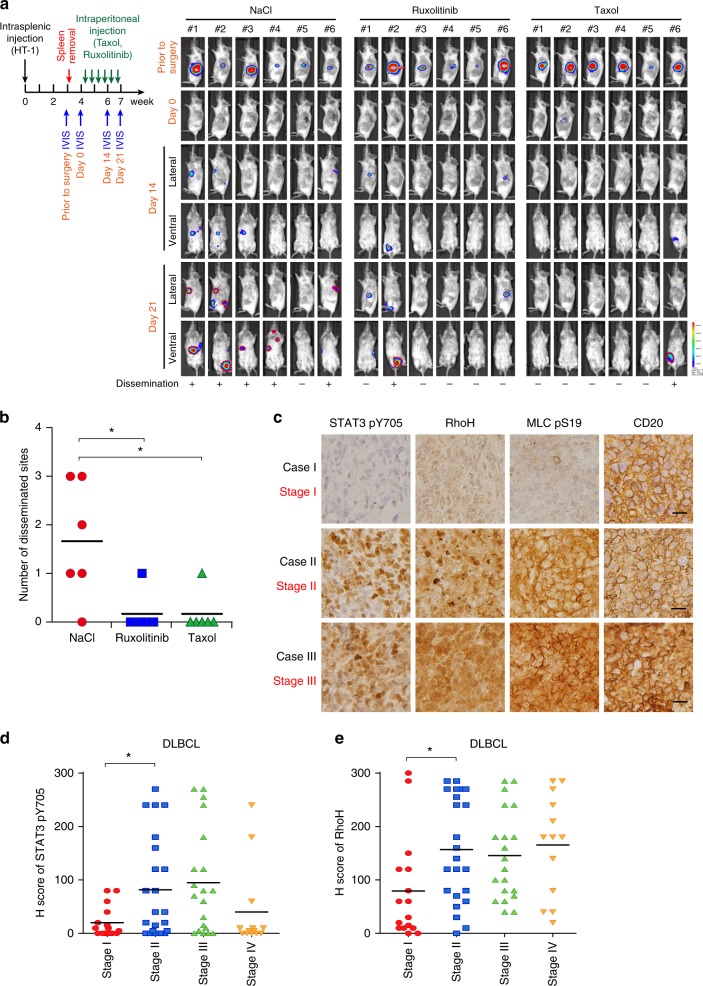
Fig. 7 Validation of the JAK/STAT3-microtubule-RhoA axis in DLBCL in vivo and clinical samples. a A schema for showing the experimental design of the mice experiment. The HT-1 subline was injected into the spleen of SCID/beige mice. Before Taxol or Ruxolitinib injection, the primary tumors were removed. The drugs were injected intraperitoneally on Day 0 and bioluminescent signals were taken at the indicated time points. NaCl, vehicle control. n = 6 for each group. b Quantification of disseminated lesions (red dotted lines) in a. c Representative pictures of immunohistochemical staining of the Y705-phosphorylated STAT3, and S19-phosphorylated MCL, RhoH, and CD20 in DLBCL cases. The clinical stage of the representative cases is indicated. Scale bar = 25 μm. d Distribution of H scores of Y705-phosphorylated STAT3 in DLBCL patients with different stages. e Distribution of H scores of RhoH in DLBCL patients with different stages. *P < 0.05 by Student’s t-test. See also Supplementary Fig. 7
Fig. 7 Validation of the JAK/STAT3-microtubule-RhoA axis in DLBCL in vivo and clinical samples. a A schema for showing the experimental design of the mice experiment. The HT-1 subline was injected into the spleen of SCID/beige mice. Before Taxol or Ruxolitinib injection, the primary tumors were removed. The drugs were injected intraperitoneally on Day 0 and bioluminescent signals were taken at the indicated time points. NaCl, vehicle control. n = 6 for each group. b Quantification of disseminated lesions (red dotted lines) in a. c Representative pictures of immunohistochemical staining of the Y705-phosphorylated STAT3, and S19-phosphorylated MCL, RhoH, and CD20 in DLBCL cases. The clinical stage of the representative cases is indicated. Scale bar = 25 μm. d Distribution of H scores of Y705-phosphorylated STAT3 in DLBCL patients with different stages. e Distribution of H scores of RhoH in DLBCL patients with different stages. *P < 0.05 by Student’s t-test. See also Supplementary Fig. 7CC BY · PubMed Central
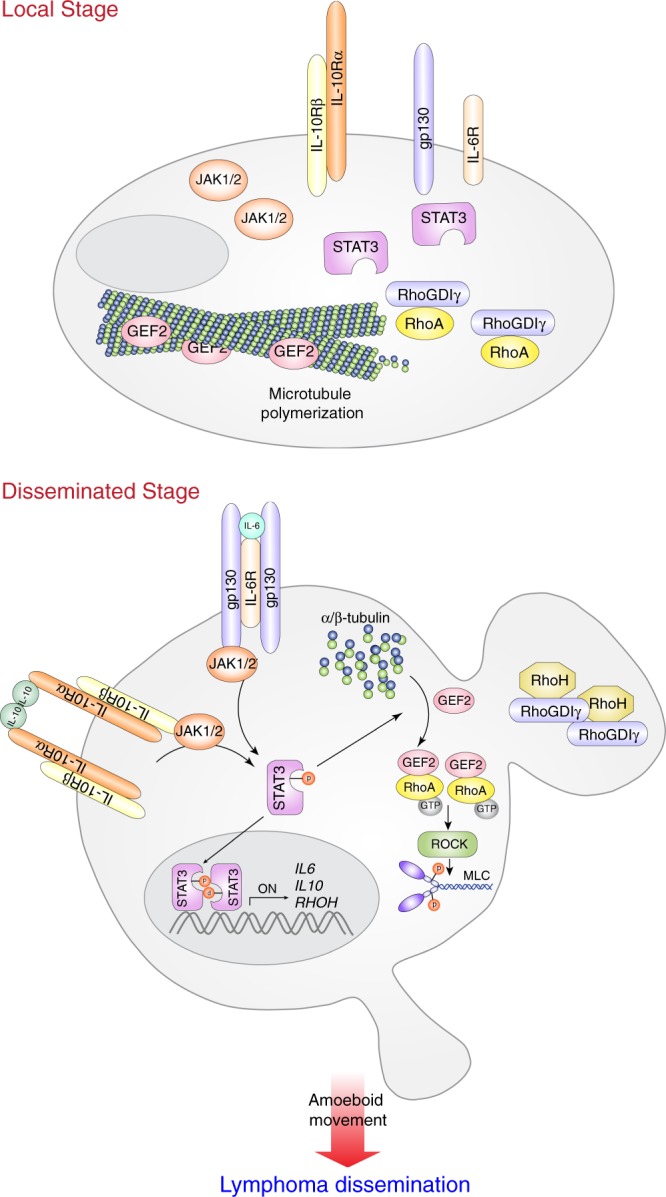
Fig. 8 A schema for showing the molecular mechanism guiding cell movement in disseminated stage DLBCL
Fig. 8 A schema for showing the molecular mechanism guiding cell movement in disseminated stage DLBCLCC BY · PubMed Central

Verification

Claims the paper makes

The claims and statistics of this paper haven’t been checked yet.

Run the check — free, no account needed. It reads the open-access text and checks the sources it cites.

A few free checks a day · papers already verified open instantly · results are public

Claims other papers make about this one

Each is checked against this paper’s own text: does it say what the citing paper says it does?

Self-check

Percentages, sums and reported differences re-computed from the paper’s own numbers.

The self-check needs the paper’s full text.

Citations

Cites

Research works printed but not linked: 51

  1. Hunt, K. E. & Reichard, K. K. Diffuse large B-cell lymphoma. Arch. Pathol. Lab. Med. 132, 118–124 (2008). · DOI
  2. Friedl, P. Prespecification and plasticity: shifting mechanisms of cell migration. Curr. Opin. Cell Biol. 16, 14–23 (2004). · DOI
  3. Roschewski, M., Staudt, L. M. & Wilson, W. H. Diffuse large B-cell lymphoma-treatment approaches in the molecular era. Nat. Rev. Clin. Oncol. 11, 12–23 (2014). · DOI
  4. Ladanyi, M., Offit, K., Jhanwar, S. C., Filippa, D. A. & Chaganti, R. S. MYC rearrangement and translocations involving band 8q24 in diffuse large cell lymphomas. Blood 77, 1057–1063 (1991). · DOI
  5. Monni, O. et al. BCL2 overexpression associated with chromosomal amplification in diffuse large B-cell lymphoma. Blood 90, 1168–1174 (1997). · DOI
  6. Ye, B. H. et al. Chromosomal translocations cause deregulated BCL6 expression by promoter substitution in B cell lymphoma. EMBO J. 14, 6209–6217 (1995). · DOI
  7. Calado, D. P. et al. Constitutive canonical NF-kappaB activation cooperates with disruption of BLIMP1 in the pathogenesis of activated B cell-like diffuse large cell lymphoma. Cancer Cell. 18, 580–589 (2010). · DOI
  8. Huang, X. et al. Activation of the STAT3 signaling pathway is associated with poor survival in diffuse large B-cell lymphoma treated with R-CHOP. J. Clin. Oncol. 31, 4520–4528 (2013). · DOI
  9. Lam, L. T. et al. Cooperative signaling through the signal transducer and activator of transcription 3 and nuclear factor-{kappa}B pathways in subtypes of diffuse large B-cell lymphoma. Blood 111, 3701–3713 (2008). · DOI
  10. Nacinovic-Duletic, A., Stifter, S., Dvornik, S., Skunca, Z. & Jonjic, N. Correlation of serum IL-6, IL-8 and IL-10 levels with clinicopathological features and prognosis in patients with diffuse large B-cell lymphoma. Int. J. Lab. Hematol. 30, 230–239 (2008). · DOI
  11. Friedl, P., Borgmann, S. & Brocker, E. B. Amoeboid leukocyte crawling through extracellular matrix: lessons from the Dictyostelium paradigm of cell movement. J. Leukoc. Biol. 70, 491–509 (2001). · DOI
  12. Croft, D. R. & Olson, M. F. Regulating the conversion between rounded and elongated modes of cancer cell movement. Cancer Cell. 14, 349–351 (2008). · DOI
  13. Sahai, E. & Marshall, C. J. Differing modes of tumour cell invasion have distinct requirements for Rho/ROCK signalling and extracellular proteolysis. Nat. Cell Biol. 5, 711–719 (2003). · DOI
  14. Wyckoff, J. B., Pinner, S. E., Gschmeissner, S., Condeelis, J. S. & Sahai, E. ROCK- and myosin-dependent matrix deformation enables protease-independent tumor-cell invasion in vivo. Curr. Biol. 16, 1515–1523 (2006). · DOI
  15. Wolf, K., Muller, R., Borgmann, S., Brocker, E. B. & Friedl, P. Amoeboid shape change and contact guidance: T-lymphocyte crawling through fibrillar collagen is independent of matrix remodeling by MMPs and other proteases. Blood 102, 3262–3269 (2003). · DOI
  16. Friedl, P. & Alexander, S. Cancer invasion and the microenvironment: plasticity and reciprocity. Cell 147, 992–1009 (2011). · DOI · Paper page
  17. Eitaki, M., Yamamori, T., Meike, S., Yasui, H. & Inanami, O. Vincristine enhances amoeboid-like motility via GEF-H1/RhoA/ROCK/Myosin light chain signaling in MKN45 cells. BMC Cancer 12, 469 (2012). · DOI
  18. Yang, W. H. et al. RAC1 activation mediates Twist1-induced cancer cell migration. Nat. Cell Biol. 14, 366–374 (2012). · DOI
  19. Sanz-Moreno, V. et al. ROCK and JAK1 signaling cooperate to control actomyosin contractility in tumor cells and stroma. Cancer Cell. 20, 229–245 (2011). · DOI · Paper page
  20. Pilati, C. et al. Somatic mutations activating STAT3 in human inflammatory hepatocellular adenomas. J. Exp. Med. 208, 1359–1366 (2011). · DOI
  21. Horvath, C. M., Wen, Z. & Darnell, J. E. Jr. A STAT protein domain that determines DNA sequence recognition suggests a novel DNA-binding domain. Genes Dev. 9, 984–994 (1995). · DOI
  22. Leslie, K. et al. Cyclin D1 is transcriptionally regulated by and required for transformation by activated signal transducer and activator of transcription 3. Cancer Res. 66, 2544–2552 (2006). · DOI · Paper page
  23. Tybulewicz, V. L. & Henderson, R. B. Rho family GTPases and their regulators in lymphocytes. Nat. Rev. Immunol. 9, 630–644 (2009). · DOI · Paper page
  24. Ng, D. C. et al. Stat3 regulates microtubules by antagonizing the depolymerization activity of stathmin. J. Cell. Biol. 172, 245–257 (2006). · DOI
  25. Verma, N. K. et al. STAT3-stathmin interactions control microtubule dynamics in migrating T-cells. J. Biol. Chem. 284, 12349–12362 (2009). · DOI
  26. Sehn, L. H. et al. The revised International Prognostic Index (R-IPI) is a better predictor of outcome than the standard IPI for patients with diffuse large B-cell lymphoma treated with R-CHOP. Blood 109, 1857–1861 (2007). · DOI · Paper page
  27. Ding, B. B. et al. Constitutively activated STAT3 promotes cell proliferation and survival in the activated B-cell subtype of diffuse large B-cell lymphomas. Blood 111, 1515–1523 (2008). · DOI
  28. Davis, R. E., Brown, K. D., Siebenlist, U. & Staudt, L. M. Constitutive nuclear factor kappaB activity is required for survival of activated B cell-like diffuse large B cell lymphoma cells. J. Exp. Med. 194, 1861–1874 (2001). · DOI
  29. Giachelia, M. et al. Interleukin-6 plasma levels are modulated by a polymorphism in the NF-kappaB1 gene and are associated with outcome following rituximab-combined chemotherapy in diffuse large B-cell non-Hodgkin lymphoma. Leuk. Lymphoma 53, 411–416 (2012). · DOI
  30. Yoo, H. Y. et al. A recurrent inactivating mutation in RHOA GTPase in angioimmunoblastic T cell lymphoma. Nat. Genet. 46, 371–375 (2014). · DOI
  31. Muppidi, J. R. et al. Loss of signalling via Galpha13 in germinal centre B-cell-derived lymphoma. Nature 516, 254–258 (2014). · DOI
  32. Healy, J. A. et al. GNA13 loss in germinal center B cells leads to impaired apoptosis and promotes lymphoma in vivo. Blood 127, 2723–2731 (2016). · DOI
  33. Béguelin, W. et al. EZH2 is required for germinal center formation and somatic EZH2 mutations promote lymphoid transformation. Cancer Cell. 23, 677–692 (2013). · DOI
  34. Zhang, J. et al. Disruption of KMT2D perturbs germinal center B cell development and promotes lymphomagenesis. Nat. Med. 21, 1190–1198 (2015). · DOI
  35. Pasqualucci, L. et al. Inactivating mutations of acetyltransferase genes in B-cell lymphoma. Nature 471, 189–195 (2011). · DOI
  36. Sehn, L. H. & Gascoyne, R. D. Diffuse large B-cell lymphoma: optimizing outcome in the context of clinical and biologic heterogeneity. Blood 125, 22–32 (2015). · DOI
  37. Harrison, C. et al. JAK inhibition with ruxolitinib versus best available therapy for myelofibrosis. N. Engl. J. Med. 366, 787–798 (2012). · DOI · Paper page
  38. Westin, J. R. et al. Paclitaxel, topotecan and rituximab: long term outcomes of an effective salvage programme for relapsed or refractory aggressive B-cell non-Hodgkin lymphoma. Br. J. Haematol. 167, 177–184 (2014). · DOI
  39. Bobee, V. et al. Determination of molecular subtypes of diffuse large B-cell lymphoma using a reverse transcriptase multiplex ligation-dependent probe amplification classifier: a CALYM study. J. Mol. Diagn. 19, 892–904 (2017). · DOI
  40. Dekker, J. D. et al. Subtype-specific addiction of the activated B-cell subset of diffuse large B-cell lymphoma to FOXP1. Proc. Natl Acad. Sci. USA 113, E577–E586 (2016). · DOI
  41. Mareschal, S. et al. Accurate classification of germinal center B-cell-like/activated B-cell-like diffuse large B-cell lymphoma using a simple and rapid reverse transcriptase-multiplex ligation-dependent probe amplification assay: a CALYM study. J. Mol. Diagn. 17, 273–283 (2015). · DOI
  42. Chang, K. C. et al. Ran GTPase-activating protein 1 is a therapeutic target in diffuse large B-cell lymphoma. PLoS ONE 8, e79863 (2013). · DOI
  43. Lenz, G. et al. Molecular subtypes of diffuse large B-cell lymphoma arise by distinct genetic pathways. Proc. Natl Acad. Sci. USA 105, 13520–13525 (2008). · DOI
  44. Teles, R. M. et al. Type I interferon suppresses type II interferon-triggered human anti-mycobacterial responses. Science 339, 1448–1453 (2013). · DOI
  45. Jura, J. et al. Identification of interleukin-1 and interleukin-6-responsive genes in human monocyte-derived macrophages using microarrays. Biochim. Biophys. Acta 1779, 383–389 (2008). · DOI
  46. Belgiovine, C. et al. Reduced expression of the ROCK inhibitor Rnd3 is associated with increased invasiveness and metastatic potential in mesenchymal tumor cells. PLoS ONE 5, e14154 (2010). · DOI
  47. Sarrio, D. et al. Functional characterization of E- and P-cadherin in invasive breast cancer cells. BMC Cancer 9, 74 (2009). · DOI
  48. Rozanov, D. V. et al. Molecular signature of MT1-MMP: transactivation of the downstream universal gene network in cancer. Cancer Res. 68, 4086–4096 (2008). · DOI
  49. Xu, Y., Ikegami, M., Wang, Y., Matsuzaki, Y. & Whitsett, J. A. Gene expression and biological processes influenced by deletion of Stat3 in pulmonary type II epithelial cells. BMC Genom. 8, 455 (2007). · DOI
  50. Dauer, D. J. et al. Stat3 regulates genes common to both wound healing and cancer. Oncogene 24, 3397–3408 (2005). · DOI
  51. Clarkson, R. W. et al. The genes induced by signal transducer and activators of transcription (STAT)3 and STAT5 in mammary epithelial cells define the roles of these STATs in mammary development. Mol. Endocrinol. 20, 675–685 (2006). · DOI

Cited by

See all 47

Metadata

Authors
Pan, Y.-R., Chen, C.-C., Chan, Y.-T., Wang, H.-J., Chien, F.-T., Chen, Y.-L., Liu, J.-L., & Yang, M.-H.
Venue
Nature Communications
Published
2018-09-12
Volume
9
Issue
1
ISSN
2041-1723
Cited by
47
References
3
Language
en
Funders
  • Ministry of Science and Technology, Taiwan (104-2321-B-010-005, 104-0210-01-09-02, 107-0210-01-19-01)
  • National Health Research Institutes (NHRI-EX107-10622BI)
  • Ministry of Health and Welfare (MOHW107-TDU-B-211-114019)

About these checks

Registry, retraction, Cites and statistics results are computed, not judged, with one exception: a printed reference that no index lists is read once by a model before it counts as a citation error. Claims are extracted by a model and kept only when their quote appears verbatim in the text; each cited source is then checked, with a model’s help, for whether it says what the claim relies on. Those verdicts can be wrong — read the claim’s quote and the cited source before relying on one.

Statistics and arithmetic are recomputed, not judged.

Confidence bands are shown only for fields calibrated on our annotated test set. None is calibrated yet, so no band is shown.

What counts as a claim ›How we measure confidence ›How we check this ›

Are you an author, or do you see a problem with this page? Request a review