

The DOI matches its Crossref record; 53 of the 53 references it cites were found in a registry or an index.
Morphology and surface chemistry engineering toward pH-universal catalysts for hydrogen evolution at high current density
Open accessAbstract
Large-scale implementation of electrochemical hydrogen production requires several fundamental issues to be solved, including understanding the mechanism and developing inexpensive electrocatalysts that work well at high current densities. Here we address these challenges by exploring the roles of morphology and surface chemistry, and develop inexpensive and efficient electrocatalysts for hydrogen evolution. Three model electrocatalysts are flat platinum foil, molybdenum disulfide microspheres, and molybdenum disulfide microspheres modified by molybdenum carbide nanoparticles. The last catalyst is highly active for hydrogen evolution independent of pH, with low overpotentials of 227 mV in acidic medium and 220 mV in alkaline medium at a high current density of 1000 mA cm−2, because of enhanced transfer of mass (reactants and hydrogen bubbles) and fast reaction kinetics due to surface oxygen groups formed on molybdenum carbide during hydrogen evolution. Our work may guide rational design of electrocatalysts that work well at high current densities.
Overview
The claims and statistics of this paper haven’t been checked yet.
Run the check — free, no account needed. It reads the open-access text and checks the sources it cites.
Integrity signals
Registry
Cites
Statistics
Figures
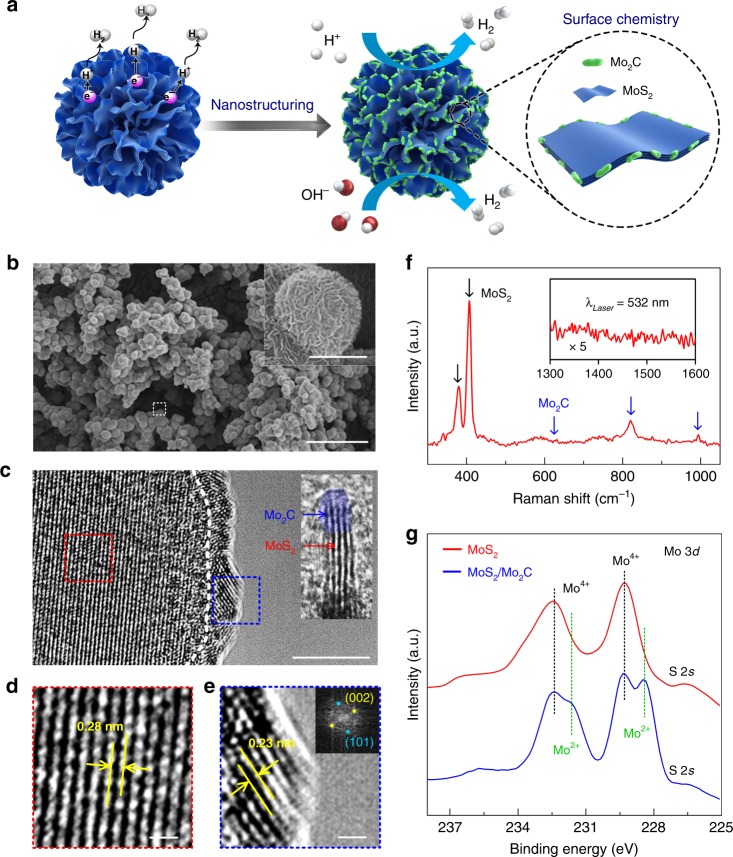
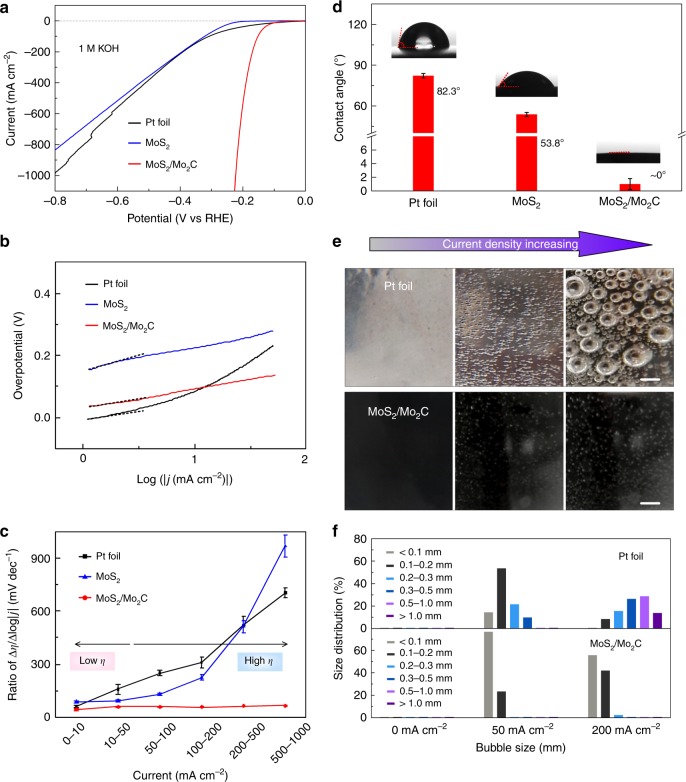
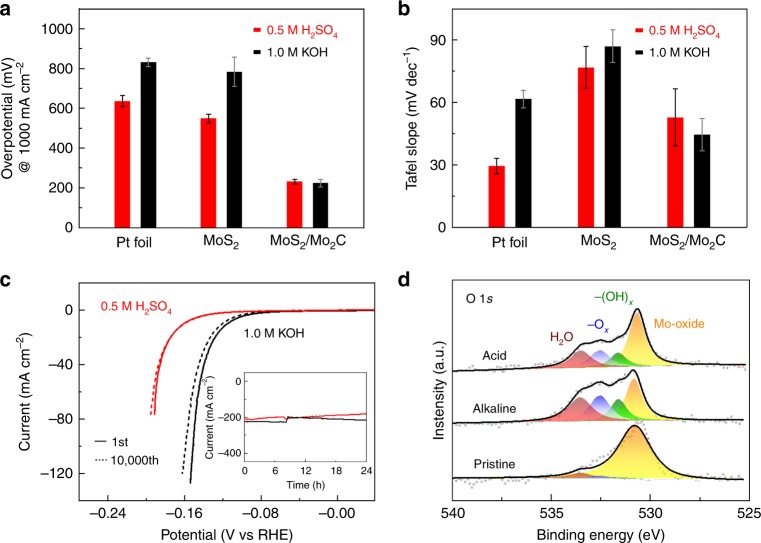
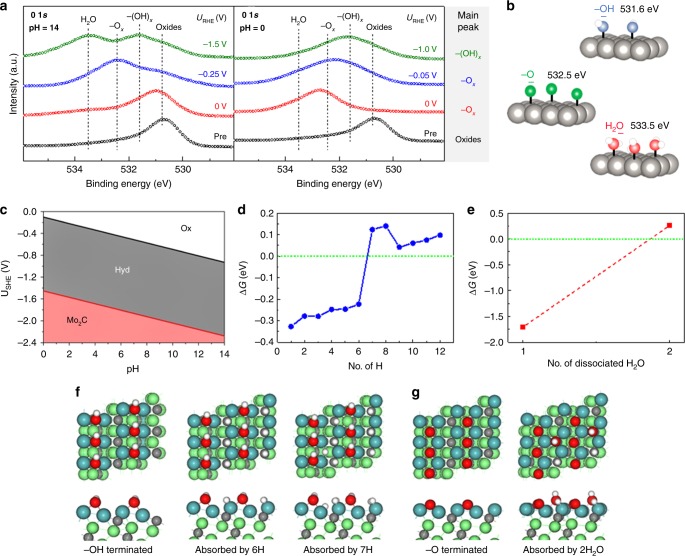
Verification
Claims the paper makes
The claims and statistics of this paper haven’t been checked yet.
Run the check — free, no account needed. It reads the open-access text and checks the sources it cites.
Claims other papers make about this one
Each is checked against this paper’s own text: does it say what the citing paper says it does?
The source backs part of the claim, not all of it — or backs it for a different population, condition or comparison.
In the citing paper
“However, both”
From Phosphorus doped nickel-molybdenum aerogel for efficient overall water splitting (2021) · cites this paper as [4]
Experimental — accuracy not yet measured
Self-check
Percentages, sums and reported differences re-computed from the paper’s own numbers.
The self-check needs the paper’s full text.
Citations
Cites
Generalized Gradient Approximation Made Simple
Perdew, J. P., Burke, K., & Ernzerhof, M. (1996) · Physical Review Letters · doi:10.1103/physrevlett.77.3865 · Cited by 215,824
Efficient iterative schemes for ab initio total-energy calculations using a plane-wave basis set
Kresse, G., & Furthmüller, J. (1996) · Physical Review B · doi:10.1103/physrevb.54.11169 · Cited by 123,652
Projector augmented-wave method
Blöchl, P. E. (1994) · Physical Review B · doi:10.1103/physrevb.50.17953 · Cited by 92,732
From ultrasoft pseudopotentials to the projector augmented-wave method
Kresse, G., & Joubert, D. (1999) · Physical Review B · doi:10.1103/physrevb.59.1758 · Cited by 85,307
Kresse, G., & Furthmüller, J. (1996) · Computational Materials Science · doi:10.1016/0927-0256(96)00008-0 · Cited by 76,871
Origin of the Overpotential for Oxygen Reduction at a Fuel-Cell Cathode
Nørskov, J. K., Rossmeisl, J., Logadottir, A., Lindqvist, L., Kitchin, J. R., Bligaard, T., & Jónsson, H. (2004) · The Journal of Physical Chemistry B · doi:10.1021/jp047349j · Cited by 13,153
Combining theory and experiment in electrocatalysis: Insights into materials design
Seh, Z. W., Kibsgaard, J., Dickens, C. F., Chorkendorff, I., Nørskov, J. K., & Jaramillo, T. F. (2017) · Science · doi:10.1126/science.aad4998 · Cited by 12,114
Biomimetic Hydrogen Evolution: MoS 2 Nanoparticles as Catalyst for Hydrogen Evolution
Hinnemann, B., Moses, P. G., Bonde, J., Jørgensen, K. P., Nielsen, J. H., Horch, S., Chorkendorff, I., & Nørskov, J. K. (2005) · Journal of the American Chemical Society · doi:10.1021/ja0504690 · Cited by 4,065
Liquid Exfoliation of Layered Materials
Nicolosi, V., Chhowalla, M., Kanatzidis, M. G., Strano, M. S., & Coleman, J. N. (2013) · Science · doi:10.1126/science.1226419 · Cited by 3,817
Shinagawa, T., Garcia-Esparza, A. T., & Takanabe, K. (2015) · Scientific Reports · doi:10.1038/srep13801 · Cited by 3,287
Cited by
Sorted by citations
Items 501–595 of 595
Zhang, R., Yang, Y., Zhou, F., Xiong, B., Yao, Z., Xue, W., Sun, D., Yang, Z., & Lei, Z. (2025) · Molecular Catalysis · doi:10.1016/j.mcat.2025.115234 · Cited by 3
Ma, H., Zhou, J., Zhao, Y., Wang, S., Hu, Z., Ma, J., & Cheng, H. (2024) · Small · doi:10.1002/smll.202406353 · Cited by 5
Self-citationWu, Z., Niu, F., Chen, D., Huang, Y., Liu, G., Zhou, Y., Tu, W., Zhu, X., & Zou, Z.-G. (2024) · Science China Materials · doi:10.1007/s40843-024-3141-4 · Cited by 5
“For instance, to ensure the practical use of the water-splitting technology in the industry, the optimization of 2D nanomaterials by different phase engineering strategies should meet the requirements for large current density reactions [169–171].”
Wang, D.-P., Huang, J., Wei, Y., Qi, Y.-R., Wang, Y., Liu, Q., Cao, L.-Y., Kajiyoshi, K., Zhao, Y., Liu, Y.-J., et al. (2024) · ACS Applied Energy Materials · doi:10.1021/acsaem.4c01694 · Cited by 5
Shabana, N., Muhsin, P., Yang, Y., & Chou, P. (2024) · Small Methods · doi:10.1002/smtd.202400572 · Cited by 7
Zhai, Z., Zhang, C., Chen, B., Liu, L., Song, H., Bing, Y., Zheng, Z., Li, J., Jiang, X., & Huang, N. (2024) · Nanomaterials · doi:10.3390/nano14030243 · Cited by 6
“The Mo 3d spectrum reveals four deconvoluted doublets: peaks at 228.30 and 231.48 eV corresponding to the Mo-C bonds, peaks at 228.80 and 231.89 eV to the Mo-N bonds, peaks at 229.20 and 232.45 eV to the Mo 4+ species, and peaks at 232.65 and 235.56 eV to the Mo 6+ species [37,50–53].”
BackgroundResultInfluentialXiao, Z., Huang, H.-L., Hu, S.-X., Weng, Z., Huang, Y., Du, B., Zeng, X., Meng, Y.-Y., & Huang, C. (2023) · Small Methods · doi:10.1002/smtd.202300793 · Cited by 5
Hybrid TiNb oxides/nitrides nanotube arrays as active catalyst supports
Zhang, H.-B., Gao, Y., Zhang, L., Chen, X.-H., Cao, H., & Zheng, G. (2022) · Journal of Alloys and Compounds · doi:10.1016/j.jallcom.2022.165267 · Cited by 5
Lv, L.-L., Cai, M., Jiang, Y., Wang, Q., Wang, A., Chen, J.-S., Wei, Y.-X., Cheng, Q., & Sun, S. (2022) · Langmuir · doi:10.1021/acs.langmuir.1c03428 · Cited by 5
Giuffredi, G., & Fonzo, F. D. (2020) · Current Opinion in Electrochemistry · doi:10.1016/j.coelec.2020.09.006 · Cited by 7
Wang, X., Li, M., Zhang, N., Ma, G., Jiang, R., Zhang, N., & Fang, C. (2025) · Applied Catalysis B: Environmental · doi:10.1016/j.apcatb.2025.126074 · Cited by 2
Active Phase of Nickel Electrocatalysts Driving Alkaline Hydrogen Evolution
Wang, Y., Ender, E., Kumar, S., Tseng, C., Yang, G., Ye, B., Liang, C., Yu, Y., West, N. G., Chauhan, I., et al. (2026) · Advanced Materials · doi:10.1002/adma.74591 · Cited by 2
“…minutes of pre-conditioning, testing the protocol at industry-relevant conditions, using devices with real-life catalysts such as Ni and its alloys [ 27, 68–70 ], or possibly other emerging materials such as MOF [ 64 ] or molybdenum-based catalysts [ 5, 68, 71 ] would be an important future study.”
Kale, V. N., Zhang, X.-P., Naqvi, S. A. Z., Jiang, Z., Wang, Y., & Maiyalagan, T. (2026) · Materials Today Chemistry · doi:10.1016/j.mtchem.2026.103386 · Cited by 2
Xiao, T., Sultana, F., Liu, X., Duan, Y., Li, R.-K., Sun, K.-X., Li, T.-T., & Li, R.-H. (2026) · Journal of Alloys and Compounds · doi:10.1016/j.jallcom.2026.186980 · Cited by 4
Wang, R., Wen, H., Chen, M., Chen, Z., & Wang, P. (2026) · Journal of Material Science and Technology · doi:10.1016/j.jmst.2026.01.057 · Cited by 5
Liu, L., Wang, Y., Yuan, Z., Guo, S., Hu, J., & Xu, X. (2025) · Chemical Engineering Journal · doi:10.1016/j.cej.2025.171581 · Cited by 4
Engineering Bent MoS 2 Nanosheets Promotes Stable Electrocatalytic Hydrogen Evolution at 1.0 A cm –2
Yang, X., Liu, Z., Guo, C., Li, X.-Y., Deng, Z., Ye, C., Lyu, J.-M., Shen, Y., Li, Y., Huang, Y., et al. (2025) · ACS Catalysis · doi:10.1021/acscatal.5c05736 · Cited by 5
A perspective on mechanism of high-current–density electrocatalytic CO2 reduction
Chen, Y., Hu, S., Kang, X., & Liu, B.-L. (2025) · MRS Energy & Sustainability · doi:10.1557/s43581-025-00127-4 · Cited by 4
Self-citationYoon, Y., Lim, S., & Lim, T. (2024) · International Journal of Hydrogen Energy · doi:10.1016/j.ijhydene.2024.01.224 · Cited by 7
Bora, D. K., Bavdane, P. P., Bhatt, B., Nikumbe, D. Y., Sethia, G., & Nagarale, R. K. (2024) · Journal of Electroanalytical Chemistry · doi:10.1016/j.jelechem.2024.118027 · Cited by 8
Pine needle-like FeCo@C grown in situ on nickel foam to enhance the oxygen evolution reaction
Tao, Y., Wu, J., Peng, C., Qiao, S., Song, Y., Peng, L., Chen, J., Zhang, H. F., Wang, Z., & Lin, J. H. (2023) · International Journal of Hydrogen Energy · doi:10.1016/j.ijhydene.2023.05.288 · Cited by 10
Wang, T., Hong, Z., Sun, F., Wang, B., Jian, C., & Liu, W. (2022) · RSC Advances · doi:10.1039/d2ra04685g · Cited by 10
CuNi bimetallic nanocatalyst enables sustainable direct carboxylation reactions
Choudhary, N., Abdelgaid, M., Mpourmpakis, G., & Mobin, S. M. (2022) · Molecular Catalysis · doi:10.1016/j.mcat.2022.112620 · Cited by 9
Ethanol adsorption on Ni doped Mo2C(001): a theoretical study
Jiménez, M. J., Lissarrague, M. H. S., Bechthold, P., GONZALEZ, E. A., Jasen, P., & Juan, A. (2022) · Topics in Catalysis · doi:10.1007/s11244-022-01596-4 · Cited by 5
Zhang, N., Gao, Y., Wang, C.-R., Zhao, F., Duan, Z., Liu, J., & Yu, Y.-M. (2020) · Chemical Communications · doi:10.1039/d0cc04781c · Cited by 4
Shi, F., Qin, J., Wu, J., Liu, N., Xiao, L., Zhou, Z., Li, Y., Cheng, C., Wang, H., Mao, J., et al. (2026) · Advanced Functional Materials · doi:10.1002/adfm.75755 · Cited by 2
“Thus, the development of highly active HER electrocatalysts capable of operating at high current densities ( ≥ 500 mA cm − 2 ) is essential for reducing overpotentials and ensuring long-term catalytic stability in industrial water electrolysis [7, 8].”
Zhang, Y., Song, G., Cheng, Y., Luo, Y., & Hu, C. (2026) · Water Research · doi:10.1016/j.watres.2026.125858 · Cited by 3
Self-citationMorphology engineering of NiCo2O4 enables high-efficiency electrochemical sensing of nitrite in food
Feng, X., Yue, L., Kang, H., Li, H.-M., Li, J.-S., Deng, J., Guan, H.-J., & Li, L.-M. (2026) · Microchemical journal (Print) · doi:10.1016/j.microc.2026.118102 · Cited by 3
Bionic stacked 3D engineered functional electrodes for ultra-high efficient hydrogen production
Wang, Z., Wang, X., Xie, M., Shuai, Y., & Ge, Q. (2026) · International Journal of Extreme Manufacturing · doi:10.1088/2631-7990/ae3cd4 · Cited by 2
Yu, E., Zhong, Y., Jiang, H., Wu, J., Chen, L., Wang, T., Wang, H.-N., Wen, J.-L., Hu, M.-Y., Liu, Q.-Z., et al. (2026) · Journal of Electroanalytical Chemistry · doi:10.1016/j.jelechem.2026.120032 · Cited by 3
Zhao, J., Chen, R., Liao, N., & Luo, J. (2026) · Nano Letters · doi:10.1021/acs.nanolett.5c06024 · Cited by 5
Zhang, P., Liu, G.-H., Wen, Y., Kang, Y.-H., Yin, Y.-F., Li, S., Li, Z.-X., & Ma, Z.-H. (2026) · Journal of the Energy Institute · doi:10.1016/j.joei.2025.102381 · Cited by 3
Liu, S., Wang, L., Jang, H., Wang, B., Cho, J., Li, Z., Lin, W., Hou, L., & Liu, X. (2026) · Science China Chemistry · doi:10.1007/s11426-025-3085-x · Cited by 3
Ng, W. S., Azhar, N., Rosman, N. N., Masdar, M. S., Majlan, E. H., Shamsul, N. S., Kassim, Z., Aizamddin, M. F., & Yunus, R. M. (2025) · International Journal of Hydrogen Energy · doi:10.1016/j.ijhydene.2025.152883 · Cited by 3
Dang, J.-Y., Wang, Y., Jin, R.-F., Xie, D., Sajid, M., Xu, W., Zhang, X., Li, W., & Zhang, J.-P. (2025) · Journal of Colloid and Interface Science · doi:10.1016/j.jcis.2025.139557 · Cited by 3
Khamene, S. H., van Dalen, N., Tsampas, M. N., & Creatore, M. (2025) · The Journal of Physical Chemistry C · doi:10.1021/acs.jpcc.5c05263 · Cited by 4
A family of homologous metal heteromaterials with chemically bonded metallic interface
Liu, H., Yu, Q., Liu, J., Huang, C., Chen, Y., Zhang, T., Khan, J., Dong, Y., Kang, X., Liu, L., et al. (2025) · National Science Review · doi:10.1093/nsr/nwaf311 · Cited by 6
Self-citationLiu, L., Zhou, C., Zhu, M., Cui, J., Du, W., & Xu, X. (2025) · Journal of Power Sources · doi:10.1016/j.jpowsour.2025.237145 · Cited by 4
Bui, T. H., Nguyen, T. A. N., Bui, V. K. H., Nguyen, H. D., Tran, V. V., & Huu, H. (2025) · International Journal of Hydrogen Energy · doi:10.1016/j.ijhydene.2025.150049 · Cited by 3
Edge Engineering in MoS 2 by Chemically Induced Nano‐Folding
Chini, E., Esposito, F., Benekou, V., Muhyuddin, M., Lunedei, E., Ruani, G., Rizzoli, R., Calabrese, G., Liscio, F., Corticelli, F., et al. (2025) · Small Structures · doi:10.1002/sstr.202500046 · Cited by 4
Lin, Y., Wang, J., Cao, D., & Gong, Y. (2021) · Frontiers of Chemical Science and Engineering · doi:10.1007/s11705-020-2014-x · Cited by 3
Yin, M., Jia, X., Sun, Y., Zhan, Z., Zhao, T. S., & Jiang, H. (2025) · Journal of Materials Chemistry A · doi:10.1039/d5ta03666f · Cited by 3
Cao, X., Le, F., Yang, X., Wei, L., Yang, L., Jia, W., & Jia, D. (2026) · Advanced Functional Materials · doi:10.1002/adfm.77054 · Cited by 2
“…S20e, the Tafel slopes of Ru/(CeNd)O x /NC, Ru/(CeNdSm)O x /NC, and Ru/(CeNdSmGd)O x /NC are 50.2, 47.9, and 45.2 mV dec − 1 , respectively, indicating that the synergistic effect of multiple elements within the CeO 2 lattice enhances the HER kinetics and favors the Volmer − Tafel pathway [60].”
InfluentialLin, L., Fu, Q., Yao, T., Ma, S., Xu, Y., Wang, K., Wang, W., Wang, X., & Xu, P. (2026) · Journal of Physics D Applied Physics · doi:10.1088/1361-6463/ae3294 · Cited by 2
“|) were compared, enabling a simultaneous consideration of mass transport effects and reaction kinetics to comprehensively evaluate their performance at high-current-density [42, 43].”
6R-TaS 2 Anchored on Mo Foil as a Robust Electrocatalyst for Hydrogen Evolution
Kagkoura, A., Oliveira, F. M., Mosina, K., Luxa, J., & Sofer, Z. (2025) · ACS Applied Materials & Interfaces · doi:10.1021/acsami.5c22479 · Cited by 3
“6,7 Tantalum disulfide (TaS 2 ) has recently gained attention as a catalyst for the HER owing to its metallic conductivity � observed across its main polymorphs (1T, 3R, and 6R) � and its good structural stability.”
Accelerated Electro‐Conversion of a Nickel Coordination Complex for Hybrid Water Electrolysis
Rao, N. N., Kumar, A., Kúš, P., Chandraraj, A., Kovilakath, M. S. N., Hrbek, T., Matolínová, I., & John, N. S. (2025) · Small · doi:10.1002/smll.202507907 · Cited by 2
Zhang, D., & Guo, Y. (2025) · Clean Energy Science and Technology · doi:10.18686/cest294 · Cited by 2
“The second type of material includes transition metal sulfides [98–100], oxides [101–103], carbides [104,105], phosphides [106–108] and hydroxides [109– 111].”
Wang, F., Guo, W., Wang, J., Ren, Z., Gong, Y., & Wang, T. (2024) · International Journal of Hydrogen Energy · doi:10.1016/j.ijhydene.2024.03.201 · Cited by 3
A review on the degradation of hydrogen evolution electrodes under fluctuating renewable electricity
Wang, J., Liang, S., Wang, Y., Hu, Y., Zhang, H., Sun, Z., Lin, B., & Tang, J. (2026) · Surface Science and Technology · doi:10.1007/s44251-026-00159-z · Cited by 1
“As a result, both interfacial reaction kinetics and mass-transport processes are significantly enhanced, and the rate-determining step progressively shifts from charge-transfer control to diffusion control [69, 77] (Fig.”
Liu, R., Wang, J., Chen, G., Jiang, Z., Wei, H., Yang, H., Guo, Y., & Huang, J. (2026) · Advanced Functional Materials · doi:10.1002/adfm.77229
Morphology Control of Hydrogen Evolution Reaction Catalyst Promoting H2 Mass Transfer
Lin, G., Dong, A., Li, Z., Wang, L., & Sun, L. (2026) · Nano Letters · doi:10.1021/acs.nanolett.6c02436 · Cited by 3
Kim, J., Jang, E., Heo, H., Kang, B., Song, I., Kim, M., & Yoon, S. M. (2026) · Bulletin of the Korean Chemical Society · doi:10.1002/bkcs.70190 · Cited by 1
Huang, X.-Q., Jiang, H.-S., Ge, B.-X., Huang, C.-J., & Tang, J. (2026) · ChemSusChem · doi:10.1002/cssc.70782 · Cited by 1
Elsharkawy, S., Youssif, M. M., & Zabinski, P. R. (2026) · Coatings · doi:10.3390/coatings16050585 · Cited by 1
Fan, C., Du, R., Wang, G., Tao, H., Zhang, J., & Tang, Z. (2026) · Applied Catalysis B: Environmental · doi:10.1016/j.apcatb.2026.127002
Zhang, W., Yuan, Y., Li, X., Liao, Z., Zhang, X., Du, C., & Chen, J. (2026) · Materials Today Physics · doi:10.1016/j.mtphys.2026.102101
Yu, H., Zhang, H., Wei, S.-C., Wu, Z.-Y., Liu, G.-H., Wu, C.-C., & Wu, L.-L. (2026) · Materials Today Energy · doi:10.1016/j.mtener.2026.102287 · Cited by 1
Niu, Z., Shi, Z., Huang, J., GaiXiu, Y. A. N. G., & Chen, Y. (2026) · ACS Sustainable Chemistry & Engineering · doi:10.1021/acssuschemeng.5c13256 · Cited by 2
Zhang, X.-C., Yang, C., Zhou, D.-Y., Zhang, D., Zhang, J., & Wang, Z.-Y. (2025) · Journal of Alloys and Compounds · doi:10.1016/j.jallcom.2025.185708 · Cited by 1
Huang, C., Wang, Y., Zhang, L., Huo, J., Ma, D., Xu, Q., & Li, G. (2025) · Quantum Frontiers · doi:10.1007/s44214-025-00092-6 · Cited by 2
“1c), beyond which the apparent activity is governed by mass transport or bubble detachment dynamics [23].”
Nitrate Coordination Expedites Low-Valence Charge Transition Cycle of Ni for Stable Oxygen Evolution
Li, M., Liu, Y., Liu, H.-J., Dong, B., Chai, Y.-M., Zhang, X.-Y., Zhou, Y.-N., & Tang, Q.-W. (2025) · ACS Applied Energy Materials · doi:10.1021/acsaem.5c02824 · Cited by 1
Kang, J., Lee, E., & Ham, H. C. (2025) · Korean Journal of Chemical Engineering · doi:10.1007/s11814-025-00506-0 · Cited by 1
Tsotetsi, D., Seadira, T., Fakayode, O., Segale, M., Mothudi, B. M., Mbule, P. S., & Dhlamini, M. (2025) · FlatChem · doi:10.1016/j.flatc.2025.100864 · Cited by 1
Wang, J., Wang, X., Sun, S., Yuan, Y., Wang, T., Zhao, Z., Zhou, J., & Gao, F. (2025) · Catalysis Letters · doi:10.1007/s10562-025-04935-8 · Cited by 1
“High current density is a critical requirement for industrial water electrolysis [45–47].”
Yu, L., Chen, X., Cheng, S., Zhong, T., Zhou, R., Deng, Z.-H., & Li, L. (2025) · Nanoscale · doi:10.1039/d4nr05221h · Cited by 1
Two‐Dimensional Crystalline Electrocatalysts for Efficient Reduction of Carbon Dioxide
Dai, L., Zong, J., Liang, L., & Li, P.-F. (2024) · ChemElectroChem · doi:10.1002/celc.202400009 · Cited by 1
Precise Interstitial Built-In Electric Field Tuning for Hydrogen Evolution Electrocatalysis
Fei, J., Zhang, D., Wang, T., Shi, Y., Zhu, J., Zhan, T., Tian, M., Lai, J., & Wang, L. (2023) · Inorganic Chemistry · doi:10.1021/acs.inorgchem.3c03291 · Cited by 1
Design of heterojunction with components in different dimensions for electrocatalysis applications
Kong, Q., An, X., Zhang, J., Yao, W., & Sun, C. (2022) · Frontiers of Physics · doi:10.1007/s11467-022-1183-0 · Cited by 2
Liu, Z.-W., Wang, Y.-G., Zhao, Z.-T., Sun, Y.-F., Xu, Y.-Y., Duan, S.-B., & Wang, R.-M. (2026) · Materials Today Energy · doi:10.1016/j.mtener.2026.102422
Selective CoOct dissolution enables CoTd-O-Fe interfaces for durable water oxidation
Liu, H.-J., Liu, W.-X., Liu, M.-Y., Zhou, Y.-N., Zhang, X.-Y., Zhang, S., Manke, I., Sun, F., & Tang, Q.-W. (2026) · Nano Energy · doi:10.1016/j.nanoen.2026.112525
Dutta, A., Porat, H., Lal, A., Borenstein, A., Zak, A., Makrinich, G., & Laikhtman, A. (2026) · Small · doi:10.1002/smll.76302
Zhang, X., Zhang, W., Geng, Y., Liu, X., & Hou, L. (2026) · Chinese Journal of Structural Chemistry · doi:10.1016/j.cjsc.2026.101127
Kim, S.-H., Choi, H., Kim, Y., Kim, T., & Park, H. (2026) · Gels · doi:10.3390/gels12100932
“Visible H 2 bubble evolution was observed at the electrode surface at all three current densities, with more vigorous gas evolution at higher current densities, providing visual evidence of sustained HER operation under high-current-density conditions [6,42–44].”
Rehman, A., Nazir, G., Jaidka, S., Heo, K., Hussain, S., Aftab, S., Khalid, A., Lee, S.-Y., & Park, S. (2026) · Journal of Energy Chemistry · doi:10.1016/j.jechem.2026.10.018
Hossain, M. A., Delgado, L., Adanigbo, P., Xia, W., Wang, C., Rangan, S., Fatima, B., Yu, Y., & Akopov, G. (2026) · Chemistry of Materials · doi:10.1021/acs.chemmater.6c02150 · Cited by 1
Song, H., Wang, J., Wang, X., Ran, G., Lin, C., Lou, T., Song, J., Cheng, X., Zhou, W., & Li, H. (2026) · Journal of Energy Chemistry · doi:10.1016/j.jechem.2026.08.087
Zhang, H., Noisternig, S. M., Jiang, Q., Šala, M., Bautista‐Anguís, D., Rentenberger, C., Singh, D., Sun, H., Rafailović, L. D., & Eckert, J. (2026) · ACS Applied Energy Materials · doi:10.1021/acsaem.6c01836
Yu, F., Kang, X., Liu, J., Liu, H., Huang, C., Wang, Y., Dong, Y., Lin, S., Li, Z., Yu, Q., et al. (2026) · Advanced Materials · doi:10.1002/adma.74085
“Additionally, the CoVO catalyst exhibits the lowest Tafel slope and the Δ η /Δlog| j | ( R η /j ) ratio (FigureS9;Figure2b)[35–37],demonstratingitsfastmasstransfer kinetics across a wide current density range from 0 to 2000 mA cm − 2 .”
Self-citationGao, Y., Xue, Y.-R., Chen, S., Chen, S.-Y., Zheng, Y.-H., Ping, X.-Y., Dong, C.-C., Zhang, M., Fang, S., & Li, Y.-L. (2026) · Advances in Materials · doi:10.1002/adma.74127
“Non-precious metal-based catalysts have emerged as promising alternatives [ 13–18 ], but their performance still fails to meet practical requirements and is fundamentally limited by sluggish reaction kinetics and intrinsic activity.”
Liu, X., Sun, H., Wang, Y., Huang, Q., Luo, Y., Zhang, L., Guo, Y., & Wan, H. (2026) · Applications of Surface Science · doi:10.1016/j.apsusc.2026.167836
Self-citationZhu, M., Zheng, J., He, Z., Kuang, Y., Li, H., Yuan, X., Li, X., Gao, Z., Yang, F., Zhang, S., et al. (2026) · Surfaces and Interfaces · doi:10.1016/j.surfin.2026.110124
Hong, S., Liu, W., Cheng, J., Qu, C.-H., Pan, H.-Y., Zhang, W.-L., Hu, B., Liu, L.-C., Dong, H.-J., & Li, C.-M. (2026) · Energy Technology · doi:10.1002/ente.70601
Transition Metal Sulfides: Promising Catalysts for the Hydrogen Evolution Reaction (HER)
Abushuhel, M., Abosaoda, M. K., M, R. M., Ray, S., Chennakesavulu, K., Sharma, R., Kashyap, A., & Chauhan, A. S. (2026) · Journal of Cluster Science · doi:10.1007/s10876-026-03036-9
“While MoS 2 excels in acidic media due to active sulfur edges [ 76 , 77 ], its performance in alkaline conditions is limited by sluggish kinetics [78 , 79 ].”
Ju, F., Zhang, X., & Chen, K.-W. (2026) · Langmuir · doi:10.1021/acs.langmuir.6c01096
Xu, Z., Su, P., Zhang, Q., Wu, J., Chen, W., Jiang, Z., & Jiang, Z. (2026) · Small Methods · doi:10.1002/smtd.70736
“Recent studies have highlighted that operation at large current density is crucial for the practical implementation of water electrolysis [ 42, 43 ].”
Pan, X., Zhao, Y., Baimbetov, D., Muralev, Y., Syrlybekkyzy, S., Akhmetov, B. B., Haji, S. K., & Abbas, Q. (2026) · ChemistryOpen · doi:10.1002/open.70222
“…and liquid phases, instantaneous quantification of products such as CO, C 2 H 4 , and ethanol is achieved, providing experimental evidence for constructing dynamic activity maps [253]. suppressing the hydrogen evolution reaction (HER) while enhancing the selectivity for C 2 + products [59, 256].”
Baiju, S., & Kaghazchi, P. (2026) · doi:10.48550/arxiv.2604.26264
“Crystal morphology in turn plays a central role in controlling key material properties, including electrochemical performance and catalytic activity [4, 5].”
Xu, C., Zhang, J., Chen, S., Tan, X., Wang, Z., & Guo, Y. (2026) · Journal of Power Sources · doi:10.1016/j.jpowsour.2026.239500
Wang, D., Yang, Y., Wang, J., Lin, K., Zhang, C.-Q., Li, Y.-C., Yue, W., He, Z., Xiang, Y., & Li, J. (2026) · Applied Catalysis B: Environment and Energy · doi:10.1016/j.apcatb.2026.126781
Xu, A., Zhou, Z., Yan, E., Tao, L., Chen, H., Huang, G., Sun, H., & Sun, L. (2026) · Journal of Materials Science · doi:10.1007/s10853-026-12205-0 · Cited by 1
“Furthermore, Liu et al. [61] demonstrated that HER catalytic performance was closely correlated with the density of surface-active sites.”
Barrientos, M. S., Baumann, R., Zschach, L. G., Marzec, M., Sallese, M., & Lasagni, A. (2025) · Small Structures · doi:10.1002/sstr.202500763
“In this context, the interaction between structured surfaces and liquid phases is critical in the design of catalytic electrodes for HER [15 – 17].”
Deepika, C., R, Y., & G., R. (2025) · Energy & Fuels · doi:10.1021/acs.energyfuels.5c00643
Hou, Y., Feng, S.-M., Zhao, S., Liu, M., & Liu, B.-L. (2021) · Chinese Science Bulletin · doi:10.1360/tb-2020-1535
Self-citationYang, Z., Gao, M., Hou, B., Li, X., & Liu, Y. (2025) · Applied Surface Science · doi:10.1016/j.apsusc.2025.164927 · Cited by 2
A DFT study on the electrocatalytic water splitting performance of heterostructure Bi2S3/Ni3S2
Yi, D., Chen, X., Cai, W.-F., & Li, L.-C. (2025) · Surface Science · doi:10.1016/j.susc.2025.122832
Metadata
- Authors
- Luo, Y., Tang, L., Khan, U., Yu, Q., Cheng, H.-M., Zou, X., & Liu, B.
- Affiliations
- Tsinghua–Berkeley Shenzhen Institute (CN)
- Chinese Academy of Sciences (CN)
- Corresponding author
- Zou, Xiaolong
- Liu, Bilu
- Venue
- Nature Communications
- Published
- 2019-01-17
- Volume
- 10
- Issue
- 1
- Pages
- 269-269
- ISSN
- 2041-1723 (ISSN-L)
- PMC
- PMC6336864
- OpenAlex
- W2915424365
- Cited by
- 713
- References
- 53
- Citations by year
- 2026: 49 · 2025: 92 · 2024: 133 · 2023: 117 · 2022: 120 · 2021: 92 · 2020: 67 · 2019: 43
- FWCI
- 17.13
- Type
- journal article
- Language
- en
- Open access
- gold
- doi.org
- Locations
- Nature Communications (publishedVersion, cc-by)
- Europe PMC (PubMed Central) (publishedVersion, cc-by)
- PubMed Central (publishedVersion, cc-by)
- PubMed (publishedVersion)
- RePEc: Research Papers in Economics (submittedVersion)
- DOAJ (DOAJ: Directory of Open Access Journals) (submittedVersion, cc-by-sa)
- DOAJ (DOAJ: Directory of Open Access Journals) (submittedVersion)
- Funders
- National Natural Science Foundation of China (51722206, JCYJ20170307140956657)
- Development and Reform Commission of Shenzhen Municipality (JCYJ20170307140956657, 51722206)
- Shenzhen Fundamental Research Program (JCYJ20170307140956657)
- Topics
- Physical Sciences › Energy › Renewable Energy, Sustainability and the Environment › Electrocatalysts for Energy Conversion
- Physical Sciences › Energy › Renewable Energy, Sustainability and the Environment › CO2 Reduction Techniques and Catalysts
- Physical Sciences › Materials Science › Materials Chemistry › Hydrogen Storage and Materials
- Keywords
- hydrogen evolution reaction, electrocatalysts, molybdenum carbide nanoparticles, catalyst morphology, surface chemistry, high current density, mass transfer, surface oxygen groups, platinum foil, acidic and alkaline media, electrochemical hydrogen production
About these checks
Registry, retraction, Cites and statistics results are computed, not judged, with one exception: a printed reference that no index lists is read once by a model before it counts as a citation error. Claims are extracted by a model and kept only when their quote appears verbatim in the text; each cited source is then checked, with a model’s help, for whether it says what the claim relies on. Those verdicts can be wrong — read the claim’s quote and the cited source before relying on one.
Statistics and arithmetic are recomputed, not judged.
Confidence bands are shown only for fields calibrated on our annotated test set. None is calibrated yet, so no band is shown.
What counts as a claim ›How we measure confidence ›How we check this ›
Are you an author, or do you see a problem with this page? Request a review
