Cited by 201Pluripotent Stem Cells ResearchCongenital heart defects researchMesenchymal stem cell research

The DOI matches its Crossref record; 71 of the 71 references it cites were found in a registry or an index.

Functional cardiac fibroblasts derived from human pluripotent stem cells via second heart field progenitors

Open access

Abstract

Cardiac fibroblasts (CFs) play critical roles in heart development, homeostasis, and disease. The limited availability of human CFs from native heart impedes investigations of CF biology and their role in disease. Human pluripotent stem cells (hPSCs) provide a highly renewable and genetically defined cell source, but efficient methods to generate CFs from hPSCs have not been described. Here, we show differentiation of hPSCs using sequential modulation of Wnt and FGF signaling to generate second heart field progenitors that efficiently give rise to hPSC-CFs. The hPSC-CFs resemble native heart CFs in cell morphology, proliferation, gene expression, fibroblast marker expression, production of extracellular matrix and myofibroblast transformation induced by TGFβ1 and angiotensin II. Furthermore, hPSC-CFs exhibit a more embryonic phenotype when compared to fetal and adult primary human CFs. Co-culture of hPSC-CFs with hPSC-derived cardiomyocytes distinctly alters the electrophysiological properties of the cardiomyocytes compared to co-culture with dermal fibroblasts. The hPSC-CFs provide a powerful cell source for research, drug discovery, precision medicine, and therapeutic applications in cardiac regeneration.

Overview

The claims and statistics of this paper haven’t been checked yet.

Run the check — free, no account needed. It reads the open-access text and checks the sources it cites.

A few free checks a day · papers already verified open instantly · results are public

Integrity signals

Registry

Crossref · 10.1038/s41467-019-09831-5

Cites

71 of 71 references verified0 citation errors · 0 not checkable

Statistics

Figures

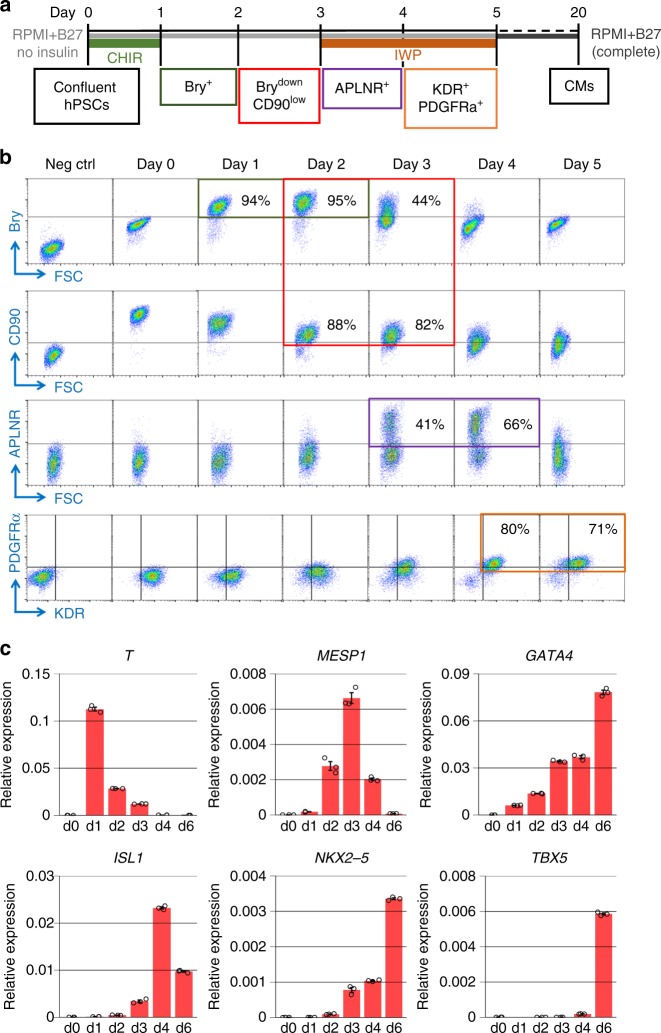
Fig. 1 Identification of progenitors in cardiac differentiation of hPSCs. a Schematic method for the small molecule protocol using GSK3β inhibition with CHIR followed by Wnt inhibition with IWP (GiWi protocol) to efficiently differentiate hPSCs to cardiomyocytes (CMs) and the associated markers for stage-specific progenitors. b Flow cytometry of stage-specific progenitors labeled by Brachyury (Bry), CD90, Apelin receptor (APLNR), KDR, and PDGFRα in early differentiation (day 0–5) of the GiWi protocol. No primary antibody controls and isotype controls were performed for each time point, and the day 0, no primary antibody control (Neg ctrl) is shown as an example. c qRT-PCR showing the expression of relevant mesodermal and cardiac-related transcription factors in the progenitor stages of the GiWi protocol (day 0–6, n = 3 technical replicates). TBX5, d1 expression was not detectable. Data are mean ± SEM. The data are from DF19-9-11T hiPSC line
Fig. 1 Identification of progenitors in cardiac differentiation of hPSCs. a Schematic method for the small molecule protocol using GSK3β inhibition with CHIR followed by Wnt inhibition with IWP (GiWi protocol) to efficiently differentiate hPSCs to cardiomyocytes (CMs) and the associated markers for stage-specific progenitors. b Flow cytometry of stage-specific progenitors labeled by Brachyury (Bry), CD90, Apelin receptor (APLNR), KDR, and PDGFRα in early differentiation (day 0–5) of the GiWi protocol. No primary antibody controls and isotype controls were performed for each time point, and the day 0, no primary antibody control (Neg ctrl) is shown as an example. c qRT-PCR showing the expression of relevant mesodermal and cardiac-related transcription factors in the progenitor stages of the GiWi protocol (day 0–6, n = 3 technical replicates). TBX5, d1 expression was not detectable. Data are mean ± SEM. The data are from DF19-9-11T hiPSC lineCC BY · PubMed Central
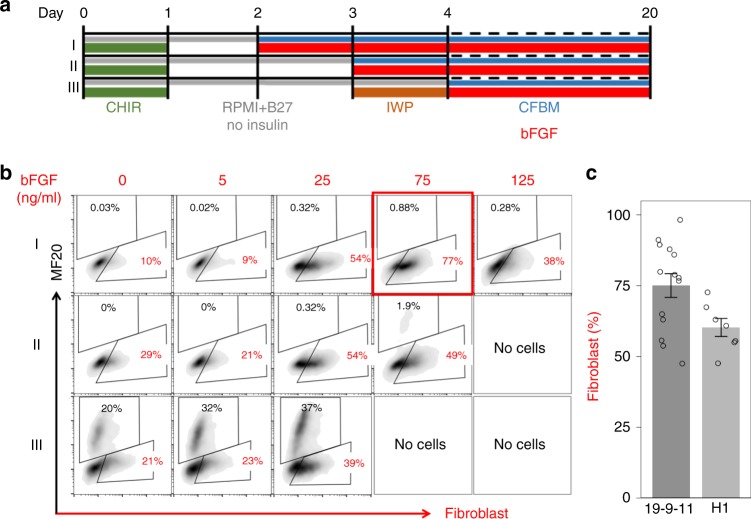
Fig. 2 Effect of bFGF on hPSC-derived mesodermal and cardiac progenitors. a Schematic for testing the concentration-dependent effect of bFGF addition to stage-specific progenitors generated by the GiWi protocol beginning bFGF on day 2, 3, or 4, corresponding to labeled protocols I, II, and III. Gray lines indicate RPMI medium+B27 without insulin supplement; blue lines indicate cardiac fibroblast basal medium (CFBM); green lines indicate CHIR treatment; red lines indicate bFGF treatment; orange line indicates IWP treatment. b Flow cytometry analysis of day 20 differentiated cells from protocols I, II, III labeled by human fibroblast marker (clone TE-7 antibody) and cardiomyocyte marker (MF20 antibody for sarcomeric myosin). c Average percentage of fibroblast population differentiated from hESC line H1 (n = 7, biological replicates) and hiPSC line DF19-9-11T (n = 14, biological replicates) at 20 days. Data are mean ± SEM
Fig. 2 Effect of bFGF on hPSC-derived mesodermal and cardiac progenitors. a Schematic for testing the concentration-dependent effect of bFGF addition to stage-specific progenitors generated by the GiWi protocol beginning bFGF on day 2, 3, or 4, corresponding to labeled protocols I, II, and III. Gray lines indicate RPMI medium+B27 without insulin supplement; blue lines indicate cardiac fibroblast basal medium (CFBM); green lines indicate CHIR treatment; red lines indicate bFGF treatment; orange line indicates IWP treatment. b Flow cytometry analysis of day 20 differentiated cells from protocols I, II, III labeled by human fibroblast marker (clone TE-7 antibody) and cardiomyocyte marker (MF20 antibody for sarcomeric myosin). c Average percentage of fibroblast population differentiated from hESC line H1 (n = 7, biological replicates) and hiPSC line DF19-9-11T (n = 14, biological replicates) at 20 days. Data are mean ± SEMCC BY · PubMed Central
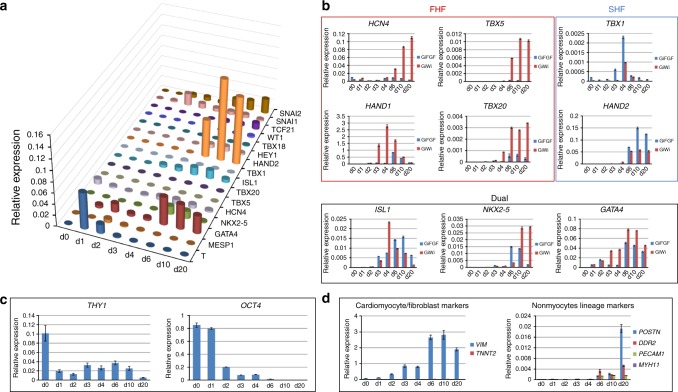
Fig. 3 Analysis of cardiogenic gene expression during GiFGF protocol. a qRT-PCR showing the expression and hierarchy of transcription factors in the time course of the GiFGF protocol (day 0–20). b qRT-PCR showing the expression patterns of the transcription factors in FHF and SHF in the GiFGF protocol in comparison with the GiWi protocol. c qRT-PCR showing the expression time course of CD90 and OCT4 in GiFGF protocol (day 0–20). d qRT-PCR showing the expression of markers for fibroblasts (VIM, POSTN, and DDR2), cardiomyocytes (TNNT2), and nonmyocyte lineages (PECAM1 and MYH11) in the time course of the GiFGF protocol (day 0–20). The qRT-PCR time course data are from consecutive samples from the same differentiation round with n = 3 technical replicates for each point. Data are mean ± SEM. The data are from DF19-9-11T hiPSC line
Fig. 3 Analysis of cardiogenic gene expression during GiFGF protocol. a qRT-PCR showing the expression and hierarchy of transcription factors in the time course of the GiFGF protocol (day 0–20). b qRT-PCR showing the expression patterns of the transcription factors in FHF and SHF in the GiFGF protocol in comparison with the GiWi protocol. c qRT-PCR showing the expression time course of CD90 and OCT4 in GiFGF protocol (day 0–20). d qRT-PCR showing the expression of markers for fibroblasts (VIM, POSTN, and DDR2), cardiomyocytes (TNNT2), and nonmyocyte lineages (PECAM1 and MYH11) in the time course of the GiFGF protocol (day 0–20). The qRT-PCR time course data are from consecutive samples from the same differentiation round with n = 3 technical replicates for each point. Data are mean ± SEM. The data are from DF19-9-11T hiPSC lineCC BY · PubMed Central
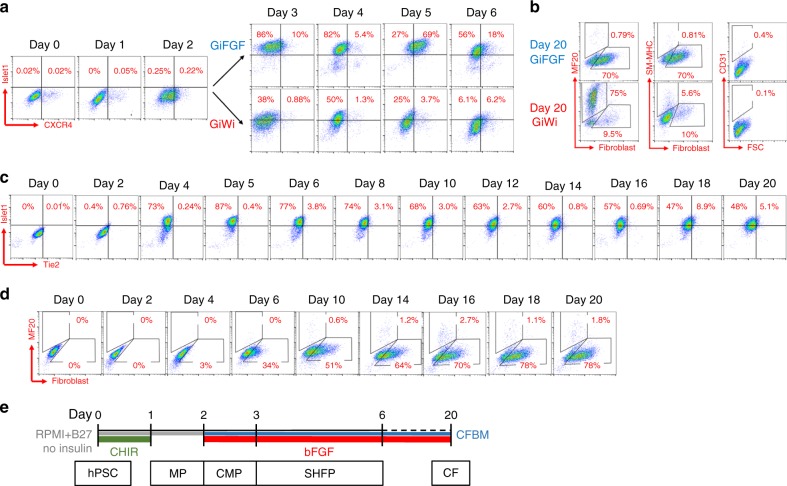
Fig. 4 Evaluation of progenitors and cardiovascular lineages in CF and CM differentiation. a Flow cytometry analysis of cells on day 0–6 in the GiFGF and GiWi protocols for FHF/SHF marker Islet1 and SHF marker CXCR4. For day 0–2, the protocols are identical, diverging on day 3. b Flow cytometry analysis of the day 20 differentiated cells from the GiFGF and GiWi protocols for fibroblasts (anti-human fibroblasts, clone TE-7), CMs (MF20), smooth muscle cells (SM-MHC), and endothelial cells (CD31). c Flow cytometry analysis of cells throughout the GiFGF protocol for expression of Islet1 and the endothelial progenitor marker, Tie2. d Flow cytometry analysis of cells throughout the GiFGF protocol for expression of the fibroblast marker (anti-human fibroblasts, clone TE-7). e Schematic method of the GiFGF protocol and stage-specific progenitors in differentiation of hPSCs to CFs. Gray lines indicate RPMI medium+B27 without insulin supplement; blue lines indicate cardiac fibroblast basal medium (CFBM); green lines indicate CHIR treatment; red lines indicate bFGF treatment. MP mesodermal progenitor, CMP cardiac mesodermal progenitor, SHFP second heart field progenitor, CF cardiac fibroblast. The data are from DF19-9-11T hiPSC line
Fig. 4 Evaluation of progenitors and cardiovascular lineages in CF and CM differentiation. a Flow cytometry analysis of cells on day 0–6 in the GiFGF and GiWi protocols for FHF/SHF marker Islet1 and SHF marker CXCR4. For day 0–2, the protocols are identical, diverging on day 3. b Flow cytometry analysis of the day 20 differentiated cells from the GiFGF and GiWi protocols for fibroblasts (anti-human fibroblasts, clone TE-7), CMs (MF20), smooth muscle cells (SM-MHC), and endothelial cells (CD31). c Flow cytometry analysis of cells throughout the GiFGF protocol for expression of Islet1 and the endothelial progenitor marker, Tie2. d Flow cytometry analysis of cells throughout the GiFGF protocol for expression of the fibroblast marker (anti-human fibroblasts, clone TE-7). e Schematic method of the GiFGF protocol and stage-specific progenitors in differentiation of hPSCs to CFs. Gray lines indicate RPMI medium+B27 without insulin supplement; blue lines indicate cardiac fibroblast basal medium (CFBM); green lines indicate CHIR treatment; red lines indicate bFGF treatment. MP mesodermal progenitor, CMP cardiac mesodermal progenitor, SHFP second heart field progenitor, CF cardiac fibroblast. The data are from DF19-9-11T hiPSC lineCC BY · PubMed Central
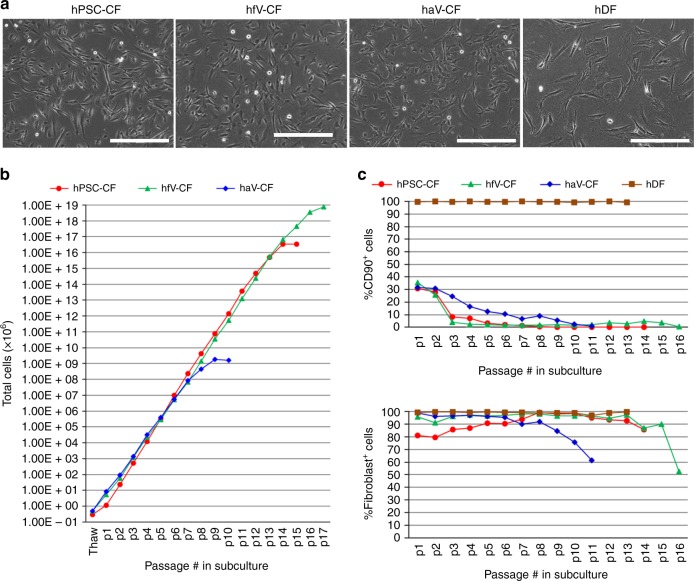
Fig. 5 Comparison of CF and DF in morphology, proliferation and marker expression. a Phase contrast images of hPSC-CFs, hfV-CFs, haV-CFs, and hDFs. b Growth capacity of hPSC-CF, hfV-CF, and haV-CF during sequential passaging. c CD90 and the human fibroblast maker (clone TE-7) expression examined by flow cytometry in hPSC-CFs, hfV-CF, haV-CFs, and hDFs during passaging. Scale bars are 400 μm. The hPSC-CFs are from hiPSC line DF-19-9-11T. The primary hfV-CFs are from Cell Applications, Inc. The haV-CFs are from Lonza, NHCF-V. The hDF line is from skin biopsies from healthy donor
Fig. 5 Comparison of CF and DF in morphology, proliferation and marker expression. a Phase contrast images of hPSC-CFs, hfV-CFs, haV-CFs, and hDFs. b Growth capacity of hPSC-CF, hfV-CF, and haV-CF during sequential passaging. c CD90 and the human fibroblast maker (clone TE-7) expression examined by flow cytometry in hPSC-CFs, hfV-CF, haV-CFs, and hDFs during passaging. Scale bars are 400 μm. The hPSC-CFs are from hiPSC line DF-19-9-11T. The primary hfV-CFs are from Cell Applications, Inc. The haV-CFs are from Lonza, NHCF-V. The hDF line is from skin biopsies from healthy donorCC BY · PubMed Central
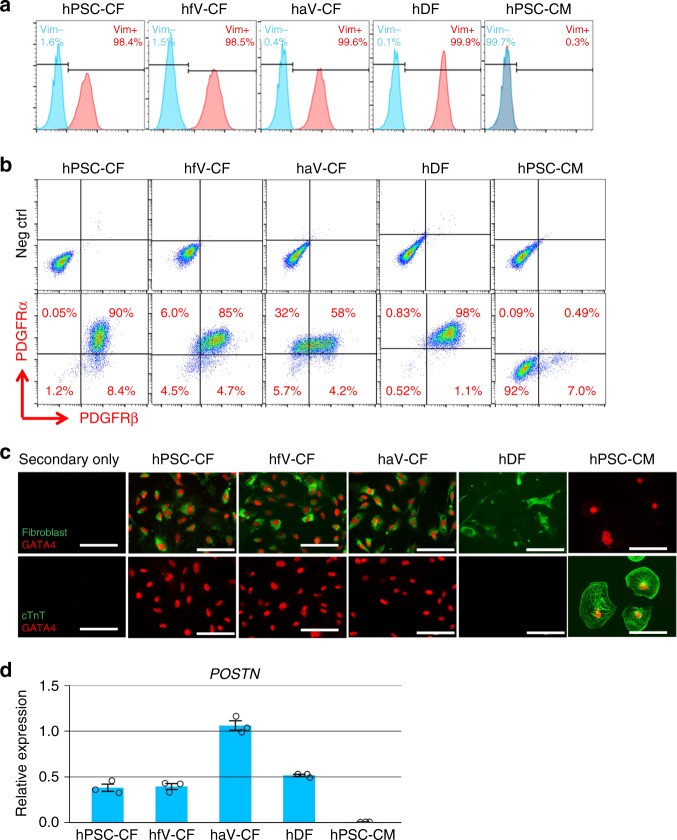
Fig. 6 Representative markers expression in CF, DF and hPSC-CM. a Histogram plot of flow cytometry analysis for vimentin. b Flow cytometry analysis of co-labeling for PDGFRα and PDGFRβ. c Immunolabeling by antibodies for fibroblast (clone TE-7), cTnT and GATA4. d POSTN expression examined by qRT-PCR (n = 3 technical replicates). Data are mean ± SEM. Scale bars are 100 μm. All fibroblasts samples used in the measurement are from passages 3 to 7. The hPSCs are DF19-9-11T hiPSCs. The primary hfV-CFs are from Cell Applications, Inc. The haV-CFs are from Lonza, NHCF-V. The hDF line is from skin biopsies from healthy donor
Fig. 6 Representative markers expression in CF, DF and hPSC-CM. a Histogram plot of flow cytometry analysis for vimentin. b Flow cytometry analysis of co-labeling for PDGFRα and PDGFRβ. c Immunolabeling by antibodies for fibroblast (clone TE-7), cTnT and GATA4. d POSTN expression examined by qRT-PCR (n = 3 technical replicates). Data are mean ± SEM. Scale bars are 100 μm. All fibroblasts samples used in the measurement are from passages 3 to 7. The hPSCs are DF19-9-11T hiPSCs. The primary hfV-CFs are from Cell Applications, Inc. The haV-CFs are from Lonza, NHCF-V. The hDF line is from skin biopsies from healthy donorCC BY · PubMed Central
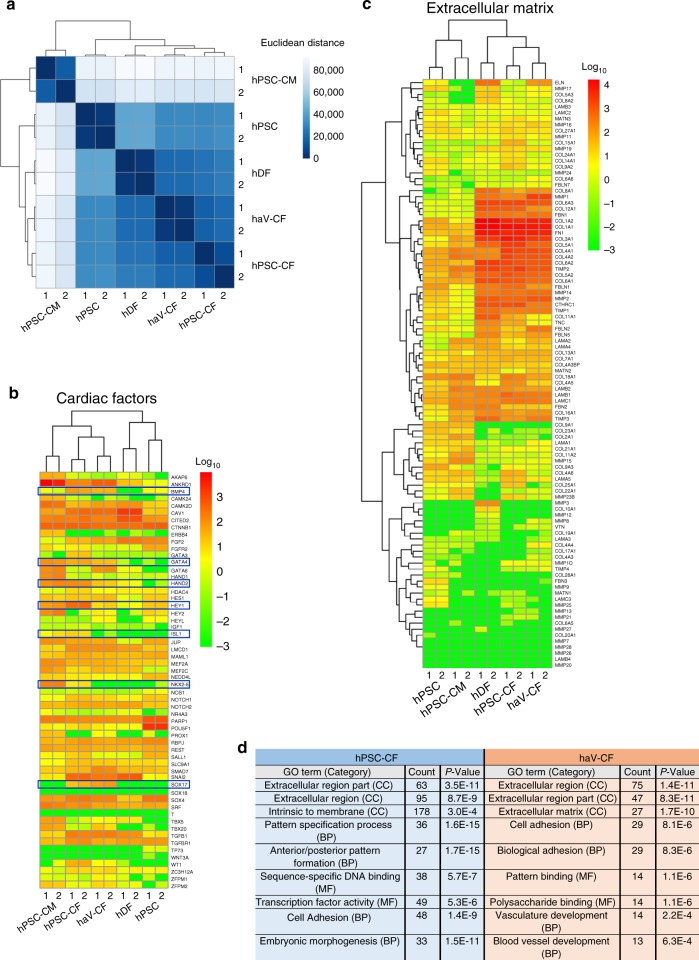
Fig. 7 Gene expression by RNA-seq in CF compared to DF, hPSC-CM, and hPSC. a Dendrogram showing the similarity in the abundance of overall transcripts (19,084 genes) across samples of hPSC-CF, haV-CF, hDF, hPSC-CM, and hPSC that was calculated by Euclidean distance. b Heatmap of cardiac factors (58 genes) expression across samples of hPSC-CF, haV-CF, hDF, hPSC-CM, and hPSC organized by unsupervised cluster analysis. c Heatmap of extracellular matrix related gene expression (98 genes) across samples of hPSC-CF, haV-CF, hDF, hPSC-CM, and hPSC presented by unsupervised cluster analysis. d Gene ontology (GO) analysis using the functional annotation tool (DAVID Bioinformatics Resources 6.7, NIAID/NIH) for the differentially expressed genes in hPSC-CF and haV-CF (Supplementary Data 1 and 2) with calculated p values shown. The hPSC line used for RNA-seq are DF19-9-11T hiPSCs. The haV-CFs are from Lonza, NHCF-V, and hDFs are from 020a line. The TPM values from the RNA-seq were used for the analysis
Fig. 7 Gene expression by RNA-seq in CF compared to DF, hPSC-CM, and hPSC. a Dendrogram showing the similarity in the abundance of overall transcripts (19,084 genes) across samples of hPSC-CF, haV-CF, hDF, hPSC-CM, and hPSC that was calculated by Euclidean distance. b Heatmap of cardiac factors (58 genes) expression across samples of hPSC-CF, haV-CF, hDF, hPSC-CM, and hPSC organized by unsupervised cluster analysis. c Heatmap of extracellular matrix related gene expression (98 genes) across samples of hPSC-CF, haV-CF, hDF, hPSC-CM, and hPSC presented by unsupervised cluster analysis. d Gene ontology (GO) analysis using the functional annotation tool (DAVID Bioinformatics Resources 6.7, NIAID/NIH) for the differentially expressed genes in hPSC-CF and haV-CF (Supplementary Data 1 and 2) with calculated p values shown. The hPSC line used for RNA-seq are DF19-9-11T hiPSCs. The haV-CFs are from Lonza, NHCF-V, and hDFs are from 020a line. The TPM values from the RNA-seq were used for the analysisCC BY · PubMed Central
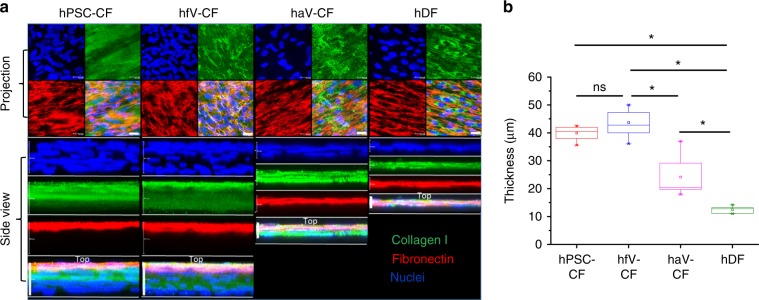
Fig. 8 ECM production in CF and DF cultures. a Confocal imaging of high density cultures of hPSC-CF, hfV-CF, haV-CF, and hDF immunolabeling for extracellular collagen I and fibronectin. Z-scans are presented as projection images in the top panels and 3D reconstructions showing side views in lower panels. Scale bars in Projection are 25 μm. Scale bars in Side view of hPSC-CF and hfV-CF are 40 μm, haV-CF are 20 μm, and hDF are 15 μm. b Thickness of the 3D ECM scaffolds measured from 3D reconstructions of hPSC-CF (n = 8), hfV-CF (n = 9), haV-CF (n = 12), and hDF (n = 6) biological replicates. The box plots summarize the biological replicates with the box enclosing from first to third quartile, middle square indicating mean, line in box indicating median, and whiskers indicating outliers. *P < 0.05, one-way ANOVA with post hoc Bonferroni test
Fig. 8 ECM production in CF and DF cultures. a Confocal imaging of high density cultures of hPSC-CF, hfV-CF, haV-CF, and hDF immunolabeling for extracellular collagen I and fibronectin. Z-scans are presented as projection images in the top panels and 3D reconstructions showing side views in lower panels. Scale bars in Projection are 25 μm. Scale bars in Side view of hPSC-CF and hfV-CF are 40 μm, haV-CF are 20 μm, and hDF are 15 μm. b Thickness of the 3D ECM scaffolds measured from 3D reconstructions of hPSC-CF (n = 8), hfV-CF (n = 9), haV-CF (n = 12), and hDF (n = 6) biological replicates. The box plots summarize the biological replicates with the box enclosing from first to third quartile, middle square indicating mean, line in box indicating median, and whiskers indicating outliers. *P < 0.05, one-way ANOVA with post hoc Bonferroni testCC BY · PubMed Central
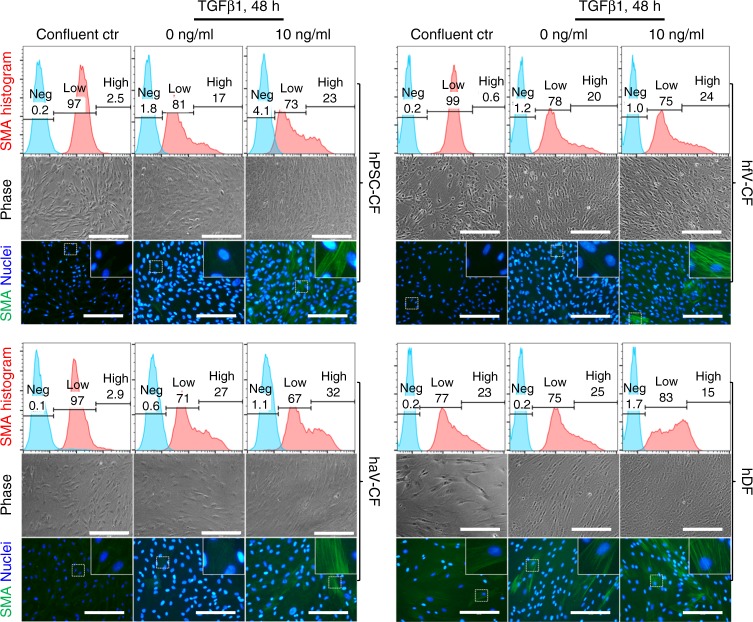
Fig. 9 Myofibroblast transformation of CFs and DFs. Analysis of α-smooth muscle actin (SMA) expressing cells to assay for myofibroblast transformation from hPSC-CF, hfV-CF, haV-CF, and hDF in culture. All fibroblast cultures in passages 4–6 were treated with 10 ng/ml TGFβ1 for 48 h in DMEM+10% FBS medium. Expression of SMA was measured by both flow cytometry (upper panel) and immunolabeling (lower panel). Phase contrast images of representative cultures are shown in the middle panel. Phase contrast images and SMA immunofluorescence images are from the same biological samples, but not the same field of view. Scale bars are 200 μm. The hPSC-CFs are derived from DF19-9-11T hiPSCs. The hfV-CFs are from Cell Applications, Inc. The haV-CFs are from Lonza, NHCF-V, and hDFs are from 023a line
Fig. 9 Myofibroblast transformation of CFs and DFs. Analysis of α-smooth muscle actin (SMA) expressing cells to assay for myofibroblast transformation from hPSC-CF, hfV-CF, haV-CF, and hDF in culture. All fibroblast cultures in passages 4–6 were treated with 10 ng/ml TGFβ1 for 48 h in DMEM+10% FBS medium. Expression of SMA was measured by both flow cytometry (upper panel) and immunolabeling (lower panel). Phase contrast images of representative cultures are shown in the middle panel. Phase contrast images and SMA immunofluorescence images are from the same biological samples, but not the same field of view. Scale bars are 200 μm. The hPSC-CFs are derived from DF19-9-11T hiPSCs. The hfV-CFs are from Cell Applications, Inc. The haV-CFs are from Lonza, NHCF-V, and hDFs are from 023a lineCC BY · PubMed Central
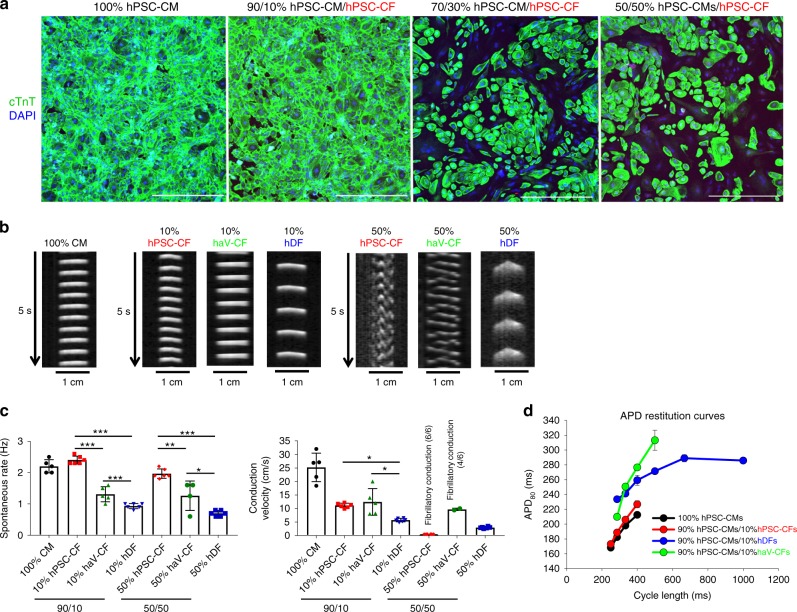
Fig. 10 Effect of CFs or DFs on hPSC-CM electrophysiology in co-culture. a confocal images of different ratios hPSC-CMs and hPSC-CFs in culture together with immunolabeling for cTnT to identify hPSC-CMs and DAPI labeling for all cells present. Scale bars are 500 µm. b Time–space plots of optical mapping experiments. Postacquisition analysis of optical recordings was done by plotting the changes of fluorescence over time along a single line of each monolayer, similar to a confocal line scan. Differences in the spontaneous rates of activation are evident as are altered patterns of conduction with fibrillatory conduction observed with 50% hPSC-CF and haV-CF co-cultures with hPSC-CM. c Average spontaneous beating rate and action potential propagation velocity for 100% hPSC-CM monolayers (n = 5) compared to co-cultures of percentages and cell types indicated (red, hPSC-CF 10% (n = 6) and 50% (n = 4); green, haV-CF 10% (n = 5) and 50% (n = 6); blue, hDF 10% (n = 6) and 50% (n = 6)). Statistical comparisons were made between different fibroblast populations at each fixed mixture with ANOVA and Tukey’s post hoc testing for significant differences as shown, ***P < 0.0001; **P < 0.001; and *P < 0.01. d Average action potential duration at 80% of repolarization (APD80) restitution curves generated by pacing indicated preparations over a range of different cycle lengths and measuring optical APD80. The hPSC-CF and hPSC-CMs are derived from H9-cTnT-GFP hESCs. The haV-CFs are from Lonza, NHCF-V, and hDFs are from skin biopsy from a healthy adult donor. Data are mean ± SEM with n representing number of separate monolayers (biological replicates) tested
Fig. 10 Effect of CFs or DFs on hPSC-CM electrophysiology in co-culture. a confocal images of different ratios hPSC-CMs and hPSC-CFs in culture together with immunolabeling for cTnT to identify hPSC-CMs and DAPI labeling for all cells present. Scale bars are 500 µm. b Time–space plots of optical mapping experiments. Postacquisition analysis of optical recordings was done by plotting the changes of fluorescence over time along a single line of each monolayer, similar to a confocal line scan. Differences in the spontaneous rates of activation are evident as are altered patterns of conduction with fibrillatory conduction observed with 50% hPSC-CF and haV-CF co-cultures with hPSC-CM. c Average spontaneous beating rate and action potential propagation velocity for 100% hPSC-CM monolayers (n = 5) compared to co-cultures of percentages and cell types indicated (red, hPSC-CF 10% (n = 6) and 50% (n = 4); green, haV-CF 10% (n = 5) and 50% (n = 6); blue, hDF 10% (n = 6) and 50% (n = 6)). Statistical comparisons were made between different fibroblast populations at each fixed mixture with ANOVA and Tukey’s post hoc testing for significant differences as shown, ***P < 0.0001; **P < 0.001; and *P < 0.01. d Average action potential duration at 80% of repolarization (APD80) restitution curves generated by pacing indicated preparations over a range of different cycle lengths and measuring optical APD80. The hPSC-CF and hPSC-CMs are derived from H9-cTnT-GFP hESCs. The haV-CFs are from Lonza, NHCF-V, and hDFs are from skin biopsy from a healthy adult donor. Data are mean ± SEM with n representing number of separate monolayers (biological replicates) testedCC BY · PubMed Central

Verification

Claims the paper makes

The claims and statistics of this paper haven’t been checked yet.

Run the check — free, no account needed. It reads the open-access text and checks the sources it cites.

A few free checks a day · papers already verified open instantly · results are public

Claims other papers make about this one

Each is checked against this paper’s own text: does it say what the citing paper says it does?

Self-check

Percentages, sums and reported differences re-computed from the paper’s own numbers.

The self-check needs the paper’s full text.

Citations

Cites

2 retracted

Show all 71 references

Cited by

Sorted by citations

See all 201

Metadata

Authors
Zhang, J., Tao, R., Campbell, K. F., Carvalho, J. L., Ruiz, E. C., Kim, G. C., Schmuck, E. G., Raval, A. N., da Rocha, A. M., Herron, T. J., Jalife, J., Thomson, J. A., & Kamp, T. J.
Affiliations
  • University of Wisconsin–Madison (US)
  • University of Michigan (US)
Corresponding author
  • Zhang, Jianhua
  • Kamp, Timothy J.
Venue
Nature Communications
Published
2019-05-20
Volume
10
Issue
1
Pages
2238-2238
ISSN
2041-1723 (ISSN-L)
OpenAlex
W2901646806
Cited by
201
References
71
Citations by year
2026: 15 · 2025: 32 · 2024: 27 · 2023: 29 · 2022: 30 · 2021: 34 · 2020: 26 · 2019: 8
FWCI
8.11
Type
journal article
Language
en
Open access
Locations
  • Nature Communications (publishedVersion, cc-by)
  • Europe PMC (PubMed Central) (publishedVersion, cc-by)
  • PubMed Central (publishedVersion, cc-by)
  • PubMed (publishedVersion)
  • LA Referencia (Red Federada de Repositorios Institucionales de Publicaciones Científicas) (submittedVersion, cc-by)
  • RePEc: Research Papers in Economics (submittedVersion)
  • DOAJ (DOAJ: Directory of Open Access Journals) (submittedVersion)
  • DOAJ (DOAJ: Directory of Open Access Journals) (submittedVersion, cc-by-sa)
Funders
  • Coordenação de Aperfeiçoamento de Pessoal de Nível Superior
  • National Institutes of Health (NIH-R01, UL1TR000427)
  • Institute for Clinical and Translational Research, University of Wisconsin, Madison (UL1TR000427)
  • National Heart, Lung, and Blood Institute (U01HL134764, R01HL129798)
  • National Center for Research Resources (S10RR025644)
  • National Center for Advancing Translational Sciences
Topics
  • Life Sciences › Biochemistry, Genetics and Molecular Biology › Molecular Biology › Pluripotent Stem Cells Research
  • Life Sciences › Biochemistry, Genetics and Molecular Biology › Molecular Biology › Congenital heart defects research
  • Life Sciences › Biochemistry, Genetics and Molecular Biology › Cell Biology › Mesenchymal stem cell research
Keywords
cardiac fibroblasts, human pluripotent stem cells, Wnt signaling, FGF signaling, myofibroblast transformation, TGF-β1, angiotensin II, extracellular matrix, cardiomyocyte electrophysiology, co-culture, cardiac regeneration, fibroblast differentiation
MeSH terms
Intravital Microscopy, Cell Differentiation, Cell Line, Fibroblasts, Heart, Humans, Microscopy, Fluorescence, Myocardium, Coculture Techniques, Dermis, Induced Pluripotent Stem Cells, Primary Cell Culture, Healthy Volunteers

About these checks

Registry, retraction, Cites and statistics results are computed, not judged, with one exception: a printed reference that no index lists is read once by a model before it counts as a citation error. Claims are extracted by a model and kept only when their quote appears verbatim in the text; each cited source is then checked, with a model’s help, for whether it says what the claim relies on. Those verdicts can be wrong — read the claim’s quote and the cited source before relying on one.

Statistics and arithmetic are recomputed, not judged.

Confidence bands are shown only for fields calibrated on our annotated test set. None is calibrated yet, so no band is shown.

What counts as a claim ›How we measure confidence ›How we check this ›

Are you an author, or do you see a problem with this page? Request a review