

The DOI matches its Crossref record; 13 of the 13 references it cites were found in a registry or an index.
Lysine/RNA-interactions drive and regulate biomolecular condensation
Abstract
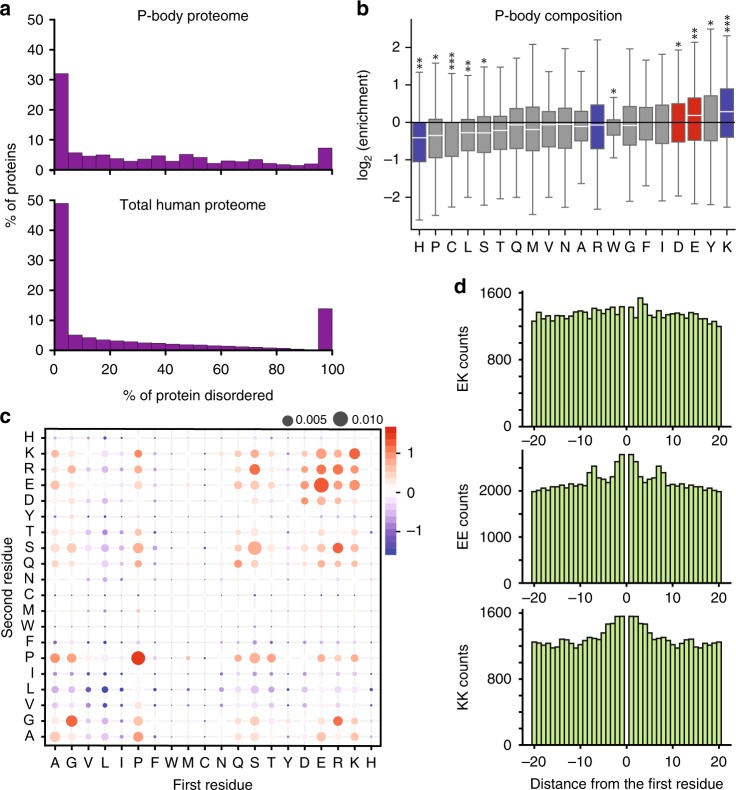
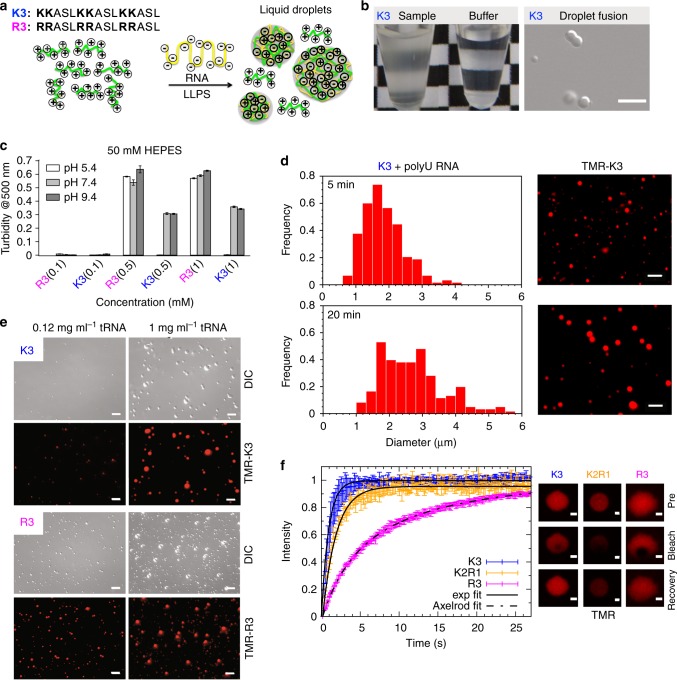
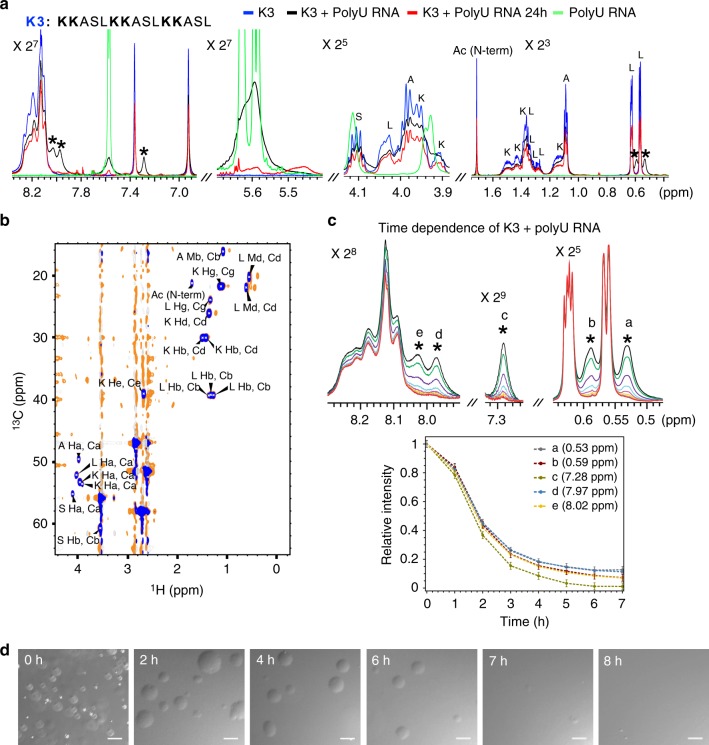
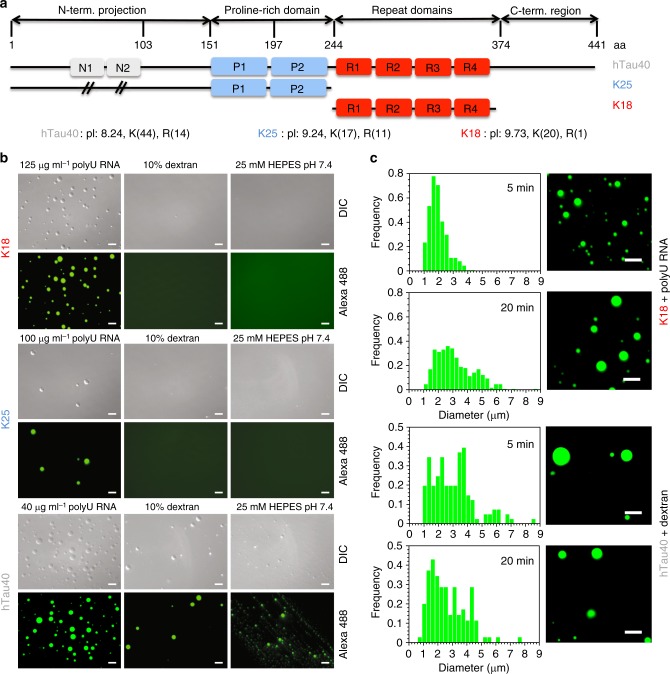
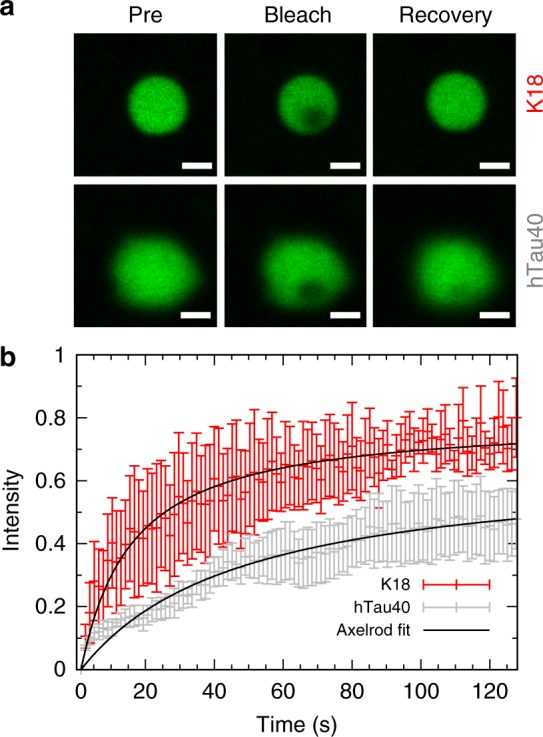
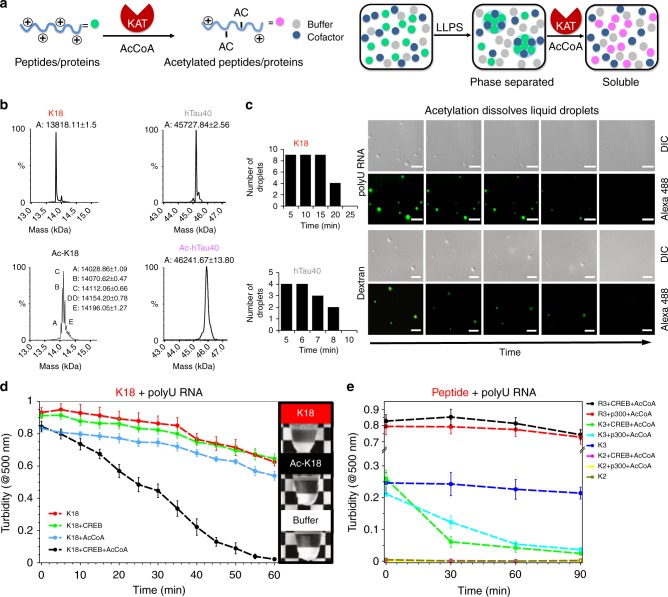
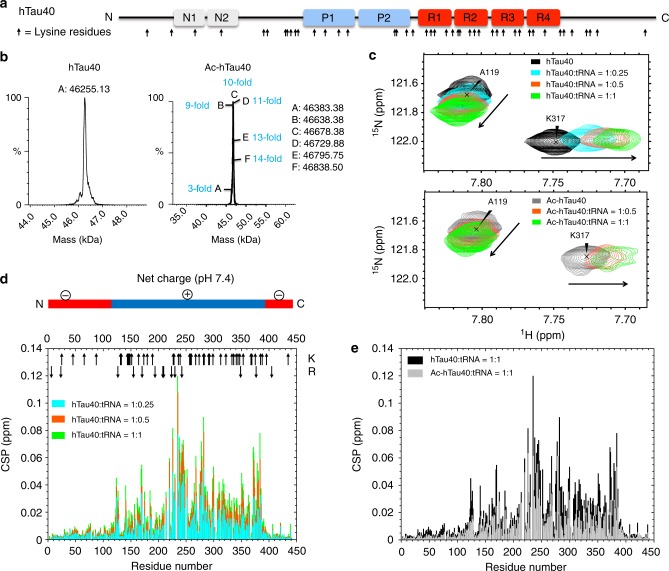
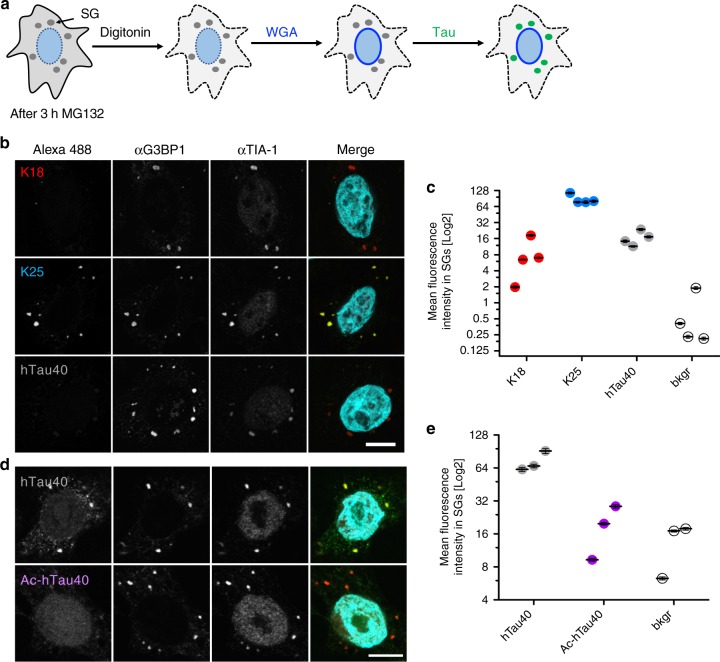
Cells form and use biomolecular condensates to execute biochemical reactions. The molecular properties of non-membrane-bound condensates are directly connected to the amino acid content of disordered protein regions. Lysine plays an important role in cellular function, but little is known about its role in biomolecular condensation. Here we show that protein disorder is abundant in protein/RNA granules and lysine is enriched in disordered regions of proteins in P-bodies compared to the entire human disordered proteome. Lysine-rich polypeptides phase separate into lysine/RNA-coacervates that are more dynamic and differ at the molecular level from arginine/RNA-coacervates. Consistent with the ability of lysine to drive phase separation, lysine-rich variants of the Alzheimer’s disease-linked protein tau undergo coacervation with RNA in vitro and bind to stress granules in cells. Acetylation of lysine reverses liquid–liquid phase separation and reduces colocalization of tau with stress granules. Our study establishes lysine as an important regulator of cellular condensation.
Overview
The claims and statistics of this paper haven’t been checked yet.
Run the check — free, no account needed. It reads the open-access text and checks the sources it cites.
Integrity signals
Registry
Cites
Statistics
Figures
Verification
Claims the paper makes
The claims and statistics of this paper haven’t been checked yet.
Run the check — free, no account needed. It reads the open-access text and checks the sources it cites.
Claims other papers make about this one
Each is checked against this paper’s own text: does it say what the citing paper says it does?
In the citing paper
“Notably, other Tau PTMs can also tune Tau coacervation, such as acetylation (Ferreon et al, 2018; Ukmar‐Godec et al, 2019)”
From Molecular crowding and RNA synergize to promote phase separation, microtubule interaction, and seeding of Tau condensates (2022) · cites this paper as Ukmar‐Godec et al, 2019
Self-check
Percentages, sums and reported differences re-computed from the paper’s own numbers.
The self-check needs the paper’s full text.
Citations
Cites
Fiji: an open-source platform for biological-image analysis
Schindelin, J., Arganda-Carreras, I., Frise, E., Kaynig, V., Longair, M., Pietzsch, T., Preibisch, S., Rueden, C., Saalfeld, S., Schmid, B., et al. (2012) · Nature Methods · doi:10.1038/nmeth.2019 · Cited by 66,890
Acetylation of Tau Inhibits Its Degradation and Contributes to Tauopathy
Min, S.-W., Cho, S.-H., Zhou, Y., Schroeder, S., Haroutunian, V., Seeley, W. W., Huang, E. J., Shen, Y., Masliah, E., Mukherjee, C., et al. (2010) · Neuron · doi:10.1016/j.neuron.2010.08.044 · Cited by 949
Ambadipudi, S., Biernat, J., Riedel, D., Mandelkow, E., & Zweckstetter, M. (2017) · Nature Communications · doi:10.1038/s41467-017-00480-0 · Cited by 782
Self-citationThe acetylation of tau inhibits its function and promotes pathological tau aggregation
Cohen, T. J., Guo, J. L., Hurtado, D. E., Kwong, L. K., Mills, I. P., Trojanowski, J. Q., & Lee, V. M. Y. (2011) · Nature Communications · doi:10.1038/ncomms1255 · Cited by 724
Domains of tau Protein and Interactions with Microtubules
Gustke, N., Trinczek, B., Biernat, J., Mandelkow, E.-M., & Mandelkow, E. (1994) · Biochemistry · doi:10.1021/bi00198a017 · Cited by 655
Self-citationStructural Polymorphism of 441-Residue Tau at Single Residue Resolution
Mukrasch, M. D., Bibow, S., Korukottu, J., Jeganathan, S., Biernat, J., Griesinger, C., Mandelkow, E., & Zweckstetter, M. (2009) · PLoS Biology · doi:10.1371/journal.pbio.1000034 · Cited by 652
Self-citationCritical role of acetylation in tau-mediated neurodegeneration and cognitive deficits
Min, S.-W., Chen, X., Tracy, T. E., Li, Y., Zhou, Y., Wang, C., Shirakawa, K., Minami, S. S., Defensor, E., Mok, S. A., et al. (2015) · Nature Medicine · doi:10.1038/nm.3951 · Cited by 516
Local Nucleation of Microtubule Bundles through Tubulin Concentration into a Condensed Tau Phase
Hernández-Vega, A., Braun, M., Scharrel, L., Jahnel, M., Wegmann, S., Hyman, B. T., Alberti, S., Diez, S., & Hyman, A. A. (2017) · Cell Reports · doi:10.1016/j.celrep.2017.08.042 · Cited by 395
Reducing the RNA binding protein TIA1 protects against tau-mediated neurodegeneration in vivo
Apicco, D. J., Ash, P. E. A., Maziuk, B., LeBlang, C., Medalla, M., Al Abdullatif, A., Ferragud, A., Botelho, E., Ballance, H. I., Dhawan, U., et al. (2018) · Nature Neuroscience · doi:10.1038/s41593-017-0022-z · Cited by 281
Tracy, T. E., Sohn, P. D., Minami, S. S., Wang, C., Min, S.-W., Li, Y., Zhou, Y., Le, D., Lo, I., Ponnusamy, R., et al. (2016) · Neuron · doi:10.1016/j.neuron.2016.03.005 · Cited by 277
Research works printed but not linked: 69
- Banani, S. F., Lee, H. O., Hyman, A. A. & Rosen, M. K. Biomolecular condensates: organizers of cellular biochemistry. Nat. Rev. Mol. Cell Biol. 18, 285–298 (2017). · DOI
- Brangwynne, C. P. et al. Germline P granules are liquid droplets that localize by controlled dissolution/condensation. Science 324, 1729–1732 (2009). · DOI
- Hyman, A. A., Weber, C. A. & Juelicher, F. Liquid-liquid phase separation in biology. Annu. Rev. Cell Dev. Biol. 30, 39–58 (2014). · DOI · Paper page
- Mittag, T. & Parker, R. Multiple modes of protein-protein interactions promote RNP granule assembly. J. Mol. Biol. 430, 4636–4649 (2018). · DOI
- Shin, Y. & Brangwynne, C. P. Liquid phase condensation in cell physiology and disease. Science 357, 1253 (2017). · DOI
- Brangwynne, C. P., Tompa, P. & Pappu, R. V. Polymer physics of intracellular phase transitions. Nat. Phys. 11, 899–904 (2015). · DOI
- Wang, J. et al. A molecular grammar governing the driving forces for phase separation of prion-like RNA binding proteins. Cell 174, 688–699 (2018). · DOI
- Molliex, A. et al. Phase separation by low complexity domains promotes stress granule assembly and drives pathological fibrillization. Cell 163, 123–133 (2015). · DOI · Paper page
- Li, H. R., Chiang, W. C., Chou, P. C., Wang, W. J. & Huang, J. R. TAR DNA-binding protein 43 (TDP-43) liquid-liquid phase separation is mediated by just a few aromatic residues. J. Biol. Chem. 293, 6090–6098 (2018). · DOI
- Chong, P. A., Vernon, R. M. & Forman-Kay, J. D. RGG/RG motif regions in RNA binding and phase separation. J. Mol. Biol. 430, 4650–4665 (2018). · DOI
- Boeynaems, S. et al. Spontaneous driving forces give rise to protein-RNA condensates with coexisting phases and complex material properties. Proc. Natl Acad. Sci. USA 116, 7889–7898 (2019). · DOI
- Aumiller, W. M. & Keating, C. D. Phosphorylation-mediated RNA/peptide complex coacervation as a model for intracellular liquid organelles. Nat. Chem. 8, 129–137 (2016). · DOI
- Langdon, E. M. et al. mRNA structure determines specificity of a polyQ-driven phase separation. Science 360, 922–927 (2018). · DOI
- Protter, D. S. W. & Parker, R. Principles and properties of stress granules. Trends Cell Biol. 26, 668–679 (2016). · DOI
- Li, P. L. et al. Phase transitions in the assembly of multivalent signalling proteins. Nature 483, 336–340 (2012). · DOI
- Han, T. N. W. et al. Cell-free formation of RNA granules: bound RNAs identify features and components of cellular assemblies. Cell 149, 768–779 (2012). · DOI
- Nott, T. J. et al. Phase transition of a disordered nuage protein generates environmentally responsive membraneless organelles. Mol. Cell 57, 936–947 (2015). · DOI · Paper page
- Hofweber, M. et al. Phase separation of FUS is suppressed by its nuclear import receptor and arginine methylation. Cell 173, 706–719 (2018). · DOI
- Ryan, V. H. et al. Mechanistic view of hnRNPA2 low-complexity domain structure, interactions, and phase separation altered by mutation and arginine methylation. Mol. Cell 69, 465–479 (2018). · DOI
- Qamar, S. et al. FUS phase separation is modulated by a molecular chaperone and methylation of arginine cation-π interactions. Cell 173, 720–734 (2018). · DOI
- Choudhary, C. et al. Lysine acetylation targets protein complexes and co-regulates major cellular functions. Science 325, 834–840 (2009). · DOI · Paper page
- Freiman, R. N. & Tjian, R. Regulating the regulators: lysine modifications make their mark. Cell 112, 11–17 (2003). · DOI
- Yang, X. J. & Seto, E. Lysine acetylation: codified crosstalk with other posttranslational modifications. Mol. Cell 31, 449–461 (2008). · DOI · Paper page
- Bancher, C., Braak, H., Fischer, P. & Jellinger, K. A. Neuropathological staging of Alzheimer lesions and intellectual status in Alzheimer’s and Parkinson’s disease patients. Neurosci. Lett. 162, 179–182 (1993). · DOI
- Cleveland, D. W., Hwo, S. Y. & Kirschner, M. W. Physical and chemical properties of purified tau factor and the role of tau in microtubule assembly. J. Mol. Biol. 116, 227–247 (1977). · DOI · Paper page
- Li, C. Z. & Gotz, J. Tau-based therapies in neurodegeneration: opportunities and challenges. Nat. Rev. Drug Discov. 16, 863–883 (2017). · DOI · Paper page
- Goedert, M., Spillantini, M. G., Jakes, R., Rutherford, D. & Crowther, R. A. Multiple isoforms of human microtubule-associated protein tau: sequences and localization in neurofibrillary tangles of Alzheimer’s disease. Neuron 3, 519–526 (1989). · DOI · Paper page
- Weingarten, M. D., Lockwood, A. H., Hwo, S. Y. & Kirschner, M. W. A protein factor essential for microtubule assembly. Proc. Natl Acad. Sci. USA 72, 1858–1862 (1975). · DOI · Paper page
- Cohen, T. J., Friedmann, D., Hwang, A. W., Marmorstein, R. & Lee, V. M. Y. The microtubule-associated tau protein has intrinsic acetyltransferase activity. Nat. Struct. Mol. Biol. 20, 756–762 (2013). · DOI · Paper page
- Zhang, X. M. et al. RNA stores tau reversibly in complex coacervates. PLoS Biol. 15, 1–28 (2017).
- Wegmann, S. et al. Tau protein liquid-liquid phase separation can initiate tau aggregation. EMBO J. 37, e98049 (2018). · DOI · Paper page
- Vanderweyde, T. et al. Contrasting pathology of the stress granule proteins TIA-1 and G3BP in tauopathies. J. Neurosci. 32, 8270–8283 (2012). · DOI
- Gan, L., Cookson, M. R., Petrucelli, L. & La Spade, A. R. Converging pathways in neurodegeneration, from genetics to mechanisms. Nat. Neurosci. 21, 1300–1309 (2018). · DOI
- Jain, S. et al. ATPase-modulated stress granules contain a diverse proteome and substructure. Cell 164, 487–498 (2016). · DOI
- Hubstenberger, A. et al. P-body purification reveals the condensation of repressed mRNA regulons. Mol. Cell 68, 144–157 (2017). · DOI
- Dosztanyi, Z., Csizmok, V., Tompa, P. & Simon, I. IUPred: web server for the prediction of intrinsically unstructured regions of proteins based on estimated energy content. Bioinformatics 21, 3433–3434 (2005). · DOI
- Axelrod, D., Koppel, D. E., Schlessinger, J., Elson, E. & Webb, W. W. Mobility measurement by analysis of fluorescence photobleaching recovery kinetics. Biophys. J. 16, 1055–1069 (1976). · DOI
- Kass, R. E. & Raftery, A. E. Bayes factors. J. Am. Stat. Assoc. 90, 773–795 (1995). · DOI · Paper page
- Conicella, A. E., Zerze, G. H., Mittal, J. & Fawzi, N. L. ALS mutations disrupt phase separation mediated by alpha-helical structure in the tdp-43 low-complexity C-terminal domain. Structure 24, 1537–1549 (2016). · DOI
- Mitrea, D. M. et al. Nucleophosmin integrates within the nucleolus via multi-modal interactions with proteins displaying R-rich linear motifs and rRNA. Elife 5, E13571 (2016). · DOI
- Albert, J. S. & Hamilton, A. D. Stabilization of helical domains in short peptides using hydrophobic interactions. Biochemistry 34, 984–990 (1995). · DOI
- Vijayakumar, M., Qian, H. & Zhou, H. X. Hydrogen bonds between short polar side chains and peptide backbone: Prevalence in proteins and effects on helix-forming propensities. Proteins-Struct. Funct. Genet. 34, 497–507 (1999). · DOI
- Vanderweyde, T. et al. Interaction of tau with the RNA-binding protein TIA1 regulates tau pathophysiology and toxicity. Cell Rep. 15, 1455–1466 (2016). · DOI · Paper page
- Brunello, C. A., Yan, X. & Huttunen, H. J. Internalized Tau sensitizes cells to stress by promoting formation and stability of stress granules. Sci. Rep. 6, 30498 (2016). · DOI
- Fitch, C. A., Platzer, G., Okon, M., Garcia-Moreno, B. E. & McIntosh, L. P. Arginine: Its pKa value revisited. Protein Sci. 24, 752–761 (2015). · DOI
- Gobbi, A. & Frenking, G. Y-conjugated compounds: the equilibrium geometries and electronic structures of guanidine, guanidinium cation, urea, and 1,1-diaminoethylene. J. Am. Chem. Soc. 115, 2362–2372 (1993). · DOI
- Pak, C. W. et al. Sequence determinants of intracellular phase separation by complex coacervation of a disordered protein. Mol. Cell 63, 72–85 (2016). · DOI
- Lee, K. H. et al. C9orf72 dipeptide repeats impair the assembly, dynamics, and function of membrane-less organelles. Cell 167, 774–788. e17 (2016). · DOI
- Boeynaems, S. et al. Phase separation of C9orf72 dipeptide repeats perturbs stress granule dynamics. Mol. Cell 65, 1044–1055 (2017). · DOI
- Burley, S. K. & Petsko, G. A. Weakly polar interactions in proteins. Adv. Protein Chem. 39, 125–189 (1988). · DOI
- Fromm, J. R., Hileman, R. E., Caldwell, E. E. O., Weiler, J. M. & Linhardt, R. J. Differences in the interaction of heparin with arginine and lysine and the importance of these basic amino acids in the binding of heparin to acidic fibroblast growth factor. Arch. Biochem. Biophys. 323, 279–287 (1995). · DOI
- Cotton, F. A. et al. Biochemical importance of the binding of phosphate by arginyl groups. Model compounds containing methylguanidinium ion. J. Am. Chem. Soc. 95, 2367–2369 (1973). · DOI
- Wei, M. T. et al. Phase behaviour of disordered proteins underlying low density and high permeability of liquid organelles. Nat. Chem. 9, 1118–1125 (2017). · DOI
- Leng, M. & Felsenfeld, G. The preferential interactions of polylysine and polyarginine with specific base sequences in DNA. Proc. Natl Acad. Sci. USA 56, 1325–1332 (1966). · DOI
- Tsuboi, M., Matsuo, K. & Ts’o, P. O. Interaction of poly-L-lysine and nucleic acids. J. Mol. Biol. 15, 256–267 (1966). · DOI
- Shapiro, J. T., Leng, M. & Felsenfeld, G. Deoxyribonucleic acid-polylysine complexes. Structure and nucleotide specificity. Biochemistry 8, 3219–3232 (1969). · DOI
- Porschke, D. The binding of Arg- and Lys-peptides to single stranded polyribonucleotides and its effect on the polymer conformation. Biophys. Chem. 10, 1–16 (1979). · DOI
- DeRouchey, J., Hoover, B. & Rau, D. C. A comparison of DNA compaction by arginine and lysine peptides: a physical basis for arginine rich protamines. Biochemistry 52, 3000–3009 (2013). · DOI
- Jedrusik-Bode, M. et al. The sirtuin SIRT6 regulates stress granule formation in C. elegans and mammals. J. Cell Sci. 126, 5166–5177 (2013). · DOI
- Kwon, S., Zhang, Y. & Matthias, P. The deacetylase HDAC6 is a novel critical component of stress granules involved in the stress response. Genes Dev. 21, 3381–3394 (2007). · DOI
- Cohen, T. J. et al. An acetylation switch controls TDP-43 function and aggregation propensity. Nat. Commun. 6, 5845 (2015). · DOI
- Saito, M. et al. Acetylation of intrinsically disordered regions regulates phase separation. Nat. Chem. Biol. 15, 51–61 (2019). · DOI
- Colombrita, C. et al. TDP-43 is recruited to stress granules in conditions of oxidative insult. J. Neurochem. 111, 1051–1061 (2009). · DOI
- Vatsavayai, S. C., Nana, A. L., Yokoyama, J. S. & Seeley, W. W. C9orf72-FTD/ALS pathogenesis: evidence from human neuropathological studies. Acta Neuropathol. 137, 1–26 (2019). · DOI
- Hershko, A. & Ciechanover, A. The ubiquitin system for protein-degradation. Ann. Rev. Biochem. 61, 761–807 (1992). · DOI
- Nostramo, R., Varia, S. N., Zhang, B., Emerson, M. M. & Herman, P. K. The catalytic activity of the Ubp3 deubiquitinating protease is required for efficient stress granule assembly in Saccharomyces cerevisiae. Mol. Cell Biol. 36, 173–183 (2016). · DOI
- Ghosh, J. K., Delampady, M. & Samanta, T. An Introduction to Bayesian Analysis: Theory and Methods. (Springer-Verlag, New York, 2006).
- Lee, W., Tonelli, M. & Markley, J. L. NMRFAM-SPARKY: enhanced software for biomolecular NMR spectroscopy. Bioinformatics 31, 1325–1327 (2015). · DOI
- Charneau, P. et al. HIV-1 reverse transcription -a termination step at the center of the genome. J. Mol. Biol. 241, 651–662 (1994). · DOI
Cited by
Liquid-liquid phase separation induces pathogenic tau conformations in vitro
Kanaan, N. M., Hamel, C., Grabinski, T., & Combs, B. (2020) · Nature Communications · doi:10.1038/s41467-020-16580-3 · Cited by 397
Prebiotic Peptides: Molecular Hubs in the Origin of Life
Frenkel-Pinter, M., Samanta, M., Ashkenasy, G., & Leman, L. J. (2020) · Chemical Reviews · doi:10.1021/acs.chemrev.9b00664 · Cited by 354
Hochmair, J., Exner, C., Franck, M., Dominguez‐Baquero, A., Diez, L., Brognaro, H., Kraushar, M. L., Mielke, T., Radbruch, H., Kaniyappan, S., et al. (2022) · The EMBO Journal · doi:10.15252/embj.2021108882 · Cited by 106
Self-citationAinani, H., Bouchmaa, N., Ben Mrid, R., & El Fatimy, R. (2023) · Neurobiology of Disease · doi:10.1016/j.nbd.2023.106011 · Cited by 54
Liquid − liquid phase separation of tau: Driving forces, regulation, and biological implications
Li, P., Chen, J., Wang, X., Su, Z., Gao, M., & Huang, Y. (2023) · Neurobiology of Disease · doi:10.1016/j.nbd.2023.106167 · Cited by 30
Tau liquid–liquid phase separation: At the crossroads of tau physiology and tauopathy
Islam, M., Shen, F., Regmi, D., Petersen, K., Karim, M. R. U., & Du, D. (2024) · Journal of Cellular Physiology · doi:10.1002/jcp.30853 · Cited by 28
Metadata
- Authors
- Ukmar-Godec, T., Hutten, S., Grieshop, M. P., Rezaei-Ghaleh, N., Cima-Omori, M.-S., Biernat, J., Mandelkow, E., Söding, J., Dormann, D., & Zweckstetter, M.
- Venue
- Nature Communications
- Published
- 2019-07-02
- Volume
- 10
- Issue
- 1
- ISSN
- 2041-1723
- PMC
- PMC6606616
- Cited by
- 261
- References
- 13
- Language
- en
About these checks
Registry, retraction, Cites and statistics results are computed, not judged, with one exception: a printed reference that no index lists is read once by a model before it counts as a citation error. Claims are extracted by a model and kept only when their quote appears verbatim in the text; each cited source is then checked, with a model’s help, for whether it says what the claim relies on. Those verdicts can be wrong — read the claim’s quote and the cited source before relying on one.
Statistics and arithmetic are recomputed, not judged.
Confidence bands are shown only for fields calibrated on our annotated test set. None is calibrated yet, so no band is shown.
What counts as a claim ›How we measure confidence ›How we check this ›
Are you an author, or do you see a problem with this page? Request a review
Data sources
Bibliographic data: Semantic Scholar, OpenAlex, Crossref.
Contains information from the Semantic Scholar Academic Graph Datasets, made available under the ODC Attribution License (ODC-BY 1.0).
Semantic Scholar’s data is described in: Kinney, R., et al. (2023). The Semantic Scholar Open Data Platform. arXiv:2301.10140.
