Student or educator? Sign up with your school email and get 6 months of Pro free.

The DOI matches its Crossref record; the references it cites are not checked yet.

Real-time decoding of question-and-answer speech dialogue using human cortical activity

Open access

Abstract

Natural communication often occurs in dialogue, differentially engaging auditory and sensorimotor brain regions during listening and speaking. However, previous attempts to decode speech directly from the human brain typically consider listening or speaking tasks in isolation. Here, human participants listened to questions and responded aloud with answers while we used high-density electrocorticography (ECoG) recordings to detect when they heard or said an utterance and to then decode the utterance’s identity. Because certain answers were only plausible responses to certain questions, we could dynamically update the prior probabilities of each answer using the decoded question likelihoods as context. We decode produced and perceived utterances with accuracy rates as high as 61% and 76%, respectively (chance is 7% and 20%). Contextual integration of decoded question likelihoods significantly improves answer decoding. These results demonstrate real-time decoding of speech in an interactive, conversational setting, which has important implications for patients who are unable to communicate.

Overview

The claims and statistics of this paper haven’t been checked yet.

Run the check — free, no account needed. It reads the open-access text and checks the sources it cites.

A few free checks a day · papers already verified open instantly · results are public

Integrity signals

Registry

Crossref · 10.1038/s41467-019-10994-4

Cites

Statistics

Figures

Fig. 1 Schematic of real-time speech decoding during a question (blue) and answer (red) task. a On each trial, participants hear a question and see a set of possible answer choices on a screen. b Participants are instructed to freely choose and verbally produce one of the answers when a green response cue appears on the screen. c Simultaneously, cortical activity is acquired from ECoG electrodes implanted across temporal and frontal cortex and then filtered in real-time to extract high gamma activity. d A speech detection model uses the spatiotemporal pattern of high gamma activity to predict whether a question is being heard or an answer is being produced (or neither) at each time point. e When the speech detection model detects a question event, that time window of high gamma activity is passed to a question classifier that uses phone-level Viterbi decoding to compute question utterance likelihoods. f The question with the highest likelihood is output as the decoded question. g To integrate questions and answers, the stimulus set was designed such that each answer was only likely for certain questions (context priors). h These context priors are combined with the predicted question likelihoods to obtain answer priors. i When the speech detection model detects an answer event, that time window of neural activity is passed to an answer classifier that uses phone-level Viterbi decoding to compute answer utterance likelihoods. j The context integration model combines these answer likelihoods with the answer priors to yield answer posterior probabilities (purple). k The answer with the highest posterior probability is output as the decoded answer. The answer choice icons shown in (a, b) were made by www.freepik.com from www.flaticon.com
Fig. 1 Schematic of real-time speech decoding during a question (blue) and answer (red) task. a On each trial, participants hear a question and see a set of possible answer choices on a screen. b Participants are instructed to freely choose and verbally produce one of the answers when a green response cue appears on the screen. c Simultaneously, cortical activity is acquired from ECoG electrodes implanted across temporal and frontal cortex and then filtered in real-time to extract high gamma activity. d A speech detection model uses the spatiotemporal pattern of high gamma activity to predict whether a question is being heard or an answer is being produced (or neither) at each time point. e When the speech detection model detects a question event, that time window of high gamma activity is passed to a question classifier that uses phone-level Viterbi decoding to compute question utterance likelihoods. f The question with the highest likelihood is output as the decoded question. g To integrate questions and answers, the stimulus set was designed such that each answer was only likely for certain questions (context priors). h These context priors are combined with the predicted question likelihoods to obtain answer priors. i When the speech detection model detects an answer event, that time window of neural activity is passed to an answer classifier that uses phone-level Viterbi decoding to compute answer utterance likelihoods. j The context integration model combines these answer likelihoods with the answer priors to yield answer posterior probabilities (purple). k The answer with the highest posterior probability is output as the decoded answer. The answer choice icons shown in (a, b) were made by www.freepik.com from www.flaticon.comCC BY · PubMed Central
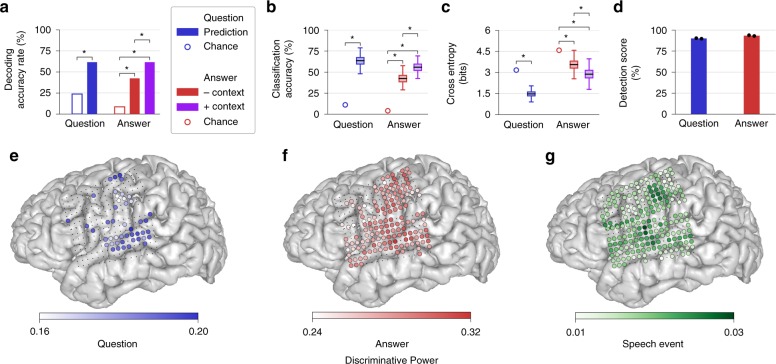
Fig. 2 Speech decoding and classification results for one participant. a Decoding accuracy rate, which measures the full performance of the system, is significantly above chance for questions and answers (without and with context; all *p < 0.05, 4-way Holm-Bonferroni correction). Answer decoding accuracy rate is significantly higher with context compared to without context. b Classification accuracy (the percent of correctly classified speech events, using true event times) mirrors decoding accuracy rate. (c) Cross entropy for utterance classification demonstrates similar patterns of better-than-chance performance and improvement with context (lower values indicate better performance). In (b, c), the values were computed by bootstrapping across trials. Each boxplot depicts a line marking the median value, box heights representing the interquartile range, and whiskers extending beyond the box edges by 1.5 times the interquartile range. d Event detection scores demonstrate near-ceiling performance of the speech detection model for both questions and answers. Black dots depict detection scores on individual test blocks. e–g MRI brain reconstructions with electrode locations and discriminative power for each electrode used by (e) question, (f) answer, and (g) speech event discriminative models. Electrodes that were not relevant are depicted as small black dots. See Supplementary Fig. 3 for other participants
Fig. 2 Speech decoding and classification results for one participant. a Decoding accuracy rate, which measures the full performance of the system, is significantly above chance for questions and answers (without and with context; all *p < 0.05, 4-way Holm-Bonferroni correction). Answer decoding accuracy rate is significantly higher with context compared to without context. b Classification accuracy (the percent of correctly classified speech events, using true event times) mirrors decoding accuracy rate. (c) Cross entropy for utterance classification demonstrates similar patterns of better-than-chance performance and improvement with context (lower values indicate better performance). In (b, c), the values were computed by bootstrapping across trials. Each boxplot depicts a line marking the median value, box heights representing the interquartile range, and whiskers extending beyond the box edges by 1.5 times the interquartile range. d Event detection scores demonstrate near-ceiling performance of the speech detection model for both questions and answers. Black dots depict detection scores on individual test blocks. e–g MRI brain reconstructions with electrode locations and discriminative power for each electrode used by (e) question, (f) answer, and (g) speech event discriminative models. Electrodes that were not relevant are depicted as small black dots. See Supplementary Fig. 3 for other participantsCC BY · PubMed Central
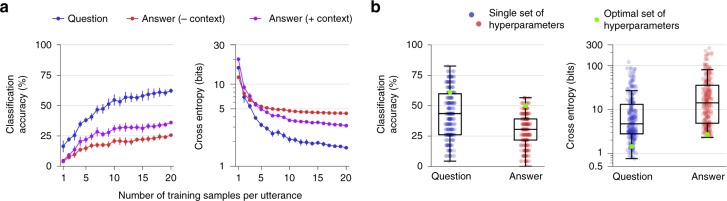
Fig. 3 Effects of amount of training data and hyperparameter optimization on speech classification for one participant. a Classification accuracy and cross entropy as a function of the amount of training data (mean ± s.e.m.). b Variability in classification performance across hyperparameter optimization epochs for one test block. Each boxplot depicts a line marking the median value, box heights representing the interquartile range, and whiskers extending beyond the box edges by 1.5 times the interquartile range. Each blue and red dot shows the performance on the test block using a single set of hyperparameters chosen for one epoch during optimization on a separate validation set. Each green dot marks the performance on the test block using the hyperparameters that minimized cross entropy on the validation set (the hyperparameter values used in the main results). See Supplementary Fig. 5 for other participants
Fig. 3 Effects of amount of training data and hyperparameter optimization on speech classification for one participant. a Classification accuracy and cross entropy as a function of the amount of training data (mean ± s.e.m.). b Variability in classification performance across hyperparameter optimization epochs for one test block. Each boxplot depicts a line marking the median value, box heights representing the interquartile range, and whiskers extending beyond the box edges by 1.5 times the interquartile range. Each blue and red dot shows the performance on the test block using a single set of hyperparameters chosen for one epoch during optimization on a separate validation set. Each green dot marks the performance on the test block using the hyperparameters that minimized cross entropy on the validation set (the hyperparameter values used in the main results). See Supplementary Fig. 5 for other participantsCC BY · PubMed Central
Fig. 4 Within-trial temporal characteristics and phone-based performance of the answer (speech production) classification models. a Viterbi path probabilities during production of the utterance “Fine” demonstrate how the classifier uses phone-level information to predict answers as speech unfolds over time. Each curve depicts the probability of an answer given the neural data at each time point. The probabilities at the final time point represent the answer likelihoods that are passed to the context integration model. Only the five most likely utterances are labeled and colored for visualization purposes. The time at which the correct utterance becomes more likely than the other utterances (and remains more likely throughout the remainder of the decoding window) is marked as the decision finalization time. b Decision finalization times for answer classification using neural data and the phonetic transcriptions across all participants and test blocks. Each red dot represents the decision finalization time for a correctly predicted trial (percent of the utterance relative to the actual speech onset and offset for that trial). Each boxplot depicts a line marking the median value, box heights representing the interquartile range, and whiskers extending beyond the box edges by 1.5 times the interquartile range. The observed finalization times typically occurred before speech offset (⋆p < 10−14, one-tailed single-sample Wilcoxon signed-rank test), indicating that the classifiers were able to predict the identity of an utterance before processing all time points in the neural (or phonetic) time window associated with an utterance. This characteristic is only partially explained by the stimuli and transcribed vocalizations (*p < 10−9, one-tailed Wilcoxon signed-rank test). c Phone confusion matrix using the answer phone likelihood model for every time point in each test block across all participants. Colored squares indicate phonetic classes organized by place of articulation. /sp/ is the silence phone. This matrix illustrates reliable discrimination between the majority of the phones and intuitive confusions within articulatory classes (e.g., /s/ vs. /z/)
Fig. 4 Within-trial temporal characteristics and phone-based performance of the answer (speech production) classification models. a Viterbi path probabilities during production of the utterance “Fine” demonstrate how the classifier uses phone-level information to predict answers as speech unfolds over time. Each curve depicts the probability of an answer given the neural data at each time point. The probabilities at the final time point represent the answer likelihoods that are passed to the context integration model. Only the five most likely utterances are labeled and colored for visualization purposes. The time at which the correct utterance becomes more likely than the other utterances (and remains more likely throughout the remainder of the decoding window) is marked as the decision finalization time. b Decision finalization times for answer classification using neural data and the phonetic transcriptions across all participants and test blocks. Each red dot represents the decision finalization time for a correctly predicted trial (percent of the utterance relative to the actual speech onset and offset for that trial). Each boxplot depicts a line marking the median value, box heights representing the interquartile range, and whiskers extending beyond the box edges by 1.5 times the interquartile range. The observed finalization times typically occurred before speech offset (⋆p < 10−14, one-tailed single-sample Wilcoxon signed-rank test), indicating that the classifiers were able to predict the identity of an utterance before processing all time points in the neural (or phonetic) time window associated with an utterance. This characteristic is only partially explained by the stimuli and transcribed vocalizations (*p < 10−9, one-tailed Wilcoxon signed-rank test). c Phone confusion matrix using the answer phone likelihood model for every time point in each test block across all participants. Colored squares indicate phonetic classes organized by place of articulation. /sp/ is the silence phone. This matrix illustrates reliable discrimination between the majority of the phones and intuitive confusions within articulatory classes (e.g., /s/ vs. /z/)CC BY · PubMed Central

Verification

Claims the paper makes

The claims and statistics of this paper haven’t been checked yet.

Run the check — free, no account needed. It reads the open-access text and checks the sources it cites.

A few free checks a day · papers already verified open instantly · results are public

Claims other papers make about this one

Each is checked against this paper’s own text: does it say what the citing paper says it does?

Self-check

Percentages, sums and reported differences re-computed from the paper’s own numbers.

The self-check needs the paper’s full text.

Citations

The citation lists are queued

They are fetched later and appear here then.

References 58 · Cited by 224

Research works printed but not linked: 2

  1. Thomas, C. & Joy, T. Elements of Information Theory, 2nd edn, (Wiley-Interscience, New York, NY, USA, 2006).
  2. Ledoit, O., Wolf, M. & Honey, I. Shrunk the sample covariance. Matrix J. Portf. Manag. 30, 110–119 (2004).

Metadata

Authors
Moses, D. A., Leonard, M. K., Makin, J. G., & Chang, E. F.
Affiliations
University of California, San Francisco (US)
Corresponding author
Chang, Edward F.
Venue
Nature Communications
Published
2019-07-30
Volume
10
Issue
1
Pages
3096-3096
ISSN
2041-1723 (ISSN-L)
OpenAlex
W2964982538
Cited by
224
References
58
Citations by year
2026: 16 · 2025: 30 · 2024: 29 · 2023: 30 · 2022: 41 · 2021: 42 · 2020: 29 · 2019: 7
FWCI
17.28
Type
journal article
Language
en
Open access
Licence
Locations
  • Nature Communications (publishedVersion, cc-by)
  • PubMed Central (publishedVersion, cc-by)
  • PubMed (publishedVersion)
  • RePEc: Research Papers in Economics (submittedVersion)
  • DOAJ (DOAJ: Directory of Open Access Journals) (submittedVersion, cc-by-sa)
  • DOAJ (DOAJ: Directory of Open Access Journals) (submittedVersion)
  • eScholarship (California Digital Library) (submittedVersion)
  • eScholarship (California Digital Library) (submittedVersion, cc-by)
Funders
  • Facebook
  • This work was funded by a research contract under Facebook’s Sponsored Academic Research Agreement.
Topics
  • Life Sciences › Neuroscience › Cognitive Neuroscience › EEG and Brain-Computer Interfaces
  • Life Sciences › Neuroscience › Cognitive Neuroscience › Neurobiology of Language and Bilingualism
  • Physical Sciences › Computer Science › Artificial Intelligence › Speech Recognition and Synthesis
Keywords
speech decoding, electrocorticography, question-answer dialogue, real-time neural decoding, contextual integration, Bayesian decoding, conversational speech, brain-computer interface
MeSH terms
Electrocorticography, Brain Mapping, Cerebral Cortex, Electrodes, Implanted, Epilepsy, Female, Humans, Speech, Time Factors, Brain-Computer Interfaces

About these checks

Registry, retraction, Cites and statistics results are computed, not judged, with one exception: a printed reference that no index lists is read once by a model before it counts as a citation error. Claims are extracted by a model and kept only when their quote appears verbatim in the text; each cited source is then checked, with a model’s help, for whether it says what the claim relies on. Those verdicts can be wrong — read the claim’s quote and the cited source before relying on one.

Statistics and arithmetic are recomputed, not judged.

Confidence bands are shown only for fields calibrated on our annotated test set. None is calibrated yet, so no band is shown.

What counts as a claim ›How we measure confidence ›How we check this ›

Are you an author, or do you see a problem with this page? Request a review

How to cite

Cite CoChat for the checks on this page, and the paper for its own findings.

This page
CoChat. (2026). Citation check: Real-time decoding of question-and-answer speech dialogue using human cortical activity. https://app.cochat.ai/papers/10.1038/s41467-019-10994-4
The paper
Moses, D. A., Leonard, M. K., Makin, J. G., & Chang, E. F. (2019). Real-time decoding of question-and-answer speech dialogue using human cortical activity. Nature Communications. https://doi.org/10.1038/s41467-019-10994-4

Data sources

Bibliographic data: Semantic Scholar, OpenAlex, Crossref.

Contains information from the Semantic Scholar Academic Graph Datasets, made available under the ODC Attribution License (ODC-BY 1.0).

Semantic Scholar’s data is described in: Kinney, R., et al. (2023). The Semantic Scholar Open Data Platform. arXiv:2301.10140.