Cited by 164

The DOI matches its Crossref record; 3 of the 3 references it cites were found in a registry or an index.

Lysosomal integral membrane protein-2 (LIMP-2/SCARB2) is involved in lysosomal cholesterol export

Heybrock, Saskia, Kanerva, Kristiina, Meng, Ying, Ing, Chris, Liang, Anna, Xiong, Zi-Jian, Weng, Xialian, Ah Kim, Young, Collins, Richard, Trimble, William, Pomès, Régis, Privé, Gilbert G., Annaert, Wim, Schwake, Michael, Heeren, Joerg, Lüllmann-Rauch, Renate, Grinstein, Sergio, Ikonen, Elina, Saftig, Paul, Neculai, Dante·2019·Nature Communications

Abstract

The intracellular transport of cholesterol is subject to tight regulation. The structure of the lysosomal integral membrane protein type 2 (LIMP-2, also known as SCARB2) reveals a large cavity that traverses the molecule and resembles the cavity in SR-B1 that mediates lipid transfer. The detection of cholesterol within the LIMP-2 structure and the formation of cholesterol − like inclusions in LIMP-2 knockout mice suggested the possibility that LIMP2 transports cholesterol in lysosomes. We present results of molecular modeling, crosslinking studies, microscale thermophoresis and cell-based assays that support a role of LIMP-2 in cholesterol transport. We show that the cavity in the luminal domain of LIMP-2 can bind and deliver exogenous cholesterol to the lysosomal membrane and later to lipid droplets. Depletion of LIMP-2 alters SREBP-2-mediated cholesterol regulation, as well as LDL-receptor levels. Our data indicate that LIMP-2 operates in parallel with Niemann Pick (NPC)-proteins, mediating a slower mode of lysosomal cholesterol export.

Overview

The claims and statistics of this paper haven’t been checked yet.

Run the check — free, no account needed. It reads the open-access text and checks the sources it cites.

A few free checks a day · papers already verified open instantly · results are public

Integrity signals

Registry

Crossref · 10.1038/s41467-019-11425-0

Cites

3 of 3 references verified0 citation errors · 0 not checkable

Statistics

Figures

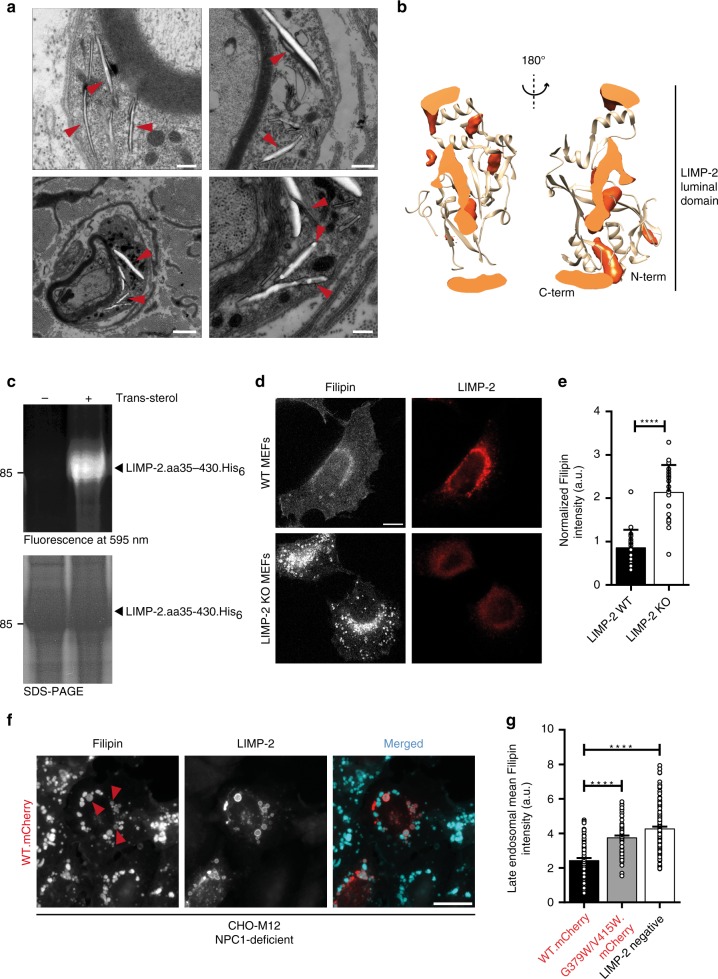
Fig. 1 Physical and functional interaction between LIMP-2 and cholesterol. a Electron microscopy revealed characteristic membrane-surrounded cholesterol-like inclusion bodies within the cytoplasm of Schwann cells of the Nervus phrenicus of a 6.5 month old (upper panel) and N. ichiadicus of a 6.5 month and 23 month old (lower panel) LIMP-2-deficient mouse. Scale bars: (upper panel left, lower panel right) 250 nm (upper panel right) 500 nm, (lower panel left) 1000 nm. b Spatial distribution function of cholesterol (orange) in the LIMP-2 extracellular domain (tan) computed from MDS, shown as a cross-section through an axial slice (lighter orange) of the structure. c Trans-sterol can be UV-crosslinked to the recombinant ectodomain (luminal part of LIMP-2 (aa35− aa430); +) whereas without the lipid (negative control; −) no crosslinking was observed. The lower panel shows the LIMP-2 protein after Coomassie staining. d Wildtype (WT) and LIMP-2-deficient (KO) mouse embryonic fibroblasts (MEFs) were grown for 16 h in lipoprotein-deficient medium and subsequently challenged for 6 h with LDL. Intracellular cholesterol was visualized with filipin. Lysosomes were stained with LIMP-2 in WT MEF cells. Scale bar: 10 μm. e Quantification of cellular filipin intensity from D (mean ± SD; LIMP-2-WT n = 25, LIMP-2-KO n = 22 cells from one experiment; ****P < 0.0001, t-test). f Wide-field fluorescence micrographs of filipin-stained NPC1-deficient CHO M12 cells overexpressing LIMP-2-WT-mCherry. Arrowheads indicate examples of filipin-positive LIMP-2-containing LEs. Note the decrease of filipin fluorescence in LIMP-2-WT-mCherry-containing LEs. Scale bar, 10 μm. g Quantification of mean filipin intensity in wild type (WT.mCherry), tunnel-blocking mutant form of LIMP-2 (G379W/V415W.mCherrry) and non-expressing (LIMP-2 neg.) LEs (n = 75, 77, 152 organelles, respectively, from in 15 cells). Data (mean ± SEM) from two independent experiments, unpaired two-tailed Student’s t-test (****P < 0.0001). Source data are provided as a Source Data file
Fig. 1 Physical and functional interaction between LIMP-2 and cholesterol. a Electron microscopy revealed characteristic membrane-surrounded cholesterol-like inclusion bodies within the cytoplasm of Schwann cells of the Nervus phrenicus of a 6.5 month old (upper panel) and N. ichiadicus of a 6.5 month and 23 month old (lower panel) LIMP-2-deficient mouse. Scale bars: (upper panel left, lower panel right) 250 nm (upper panel right) 500 nm, (lower panel left) 1000 nm. b Spatial distribution function of cholesterol (orange) in the LIMP-2 extracellular domain (tan) computed from MDS, shown as a cross-section through an axial slice (lighter orange) of the structure. c Trans-sterol can be UV-crosslinked to the recombinant ectodomain (luminal part of LIMP-2 (aa35− aa430); +) whereas without the lipid (negative control; −) no crosslinking was observed. The lower panel shows the LIMP-2 protein after Coomassie staining. d Wildtype (WT) and LIMP-2-deficient (KO) mouse embryonic fibroblasts (MEFs) were grown for 16 h in lipoprotein-deficient medium and subsequently challenged for 6 h with LDL. Intracellular cholesterol was visualized with filipin. Lysosomes were stained with LIMP-2 in WT MEF cells. Scale bar: 10 μm. e Quantification of cellular filipin intensity from D (mean ± SD; LIMP-2-WT n = 25, LIMP-2-KO n = 22 cells from one experiment; ****P < 0.0001, t-test). f Wide-field fluorescence micrographs of filipin-stained NPC1-deficient CHO M12 cells overexpressing LIMP-2-WT-mCherry. Arrowheads indicate examples of filipin-positive LIMP-2-containing LEs. Note the decrease of filipin fluorescence in LIMP-2-WT-mCherry-containing LEs. Scale bar, 10 μm. g Quantification of mean filipin intensity in wild type (WT.mCherry), tunnel-blocking mutant form of LIMP-2 (G379W/V415W.mCherrry) and non-expressing (LIMP-2 neg.) LEs (n = 75, 77, 152 organelles, respectively, from in 15 cells). Data (mean ± SEM) from two independent experiments, unpaired two-tailed Student’s t-test (****P < 0.0001). Source data are provided as a Source Data fileCC BY · PubMed Central
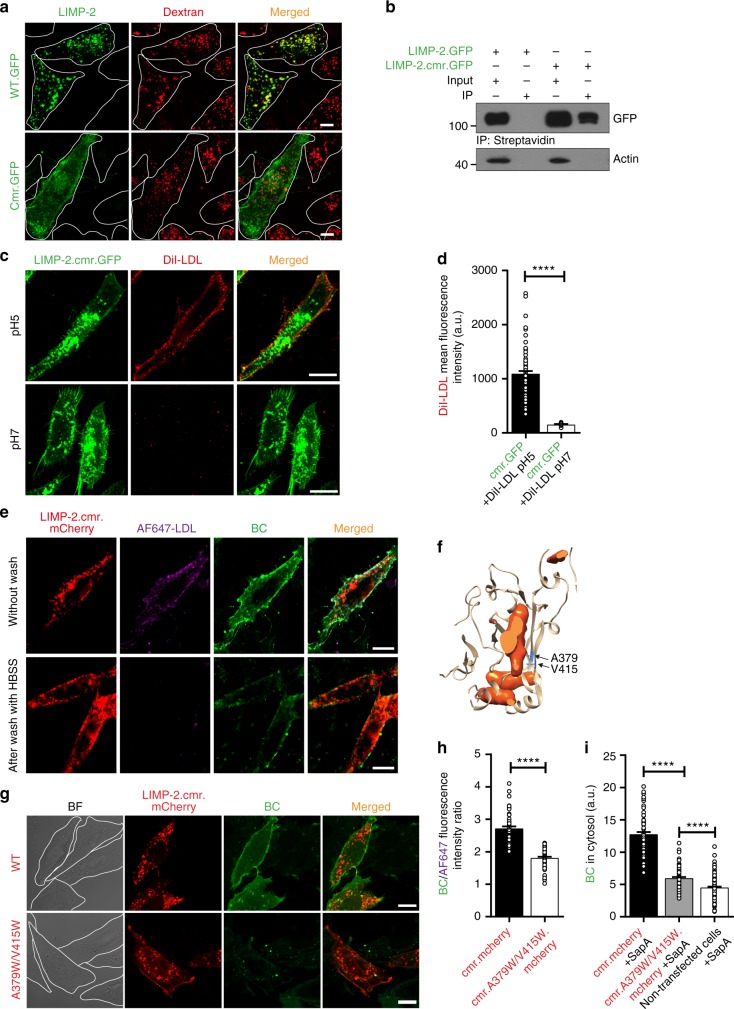
Fig. 2 Lipoprotein-derived cholesterol can translocate through the LIMP-2 ectodomain. a Confocal microscopy of HeLa cells transiently expressing C-terminally GFP-tagged wild-type (WT.GFP) or chimeric LIMP-2 (cmr.GFP). Cells were labeled with dextran to visualize late endosomal organelles. Cell boundaries are indicated by dotted lines. b Plasmalemmal expression of chimeric C-terminally GFP-tagged LIMP-2 (LIMP-2.cmr.GFP) in CHO cells was detected using Western blotting of biotinylated cell surface proteins after immunoprecipitation using streptavidin-beads. LIMP-2.GFP was used as a negative control. β-actin was used as a loading control for the input samples. c Confocal microscopy and quantification (d) of DiI-LDL binding to LIMP-2.cmr.GFP in CHO cells. Cells transiently expressing LIMP-2.cmr.GFP were incubated with DiI-LDL at pH 5 (upper panel) and pH 7 (lower panel). pH 5: n = 78, pH 7: n = 9 cells from two experiments. t-test (****P < 0.0001). e Confocal microscopy of CHO cells transiently expressing LIMP-2.cmr.mCherry and incubated with doubly labeled LDL, AF647-LDL(BC), after binding (upper panel) and washing with HBSS (lower panel). Note that AF647 was removed upon washing but BC was not. f Representation of the tunnel-blocking mutations of the human LIMP-2 luminal tunnel, shown as a slice through the body of the protein (sliced solid shown in orange). Residues A379 and V415, which point towards the cavity of the tunnel, are shown in blue. g, h Confocal microscopy (g) and quantification (h) of AF647-LDL(BC)-derived BC transport in CHO cells expressing LIMP-2.cmr.mCherry or LIMP-2.cmr.A379W/V415W.mCherrry proteins. Cells were pre-incubated with doubly labeled LDL (AF647-LDL(BC)) and washed with HBSS. The ratio of green (BC) over far-red (AF647-labeled LDL) fluorescence, measured in ZEN Lite (Zeiss), was used to estimate uptake (h); LIMP-2.cmr.mCherry n = 59, LIMP-2.cmr.A379W/V415W.mCherrry n = 50 cells from 3 experiments). i Quantification of BC uptake from SapA(BC) by CHO cells transiently expressing C-terminally mCherry-tagged-wild type (LIMP-2.cmr.mCherry) or tunnel-blocking mutant LIMP-2 chimera (LIMP-2.cmr.A379W/V415W.mCherrry). Also presented is the total fluorescence intensity of non-transfected cells. The total cellular fluorescence intensity of BC was measured using Volocity (LIMP-2.cmr.mCherry n = 67, LIMP-2.cmr.A379W/V415W.mCherrry n = 90, non-transfected cells n = 152 cells from 3 experiments). BC data in h, and i are the mean ± SEM of triplicate samples (****P < 0.0001, unpaired two-tailed Student’s t-test). a.u., arbitrary units. Scale bars, 10 μm. Source data are provided as a Source Data file
Fig. 2 Lipoprotein-derived cholesterol can translocate through the LIMP-2 ectodomain. a Confocal microscopy of HeLa cells transiently expressing C-terminally GFP-tagged wild-type (WT.GFP) or chimeric LIMP-2 (cmr.GFP). Cells were labeled with dextran to visualize late endosomal organelles. Cell boundaries are indicated by dotted lines. b Plasmalemmal expression of chimeric C-terminally GFP-tagged LIMP-2 (LIMP-2.cmr.GFP) in CHO cells was detected using Western blotting of biotinylated cell surface proteins after immunoprecipitation using streptavidin-beads. LIMP-2.GFP was used as a negative control. β-actin was used as a loading control for the input samples. c Confocal microscopy and quantification (d) of DiI-LDL binding to LIMP-2.cmr.GFP in CHO cells. Cells transiently expressing LIMP-2.cmr.GFP were incubated with DiI-LDL at pH 5 (upper panel) and pH 7 (lower panel). pH 5: n = 78, pH 7: n = 9 cells from two experiments. t-test (****P < 0.0001). e Confocal microscopy of CHO cells transiently expressing LIMP-2.cmr.mCherry and incubated with doubly labeled LDL, AF647-LDL(BC), after binding (upper panel) and washing with HBSS (lower panel). Note that AF647 was removed upon washing but BC was not. f Representation of the tunnel-blocking mutations of the human LIMP-2 luminal tunnel, shown as a slice through the body of the protein (sliced solid shown in orange). Residues A379 and V415, which point towards the cavity of the tunnel, are shown in blue. g, h Confocal microscopy (g) and quantification (h) of AF647-LDL(BC)-derived BC transport in CHO cells expressing LIMP-2.cmr.mCherry or LIMP-2.cmr.A379W/V415W.mCherrry proteins. Cells were pre-incubated with doubly labeled LDL (AF647-LDL(BC)) and washed with HBSS. The ratio of green (BC) over far-red (AF647-labeled LDL) fluorescence, measured in ZEN Lite (Zeiss), was used to estimate uptake (h); LIMP-2.cmr.mCherry n = 59, LIMP-2.cmr.A379W/V415W.mCherrry n = 50 cells from 3 experiments). i Quantification of BC uptake from SapA(BC) by CHO cells transiently expressing C-terminally mCherry-tagged-wild type (LIMP-2.cmr.mCherry) or tunnel-blocking mutant LIMP-2 chimera (LIMP-2.cmr.A379W/V415W.mCherrry). Also presented is the total fluorescence intensity of non-transfected cells. The total cellular fluorescence intensity of BC was measured using Volocity (LIMP-2.cmr.mCherry n = 67, LIMP-2.cmr.A379W/V415W.mCherrry n = 90, non-transfected cells n = 152 cells from 3 experiments). BC data in h, and i are the mean ± SEM of triplicate samples (****P < 0.0001, unpaired two-tailed Student’s t-test). a.u., arbitrary units. Scale bars, 10 μm. Source data are provided as a Source Data fileCC BY · PubMed Central
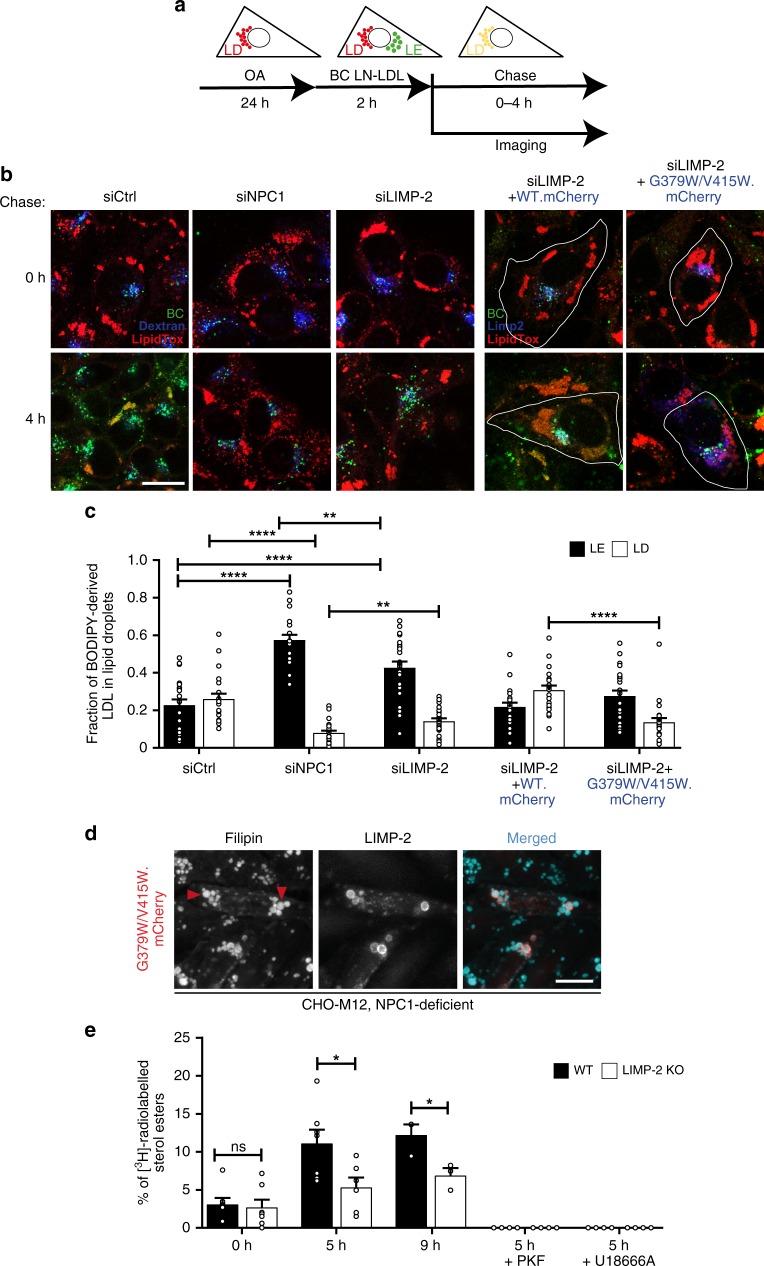
Fig. 3 LIMP-2-WT but not LIMP-2-G379W/V415W overexpression rescues cholesterol efflux from LEs in LIMP-2 deficient cells. a Principle of late endosomal BODIPY-cholesterol (BC) efflux assay in A431 cells. Cells are loaded for 24 h with oleic acid-conjugated BSA to generate lipid droplets (LD). In parallel, cells are labeled with dextran to visualize late endosomal organelles (LE). Cells are then labeled for 2 h with BODIPY cholesteryl linoleate-labeled LDL (BC LN-LDL) that enters LE, and chased in serum-free medium to monitor the transfer of BC from LE to LD (labeled with LipidTox during the last 30 min of BC-LN-LDL labeling). b Overlaid confocal images of BC (green), dextran/LIMP-2 (blue), and LipidTox (red) in live A431 cells transfected with the indicated siRNAs and/or cDNA constructs (LIMP-2-WT or LIMP-2-G379W/V415W overexpressing cells are outlined) at 0 h and 4 h of chase. Scale bar, 10 μm. c Quantification of the fraction of BC fluorescence residing in dextran-positive or LIMP-2-positive late endosomes (LE) vs. LipidTox-positive lipid droplets (LD) after 4 h of chase (n = 21 (siLIMP-2, siCtrl), 22 (siLIMP2 + WT.mCherry) or 23 (siNPC1, siLIMP-2 + G379W/V415W.mCherry) cells). Data (mean ± SEM) from 3 experiments, t-test (**P ≤ 0.01, ****P < 0.0001). d Wide-field fluorescence micrographs of filipin stained NPC1-deficient CHO M12 cells overexpressing LIMP-2-G379W/V415W-mCherry. Arrowheads indicate examples of filipin-positive LIMP-2-containing LEs. Scale bar, 10 μm. For quantification see 1 G. e Analysis of [3H]cholesterol incorporation into cholesteryl esters in LIMP-2-WT and LIMP-2-KO MEFs in the presence and absence of U18666A or PKF (n = 7 (0 h/5 h), n = 3 (9 h), n = 4 (PKF/U18666A) samples). Data (mean ± SEM) from two (9 h chase) to 3 experiments (5 h chase), unpaired two-tailed Student’s t-test (*P ≤ 0.05). Source data are provided as a Source Data file
Fig. 3 LIMP-2-WT but not LIMP-2-G379W/V415W overexpression rescues cholesterol efflux from LEs in LIMP-2 deficient cells. a Principle of late endosomal BODIPY-cholesterol (BC) efflux assay in A431 cells. Cells are loaded for 24 h with oleic acid-conjugated BSA to generate lipid droplets (LD). In parallel, cells are labeled with dextran to visualize late endosomal organelles (LE). Cells are then labeled for 2 h with BODIPY cholesteryl linoleate-labeled LDL (BC LN-LDL) that enters LE, and chased in serum-free medium to monitor the transfer of BC from LE to LD (labeled with LipidTox during the last 30 min of BC-LN-LDL labeling). b Overlaid confocal images of BC (green), dextran/LIMP-2 (blue), and LipidTox (red) in live A431 cells transfected with the indicated siRNAs and/or cDNA constructs (LIMP-2-WT or LIMP-2-G379W/V415W overexpressing cells are outlined) at 0 h and 4 h of chase. Scale bar, 10 μm. c Quantification of the fraction of BC fluorescence residing in dextran-positive or LIMP-2-positive late endosomes (LE) vs. LipidTox-positive lipid droplets (LD) after 4 h of chase (n = 21 (siLIMP-2, siCtrl), 22 (siLIMP2 + WT.mCherry) or 23 (siNPC1, siLIMP-2 + G379W/V415W.mCherry) cells). Data (mean ± SEM) from 3 experiments, t-test (**P ≤ 0.01, ****P < 0.0001). d Wide-field fluorescence micrographs of filipin stained NPC1-deficient CHO M12 cells overexpressing LIMP-2-G379W/V415W-mCherry. Arrowheads indicate examples of filipin-positive LIMP-2-containing LEs. Scale bar, 10 μm. For quantification see 1 G. e Analysis of [3H]cholesterol incorporation into cholesteryl esters in LIMP-2-WT and LIMP-2-KO MEFs in the presence and absence of U18666A or PKF (n = 7 (0 h/5 h), n = 3 (9 h), n = 4 (PKF/U18666A) samples). Data (mean ± SEM) from two (9 h chase) to 3 experiments (5 h chase), unpaired two-tailed Student’s t-test (*P ≤ 0.05). Source data are provided as a Source Data fileCC BY · PubMed Central
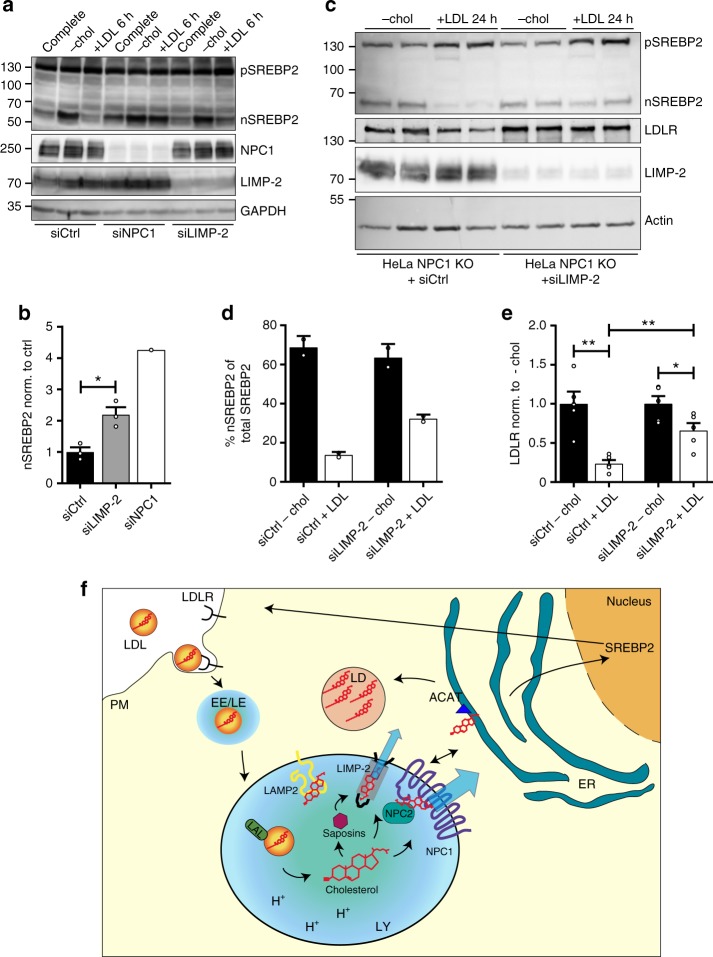
Fig. 4 Regulation of cholesterol homeostasis is altered in LIMP-2 deficient cells. Analysis of LIMP-2 influence on transcriptional regulation of cholesterol homeostatic genes. a Termination of SREBP2 processing in response to abundant cholesterol in the ER (induced by LDL loading) is absent or incomplete in NPC1-silenced and LIMP-2-silenced HeLa cells, respectively. HeLa WT cells were treated with scrambled (ctrl), NPC1 or LIMP-2 siRNA, respectively, and incubated in either full medium, cholesterol-depleted medium or LDL-loaded medium. The processing of SREBP2 in response to high or low cholesterol levels was analyzed by immunoblot. b The quantification depicts the amount of nSREBP2 after LDL loading in cells treated with scrambled (ctrl), NPC1 or LIMP-2 siRNA, respectively (n = 3; data (mean ± SEM) from two experiments; *P ≤ 0.05, t-test). c Analysis of the effect of cholesterol depletion and re-addition of LDL cholesterol for 24 h in NPC1-deficient HeLa cells on nSREBP2 formation. Cells were either treated with control siRNA or with LIMP-2 specific siRNA. The processing of the SREBP2, as well as the expression of the LDL receptor (LDLR) and LIMP-2 was followed by immunoblot. Note that additional depletion of LIMP-2 led to incomplete termination of nSREBP2 fragment and LDLR formation after cholesterol loading for 24 h. d Quantification of nSREBP2 levels. Nuclear SREBP2 fragment as percentage of total SREBP2 is depicted. (n = 2; data (mean ± SD) from one experiment). e Quantification of LDLR levels after cholesterol loading, normalized to the cholesterol-depleted samples (n = 5; data (mean ± SEM) from two experiments; *P ≤ 0.05, **P ≤ 0.01, unpaired two-tailed Student’s t-test). f Model of the role of LIMP-2 in lysosomal cholesterol efflux. Source data are provided as a Source Data file
Fig. 4 Regulation of cholesterol homeostasis is altered in LIMP-2 deficient cells. Analysis of LIMP-2 influence on transcriptional regulation of cholesterol homeostatic genes. a Termination of SREBP2 processing in response to abundant cholesterol in the ER (induced by LDL loading) is absent or incomplete in NPC1-silenced and LIMP-2-silenced HeLa cells, respectively. HeLa WT cells were treated with scrambled (ctrl), NPC1 or LIMP-2 siRNA, respectively, and incubated in either full medium, cholesterol-depleted medium or LDL-loaded medium. The processing of SREBP2 in response to high or low cholesterol levels was analyzed by immunoblot. b The quantification depicts the amount of nSREBP2 after LDL loading in cells treated with scrambled (ctrl), NPC1 or LIMP-2 siRNA, respectively (n = 3; data (mean ± SEM) from two experiments; *P ≤ 0.05, t-test). c Analysis of the effect of cholesterol depletion and re-addition of LDL cholesterol for 24 h in NPC1-deficient HeLa cells on nSREBP2 formation. Cells were either treated with control siRNA or with LIMP-2 specific siRNA. The processing of the SREBP2, as well as the expression of the LDL receptor (LDLR) and LIMP-2 was followed by immunoblot. Note that additional depletion of LIMP-2 led to incomplete termination of nSREBP2 fragment and LDLR formation after cholesterol loading for 24 h. d Quantification of nSREBP2 levels. Nuclear SREBP2 fragment as percentage of total SREBP2 is depicted. (n = 2; data (mean ± SD) from one experiment). e Quantification of LDLR levels after cholesterol loading, normalized to the cholesterol-depleted samples (n = 5; data (mean ± SEM) from two experiments; *P ≤ 0.05, **P ≤ 0.01, unpaired two-tailed Student’s t-test). f Model of the role of LIMP-2 in lysosomal cholesterol efflux. Source data are provided as a Source Data fileCC BY · PubMed Central

Verification

Claims the paper makes

The claims and statistics of this paper haven’t been checked yet.

Run the check — free, no account needed. It reads the open-access text and checks the sources it cites.

A few free checks a day · papers already verified open instantly · results are public

Claims other papers make about this one

Each is checked against this paper’s own text: does it say what the citing paper says it does?

Self-check

Percentages, sums and reported differences re-computed from the paper’s own numbers.

The self-check needs the paper’s full text.

Citations

Cites

Show all 3 references

Research works printed but not linked: 52

  1. Brown, M. S., Radhakrishnan, A. & Goldstein, J. L. Retrospective on cholesterol homeostasis: the central role of scap. Annu. Rev. Biochem. https://doi.org/10.1146/annurev-biochem-062917-011852 (2017). · DOI · Paper page
  2. Thelen, A. M. & Zoncu, R. Emerging roles for the lysosome in lipid metabolism. Trends Cell Biol. 27, 833–850 (2017). · DOI
  3. Maxfield, F. R., Iaea, D. B. & Pipalia, N. H. Role of STARD4 and NPC1 in intracellular sterol transport. Biochem Cell Biol. 94, 499–506 (2016). · DOI
  4. Ikonen, E. Cellular cholesterol trafficking and compartmentalization. Nat. Rev. Mol. Cell Biol. 9, 125–138 (2008). · DOI
  5. Ikonen, E. Mechanisms for cellular cholesterol transport: defects and human disease. Physiol. Rev. 86, 1237–1261 (2006). · DOI · Paper page
  6. Kolter, T. & Sandhoff, K. Principles of lysosomal membrane digestion: stimulation of sphingolipid degradation by sphingolipid activator proteins and anionic lysosomal lipids. Annu Rev. Cell Dev. Biol. 21, 81–103 (2005). · DOI · Paper page
  7. Luo, J., Jiang, L., Yang, H. & Song, B. L. Routes and mechanisms of post-endosomal cholesterol trafficking: A story that never ends. Traffic 18, 209–217 (2017). · DOI
  8. Sturley, S. L., Patterson, M. C., Balch, W. & Liscum, L. The pathophysiology and mechanisms of NP-C disease. Biochim Biophys. Acta 1685, 83–87 (2004). · DOI
  9. Li, J. & Pfeffer, S. R. Lysosomal membrane glycoproteins bind cholesterol and contribute to lysosomal cholesterol export. Elife 5, https://doi.org/10.7554/eLife.21635 (2016). · DOI · Paper page
  10. Schneede, A. et al. Role for LAMP-2 in endosomal cholesterol transport. J. Cell Mol. Med 15, 280–295 (2011). · DOI
  11. Conrad, K. S. et al. Lysosomal integral membrane protein-2 as a phospholipid receptor revealed by biophysical and cellular studies. Nat. Commun. 8, 1908 (2017). · DOI
  12. Yamayoshi, S. et al. Scavenger receptor B2 is a cellular receptor for enterovirus 71. Nat. Med. 15, 798–801 (2009). · DOI
  13. Reczek, D. et al. LIMP-2 is a receptor for lysosomal mannose-6-phosphate-independent targeting of beta-glucocerebrosidase. Cell 131, 770–783 (2007). · DOI
  14. Neculai, D. et al. Structure of LIMP-2 provides functional insights with implications for SR-BI and CD36. Nature 504, 172–176 (2013). · DOI
  15. Zunke, F. et al. Characterization of the complex formed by beta-glucocerebrosidase and the lysosomal integral membrane protein type-2. Proc. Natl Acad. Sci. USA 113, 3791–3796 (2016). · DOI
  16. Gomez-Diaz, C. et al. A CD36 ectodomain mediates insect pheromone detection via a putative tunnelling mechanism. Nat. Commun. 7, 11866 (2016). · DOI
  17. Gamp, A. C. et al. LIMP-2/LGP85 deficiency causes ureteric pelvic junction obstruction, deafness and peripheral neuropathy in mice. Hum. Mol. Genet 12, 631–646 (2003). · DOI
  18. Klinkner, A. M., Waites, C. R., Kerns, W. D. & Bugelski, P. J. Evidence of foam cell and cholesterol crystal formation in macrophages incubated with oxidized LDL by fluorescence and electron microscopy. J. Histochem. Cytochem. 43, 1071–1078 (1995). · DOI
  19. Widenmaier, S. B. et al. NRF1 is an ER membrane sensor that is central to cholesterol homeostasis. Cell 171, 1094 (2017). · DOI
  20. Millard, E. E., Srivastava, K., Traub, L. M., Schaffer, J. E. & Ory, D. S. Niemann-pick type C1 (NPC1) overexpression alters cellular cholesterol homeostasis. J. Biol. Chem. 275, 38445–38451 (2000). · DOI
  21. de Kruijff, B. & Demel, R. A. Polyene antibiotic-sterol interactions in membranes of Acholeplasma laidlawii cells and lecithin liposomes. 3. Molecular structure of the polyene antibiotic-cholesterol complexes. Biochim. Biophys. Acta 339, 57–70 (1974). · DOI
  22. Popovic, K., Holyoake, J., Pomes, R. & Prive, G. G. Structure of saposin A lipoprotein discs. Proc. Natl Acad. Sci. USA 109, 2908–2912 (2012). · DOI
  23. Welte, M. A. Expanding roles for lipid droplets. Curr. Biol. 25, R470–R481 (2015). · DOI
  24. Holtta-Vuori, M., Sezgin, E., Eggeling, C. & Ikonen, E. Use of BODIPY-cholesterol (TF-Chol) for visualizing lysosomal cholesterol accumulation. Traffic 17, 1054–1057 (2016). · DOI
  25. Pfisterer, S. G. et al. Role for formin-like 1-dependent acto-myosin assembly in lipid droplet dynamics and lipid storage. Nat. Commun. 8, 14858 (2017). · DOI
  26. Kanerva, K. et al. LDL cholesterol recycles to the plasma membrane via a Rab8a-Myosin5b-actin-dependent membrane transport route. Dev. Cell 27, 249–262 (2013). · DOI
  27. Brown, M. S. & Goldstein, J. L. The SREBP pathway: regulation of cholesterol metabolism by proteolysis of a membrane-bound transcription factor. Cell 89, 331–340 (1997). · DOI · Paper page
  28. Chu, B. B. et al. Cholesterol transport through lysosome-peroxisome membrane contacts. Cell 161, 291–306 (2015). · DOI · Paper page
  29. Schulze, H. & Sandhoff, K. Biochim. et. Biophys. Acta (BBA)-Mol. Cell Biol. Lipids 1841, 799–810 (2014).
  30. Blom, T. et al. in Nature Chemical Biology Vol. 11, 799–806 (2015). · DOI
  31. Rodrigueza, W. V. et al. Mechanism of scavenger receptor class B type I-mediated selective uptake of cholesteryl esters from high density lipoprotein to adrenal cells. J. Biol. Chem. 274, 20344–20350 (1999). · DOI
  32. Marques, A. R. et al. Glucosylated cholesterol in mammalian cells and tissues: formation and degradation by multiple cellular beta-glucosidases. J. Lipid Res. 57, 451–463 (2016). · DOI
  33. Goldstein, J. L., Basu, S. K. & Brown, M. S. Receptor-mediated endocytosis of low-density lipoprotein in cultured cells. Methods Enzym. 98, 241–260 (1983). · DOI
  34. Holtta-Vuori, M., Salo, V. T., Ohsaki, Y., Suster, M. L. & Ikonen, E. Alleviation of seipinopathy-related ER stress by triglyceride storage. Hum. Mol. Genet 22, 1157–1166 (2013). · DOI
  35. Tharkeshwar, A. K. et al. A novel approach to analyze lysosomal dysfunctions through subcellular proteomics and lipidomics: the case of NPC1 deficiency. Sci. Rep. 7, 41408 (2017). · DOI
  36. Li, Z., Michael, I. P., Zhou, D., Nagy, A. & Rini, J. M. Simple piggyBac transposon-based mammalian cell expression system for inducible protein production. Proc. Natl Acad. Sci. USA 110, 5004–5009 (2013). · DOI
  37. Kook, S. et al. Impaired lysosomal integral membrane protein 2-dependent peroxiredoxin 6 delivery to lamellar bodies accounts for altered alveolar phospholipid content in adaptor protein-3-deficient pearl Mice. J. Biol. Chem. 291, 8414–8427 (2016). · DOI
  38. Blom, T., Li, Z., Bittman, R., Somerharju, P. & Ikonen, E. Tracking sphingosine metabolism and transport in sphingolipidoses: NPC1 deficiency as a test case. Traffic 13, 1234–1243 (2012). · DOI
  39. Saliba, A. E. et al. A quantitative liposome microarray to systematically characterize protein-lipid interactions. Nat. Methods 11, 47–50 (2014). · DOI
  40. Leney, A. C. et al. Picodiscs for facile protein-glycolipid interaction analysis. Anal. Chem. 87, 4402–4408 (2015). · DOI
  41. Sali, A. & Blundell, T. L. Comparative protein modeling by satisfaction of spatial restraints. J. Mol. Biol. 234, 779–815 (1993). · DOI · Paper page
  42. Best, R. B. et al. Optimization of the additive CHARMM all-atom protein force field targeting improved sampling of the backbone ϕ, ψ and side-chain χ1 and χ2 dihedral angles. J. Chem. Theory Comput. 8, 3257–3273 (2012). · DOI
  43. Jorgensen, W. L., Chandrasekhar, J., Madura, J. D., Impey, R. W. & Klein, M. L. Comparison of simple potential functions for simulating liquid water. J. Chem. Phys. 79, 926–935 (1983). · DOI
  44. Pronk, S. et al. GROMACS 4.5: a high-throughput and highly parallel open source molecular simulation toolkit. Bioinformatics 29, 845–854 (2013). · DOI
  45. Nosé, S. A molecular dynamics method for simulations in the canonical ensemble. Mol. Phys. 52, 255–268 (1984). · DOI
  46. Hoover, W. G. Canonical dynamics: equilibrium phase-space distributions. Phys. Rev. A 31, 1695 (1985). · DOI
  47. Nosé, S. & Klein, M. L. Constant pressure molecular dynamics for molecular systems. Mol. Phys. 50, 1055–1076 (1983). · DOI
  48. Parrinello, M. & Rahman, A. Polymorphic transitions in single-crystals-a new molecular-dynamics method. J. Appl. Phys. 52, 7182–7190 (1981). · DOI
  49. Miyamoto, S. & Kollman, P. A. SETTLE: An analytical version of the SHAKE and RATTLE algorithm. J. Comput. Chem. 13, 952–962 (1992). · DOI
  50. Hess, B. P-LINCS: a parallel linear constraint solver for molecular simulation. J. Chem. Theory Comput 4, 116–122 (2008). · DOI
  51. Humphrey, W., Dalke, A. & Schulten, K. VMD: visual molecular dynamics. J. Mol. Graph 14, 27–38 (1996). · DOI · Paper page
  52. Pettersen, E. F. et al. UCSF Chimera–a visualization system for exploratory research and analysis. J. Comput Chem. 25, 1605–1612 (2004). · DOI

Cited by

Sorted by citations

Metadata

Authors
Heybrock, S., Kanerva, K., Meng, Y., Ing, C., Liang, A., Xiong, Z.-J., Weng, X., Ah Kim, Y., Collins, R., Trimble, W., Pomès, R., Privé, G. G., Annaert, W., Schwake, M., Heeren, J., Lüllmann-Rauch, R., Grinstein, S., Ikonen, E., Saftig, P., & Neculai, D.
Venue
Nature Communications
Published
2019-08-06
Volume
10
Issue
1
ISSN
2041-1723
Cited by
164
References
3
Language
en
Funders
  • Deutsche Forschungsgemeinschaft (GRK1459, FOR2625)
  • Academy of Finland (282192)
  • Key Program of Zhejiang Provincial Natural Science Foundation of China, Finnish Cultural Foundation, Häme Regional Fund and University of Helsinki, Canadian Institutes of Health Research, VIB, FWO

About these checks

Registry, retraction, Cites and statistics results are computed, not judged, with one exception: a printed reference that no index lists is read once by a model before it counts as a citation error. Claims are extracted by a model and kept only when their quote appears verbatim in the text; each cited source is then checked, with a model’s help, for whether it says what the claim relies on. Those verdicts can be wrong — read the claim’s quote and the cited source before relying on one.

Statistics and arithmetic are recomputed, not judged.

Confidence bands are shown only for fields calibrated on our annotated test set. None is calibrated yet, so no band is shown.

What counts as a claim ›How we measure confidence ›How we check this ›

Are you an author, or do you see a problem with this page? Request a review