Cited by 111Lung Cancer Treatments and MutationsProtein Kinase Regulation and GTPase SignalingGenomics, phytochemicals, and oxidative stress

The DOI matches its Crossref record; 73 of the 73 references it cites were found in a registry or an index.

Distinct initiating events underpin the immune and metabolic heterogeneity of KRAS-mutant lung adenocarcinoma

Open access

Abstract

The KRAS oncoprotein, a critical driver in 33% of lung adenocarcinoma (LUAD), has remained an elusive clinical target due to its perceived undruggable nature. The identification of dependencies borne through common co-occurring mutations are sought to more effectively target KRAS-mutant lung cancer. Approximately 20% of KRAS-mutant LUAD carry loss-of-function mutations in KEAP1, a negative regulator of the antioxidant response transcription factor NFE2L2/NRF2. We demonstrate that Keap1-deficient KrasG12D lung tumors arise from a bronchiolar cell-of-origin, lacking pro-tumorigenic macrophages observed in tumors originating from alveolar cells.Keap1 loss activates the pentose phosphate pathway, inhibition of which, using 6-AN, abrogated tumor growth. These studies highlight alternative therapeutic approaches to specifically target this unique subset of KRAS-mutant LUAD cancers.

Overview

The claims and statistics of this paper haven’t been checked yet.

Run the check — free, no account needed. It reads the open-access text and checks the sources it cites.

A few free checks a day · papers already verified open instantly · results are public

Integrity signals

Registry

Crossref · 10.1038/s41467-019-12164-y

Cites

73 of 73 references verified0 citation errors · 0 not checkable

Statistics

Figures

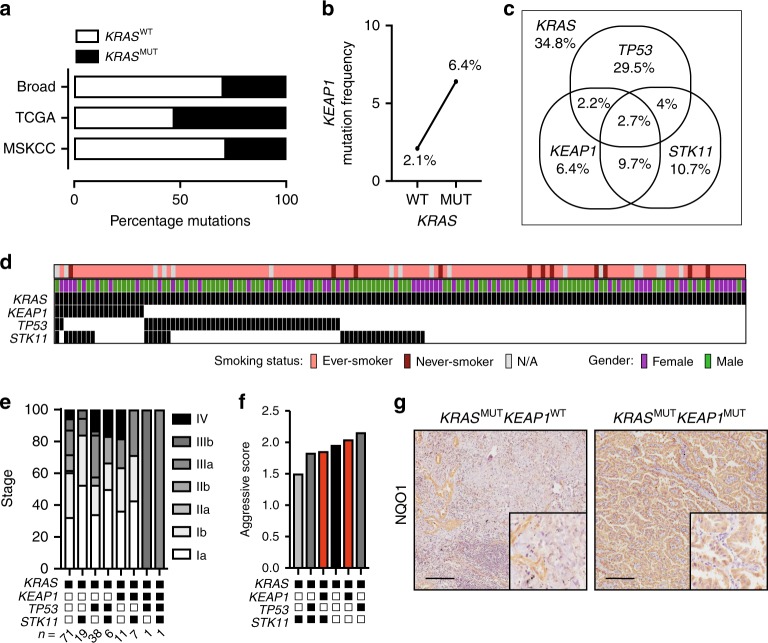
Fig. 1 KEAP1 mutation is enriched in KRAS-mutant lung adenocarcinoma. a Frequency of KRAS mutation in lung adenocarcinoma (LUAD) obtained from the Broad Institute (n = 182), The Cancer Genome Atlas (n = 313) and the Memorial Sloan Kettering Cancer Center (MSKCC) (n = 864). b Frequency of KEAP1 mutation status in KRAS WT (wild type; n = 921) or MUT (mutant; n = 627) LUAD samples. c Venn Diagram of co-mutation/mutual exclusivity of KEAP1, TP53, and STK11 mutations in the subset of KRAS-mutant LUAD (n = 627). d KEAP1, TP53, and STK11 mutation status in KRAS-mutant LUAD patient samples from the Clinical Lung Cancer Genome Project (CLCGP) cohort (n = 155). e Frequency of clinical stage in subsets of KRAS-mutant LUAD from (d). f Aggressive score assessed by clinical stage in each KRAS-mutant subgroup. g NQO1 immunostaining on KRASMUTKEAP1WTTP53MUT and KRASMUTKEAP1MUTTP53WT patient samples. Scale, 200 μm
Fig. 1 KEAP1 mutation is enriched in KRAS-mutant lung adenocarcinoma. a Frequency of KRAS mutation in lung adenocarcinoma (LUAD) obtained from the Broad Institute (n = 182), The Cancer Genome Atlas (n = 313) and the Memorial Sloan Kettering Cancer Center (MSKCC) (n = 864). b Frequency of KEAP1 mutation status in KRAS WT (wild type; n = 921) or MUT (mutant; n = 627) LUAD samples. c Venn Diagram of co-mutation/mutual exclusivity of KEAP1, TP53, and STK11 mutations in the subset of KRAS-mutant LUAD (n = 627). d KEAP1, TP53, and STK11 mutation status in KRAS-mutant LUAD patient samples from the Clinical Lung Cancer Genome Project (CLCGP) cohort (n = 155). e Frequency of clinical stage in subsets of KRAS-mutant LUAD from (d). f Aggressive score assessed by clinical stage in each KRAS-mutant subgroup. g NQO1 immunostaining on KRASMUTKEAP1WTTP53MUT and KRASMUTKEAP1MUTTP53WT patient samples. Scale, 200 μmCC BY · PubMed Central
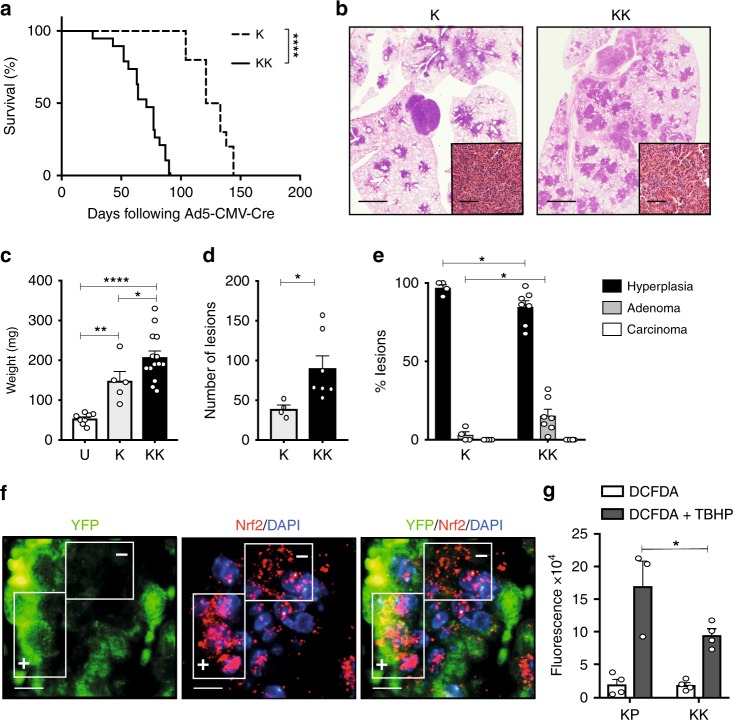
Fig. 2 Keap1 inactivation accelerates KrasG12D-induced lung adenocarcinoma. a Survival analysis of K (n = 10) and KK (n = 19) mice following Ad5-CMV-Cre administration. Mantel-Cox test: ****p < 0.0001. b Hematoxylin and eosin (H&E) stained lungs of representative K and KK mice at ethical endpoint. Scale, 1 mm; inset, 100 μm. c Weight of left lung lobe of uninfected littermates (U, n = 8), K (n = 5) and KK (n = 14) mice 3 months following Ad5-CMV-Cre infection. Ordinary one-way ANOVA/Holm-Sidak’s multiple comparisons test: U v K: **p = 0.006; U v KK: ****p < 0.0001; K v KK: *p = 0.0327. Mean ± SEM. d Number of lesions in the lungs of K (n = 4) and KK (n = 7) mice 3 months post Ad5-CMV-Cre. Ordinary one-way ANOVA/Tukey’s multiple comparisons test K v KK *p = 0.0397. Mean ± SEM. e Lesion classification of K (n = 4) and KK (n = 7) lungs 3 months post Ad5-CMV-Cre infection. Two-way ANOVA/Tukey’s multiple comparisons test: alveolar hyperplasia K v KK *p = 0.05, adenoma K v KK *p = 0.05. Mean ± SEM. f Immunofluorescence of EYFP and Nrf2 expression in EYFPT/+;KrasG12D/+;Keap1Δ/Δ three months following Ad5-CMV-Cre infection. Boxes represent EYFP positive and negative regions. Scale, 10 μm. g Quantification of 2,7-dichlorofluorescin diacetate (DCFDA) alone or in combination with 110 μM tert-butyl hydrogen peroxide (TBHP) to stimulate reactive oxygen species (ROS) in primary cell lines (n = 4 KP and KK). Mann–Whitney test DCFDA + TBHP KP v KK *p = 0.0286. Mean ± SEM
Fig. 2 Keap1 inactivation accelerates KrasG12D-induced lung adenocarcinoma. a Survival analysis of K (n = 10) and KK (n = 19) mice following Ad5-CMV-Cre administration. Mantel-Cox test: ****p < 0.0001. b Hematoxylin and eosin (H&E) stained lungs of representative K and KK mice at ethical endpoint. Scale, 1 mm; inset, 100 μm. c Weight of left lung lobe of uninfected littermates (U, n = 8), K (n = 5) and KK (n = 14) mice 3 months following Ad5-CMV-Cre infection. Ordinary one-way ANOVA/Holm-Sidak’s multiple comparisons test: U v K: **p = 0.006; U v KK: ****p < 0.0001; K v KK: *p = 0.0327. Mean ± SEM. d Number of lesions in the lungs of K (n = 4) and KK (n = 7) mice 3 months post Ad5-CMV-Cre. Ordinary one-way ANOVA/Tukey’s multiple comparisons test K v KK *p = 0.0397. Mean ± SEM. e Lesion classification of K (n = 4) and KK (n = 7) lungs 3 months post Ad5-CMV-Cre infection. Two-way ANOVA/Tukey’s multiple comparisons test: alveolar hyperplasia K v KK *p = 0.05, adenoma K v KK *p = 0.05. Mean ± SEM. f Immunofluorescence of EYFP and Nrf2 expression in EYFPT/+;KrasG12D/+;Keap1Δ/Δ three months following Ad5-CMV-Cre infection. Boxes represent EYFP positive and negative regions. Scale, 10 μm. g Quantification of 2,7-dichlorofluorescin diacetate (DCFDA) alone or in combination with 110 μM tert-butyl hydrogen peroxide (TBHP) to stimulate reactive oxygen species (ROS) in primary cell lines (n = 4 KP and KK). Mann–Whitney test DCFDA + TBHP KP v KK *p = 0.0286. Mean ± SEMCC BY · PubMed Central
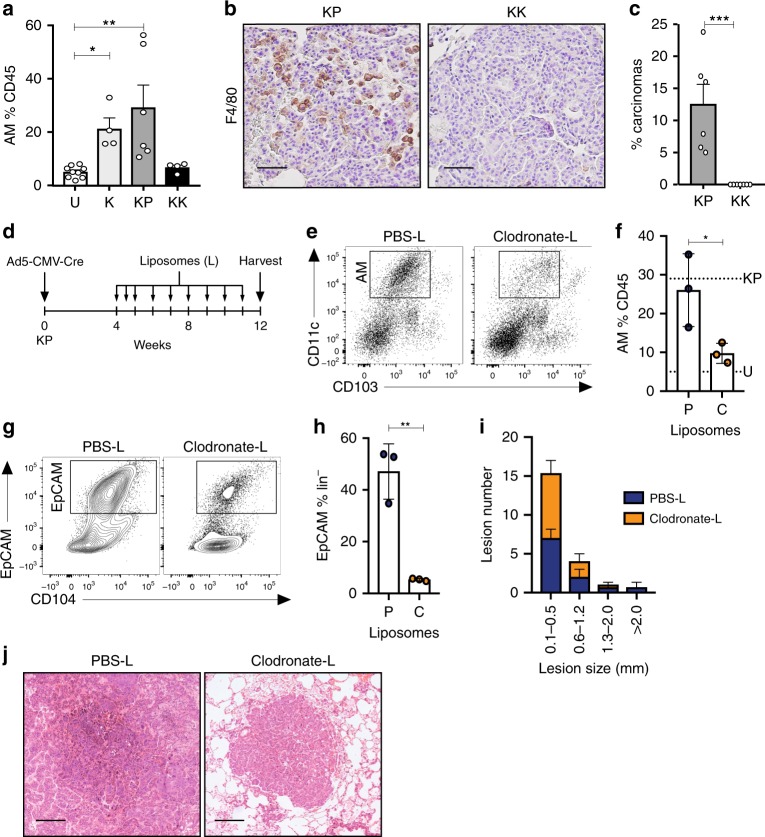
Fig. 3 Alveolar macrophages contribute to KrasG12D-induced tumorigenesis. a Quantification of alveolar macrophages (CD11c+CD11b−CD103−) in CD45+ immune lung infiltrate in uninfected (U; n = 9) and K (n = 4), KP (n = 6), KK (n = 4) mice 3 months post Ad5-CMV-Cre infection. Kruskal–Wallis test/Dunn’s multiple comparisons test U v K *p = 0.0127; U v KP **p = 0.0042. Mean ± SEM. b F4/80 immunostaining on KP and KK lung tissue 3 months post Ad5-CMV-Cre infection. Scale, 50 μm. c Frequency of carcinomatous lesions in KP (n = 6) and KK (n = 7) lungs 3 months post Ad5-CMV-Cre infection. Unpaired t test ***p = 0.001. Mean ± SEM. d Schematic of treatment plan. Briefly, KP mice were administered weekly PBS-liposomes or Clodronate-liposomes four weeks following Ad5-CMV-Cre infection. Lungs were harvested and analyzed for alveolar macrophages and tumor burden following 8 weeks of liposome treatment. e Representative flow cytometry plot of alveolar macrophage population (CD45+CD11c+CD103−) in the lungs of PBS- or Clodronate-liposome (L) treated mice. f Quantification of alveolar macrophages as a proportion of CD45+ cells in the lungs of KP mice treated with PBS (P; n = 3) or Clodronate (C; n = 3) liposomes. Dotted line represents mean value of alveolar macrophages in KP and U from (a), above. Unpaired t test *p = 0.0443. Mean ± SD. g Representative flow cytometry plot of epithelial cells (EpCAM+) in the lungs of PBS or Clodronate liposome treated mice. h Quantification of EpCAM+ population as a proportion of lineage negative (CD31−CD45−) cells. Unpaired t test **p = 0.0025. Mean ± SD. i Quantification of lesion size in PBS- and Clodronate-liposome (L) treated mice. j Representative H&E of PBS- and Clodronate-liposome (L) treated mice. Scale, 200 μm
Fig. 3 Alveolar macrophages contribute to KrasG12D-induced tumorigenesis. a Quantification of alveolar macrophages (CD11c+CD11b−CD103−) in CD45+ immune lung infiltrate in uninfected (U; n = 9) and K (n = 4), KP (n = 6), KK (n = 4) mice 3 months post Ad5-CMV-Cre infection. Kruskal–Wallis test/Dunn’s multiple comparisons test U v K *p = 0.0127; U v KP **p = 0.0042. Mean ± SEM. b F4/80 immunostaining on KP and KK lung tissue 3 months post Ad5-CMV-Cre infection. Scale, 50 μm. c Frequency of carcinomatous lesions in KP (n = 6) and KK (n = 7) lungs 3 months post Ad5-CMV-Cre infection. Unpaired t test ***p = 0.001. Mean ± SEM. d Schematic of treatment plan. Briefly, KP mice were administered weekly PBS-liposomes or Clodronate-liposomes four weeks following Ad5-CMV-Cre infection. Lungs were harvested and analyzed for alveolar macrophages and tumor burden following 8 weeks of liposome treatment. e Representative flow cytometry plot of alveolar macrophage population (CD45+CD11c+CD103−) in the lungs of PBS- or Clodronate-liposome (L) treated mice. f Quantification of alveolar macrophages as a proportion of CD45+ cells in the lungs of KP mice treated with PBS (P; n = 3) or Clodronate (C; n = 3) liposomes. Dotted line represents mean value of alveolar macrophages in KP and U from (a), above. Unpaired t test *p = 0.0443. Mean ± SD. g Representative flow cytometry plot of epithelial cells (EpCAM+) in the lungs of PBS or Clodronate liposome treated mice. h Quantification of EpCAM+ population as a proportion of lineage negative (CD31−CD45−) cells. Unpaired t test **p = 0.0025. Mean ± SD. i Quantification of lesion size in PBS- and Clodronate-liposome (L) treated mice. j Representative H&E of PBS- and Clodronate-liposome (L) treated mice. Scale, 200 μmCC BY · PubMed Central
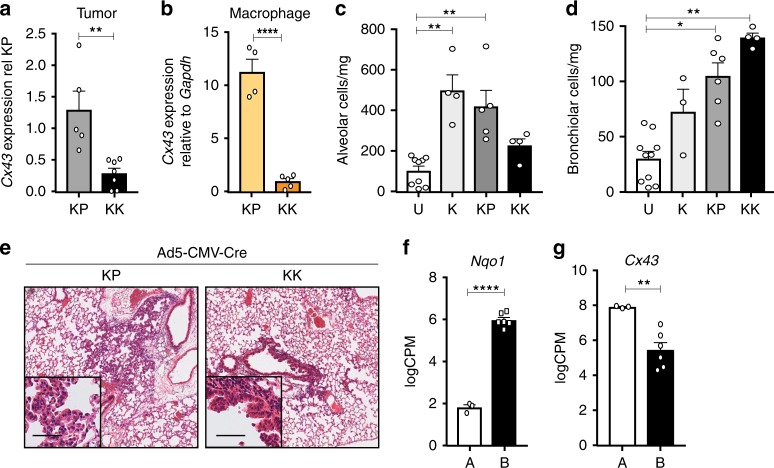
Fig. 4 Keap1 loss preferentially transforms bronchiolar cells. a Expression of Cx43 in KP (n = 5) and KK (n = 7) tumor pieces, relative to KP. Mann–Whitney test **p = 0.0025. Mean ± SEM. b Expression of Connexin-43 (Cx43) in alveolar macrophages isolated from KP (n = 4) and KK (n = 5) tumor-bearing lungs, relative to Gapdh control. Unpaired student t test ****p < 0.0001. Mean ± SEM. c Quantification of alveolar (EpCAM+CD104−) compartment in uninfected (U; n = 9) and K (n = 4), KP (n = 4) and KK (n = 5) 3 months post Ad5-CMV-Cre administration. Kruskal–Wallis test/Dunn’s multiple comparisons test, U v K **p = 0.0034, U v KP **p = 0.0095. Mean ± SEM. d Quantification of bronchiolar (EpCAM+CD104+) compartment in uninfected (U; n = 9) and K (n = 3), KP (n = 4) and KK (n = 6) 3 months post Ad5-CMV-Cre administration. Kruskal–Wallis test/Dunn’s multiple comparisons test, U v KK **p = 0.0014, U v KP *p = 0.0308. Mean ± SEM. e Representative H&E stained KP and KK lungs 3 weeks post Ad5-CMV-Cre infection. Scale, 200 μm; inset, 50 μm. f Expression of Nqo1 in alveolar (A) and bronchiolar (B) cells (n = 3). ****FDR p < 0.0001. Mean ± SEM. g Expression of Cx43 mRNA in alveolar (A) and bronchiolar (B) cells (n = 3). **FDR p = 0.0055. Mean ± SEM
Fig. 4 Keap1 loss preferentially transforms bronchiolar cells. a Expression of Cx43 in KP (n = 5) and KK (n = 7) tumor pieces, relative to KP. Mann–Whitney test **p = 0.0025. Mean ± SEM. b Expression of Connexin-43 (Cx43) in alveolar macrophages isolated from KP (n = 4) and KK (n = 5) tumor-bearing lungs, relative to Gapdh control. Unpaired student t test ****p < 0.0001. Mean ± SEM. c Quantification of alveolar (EpCAM+CD104−) compartment in uninfected (U; n = 9) and K (n = 4), KP (n = 4) and KK (n = 5) 3 months post Ad5-CMV-Cre administration. Kruskal–Wallis test/Dunn’s multiple comparisons test, U v K **p = 0.0034, U v KP **p = 0.0095. Mean ± SEM. d Quantification of bronchiolar (EpCAM+CD104+) compartment in uninfected (U; n = 9) and K (n = 3), KP (n = 4) and KK (n = 6) 3 months post Ad5-CMV-Cre administration. Kruskal–Wallis test/Dunn’s multiple comparisons test, U v KK **p = 0.0014, U v KP *p = 0.0308. Mean ± SEM. e Representative H&E stained KP and KK lungs 3 weeks post Ad5-CMV-Cre infection. Scale, 200 μm; inset, 50 μm. f Expression of Nqo1 in alveolar (A) and bronchiolar (B) cells (n = 3). ****FDR p < 0.0001. Mean ± SEM. g Expression of Cx43 mRNA in alveolar (A) and bronchiolar (B) cells (n = 3). **FDR p = 0.0055. Mean ± SEMCC BY · PubMed Central
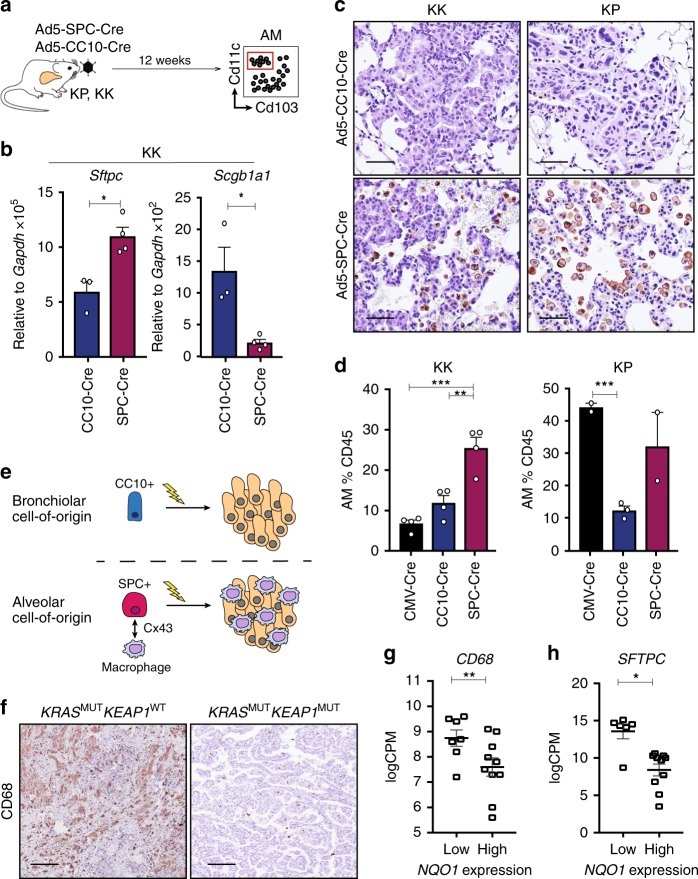
Fig. 5 Cell-of-origin determines the alveolar macrophage composition in LUAD. a Schematic of cell type-specific Ad5-Cre experimental design. b Expression of Sftpc and Scgb1a1 in KK lung tumor pieces 3 months following administration of Ad5-CC10-Cre (n = 3) or Ad5-SPC-Cre (n = 4). Unpaired t test, Sftpc *p = 0.0168; Scgb1a1 *p = 0.0107. Mean ± SEM. c F4/80 immunostaining on lung tissue from KK and KP mice infected with Ad5-CC10-Cre or Ad5-SPC-Cre. Scale, 50 μm. d Quantification of alveolar macrophages in CD45+ immune lung infiltrate of Ad5-CMV-Cre infected KK (n = 4) and KP (n = 4), Ad5-CC10-Cre infected KK (n = 4) and KP (n = 2) and Ad5-SPC-Cre infected KK (n = 4) and KP (n = 3) mice. KK, ordinary one-way ANOVA/Holm-Sidak’s multiple comparisons test CMV-Cre v SPC-Cre ***p = 0.0002, SPC-Cre v CC10-Cre **p = 0.0016. KP, unpaired t test CMV-Cre v CC10-Cre ***p = 0.0006. Mean ± SEM. e Schematic of cell-of-origin hypothesis and enhanced macrophage number in lung tumors arising from alveolar epithelial cells. Lightning bolt depicts genetic alterations. f Immunostaining of CD68 on KRASMUTKEAP1WT and KRASMUTKEAP1MUT LUAD. Scale, 200 μm. g Analysis of CD68 expression in NQO1low (n = 7) and NQO1high (n = 10) KRAS-mutant LUAD TCGA patient samples. **FDR p = 0.0012. Mean ± SEM. h Analysis of SFTPC expression in NQO1low (n = 7) and NQO1high (n = 10) KRAS-mutant LUAD TCGA patient samples. **FDR p = 0.0108. Mean ± SEM
Fig. 5 Cell-of-origin determines the alveolar macrophage composition in LUAD. a Schematic of cell type-specific Ad5-Cre experimental design. b Expression of Sftpc and Scgb1a1 in KK lung tumor pieces 3 months following administration of Ad5-CC10-Cre (n = 3) or Ad5-SPC-Cre (n = 4). Unpaired t test, Sftpc *p = 0.0168; Scgb1a1 *p = 0.0107. Mean ± SEM. c F4/80 immunostaining on lung tissue from KK and KP mice infected with Ad5-CC10-Cre or Ad5-SPC-Cre. Scale, 50 μm. d Quantification of alveolar macrophages in CD45+ immune lung infiltrate of Ad5-CMV-Cre infected KK (n = 4) and KP (n = 4), Ad5-CC10-Cre infected KK (n = 4) and KP (n = 2) and Ad5-SPC-Cre infected KK (n = 4) and KP (n = 3) mice. KK, ordinary one-way ANOVA/Holm-Sidak’s multiple comparisons test CMV-Cre v SPC-Cre ***p = 0.0002, SPC-Cre v CC10-Cre **p = 0.0016. KP, unpaired t test CMV-Cre v CC10-Cre ***p = 0.0006. Mean ± SEM. e Schematic of cell-of-origin hypothesis and enhanced macrophage number in lung tumors arising from alveolar epithelial cells. Lightning bolt depicts genetic alterations. f Immunostaining of CD68 on KRASMUTKEAP1WT and KRASMUTKEAP1MUT LUAD. Scale, 200 μm. g Analysis of CD68 expression in NQO1low (n = 7) and NQO1high (n = 10) KRAS-mutant LUAD TCGA patient samples. **FDR p = 0.0012. Mean ± SEM. h Analysis of SFTPC expression in NQO1low (n = 7) and NQO1high (n = 10) KRAS-mutant LUAD TCGA patient samples. **FDR p = 0.0108. Mean ± SEMCC BY · PubMed Central
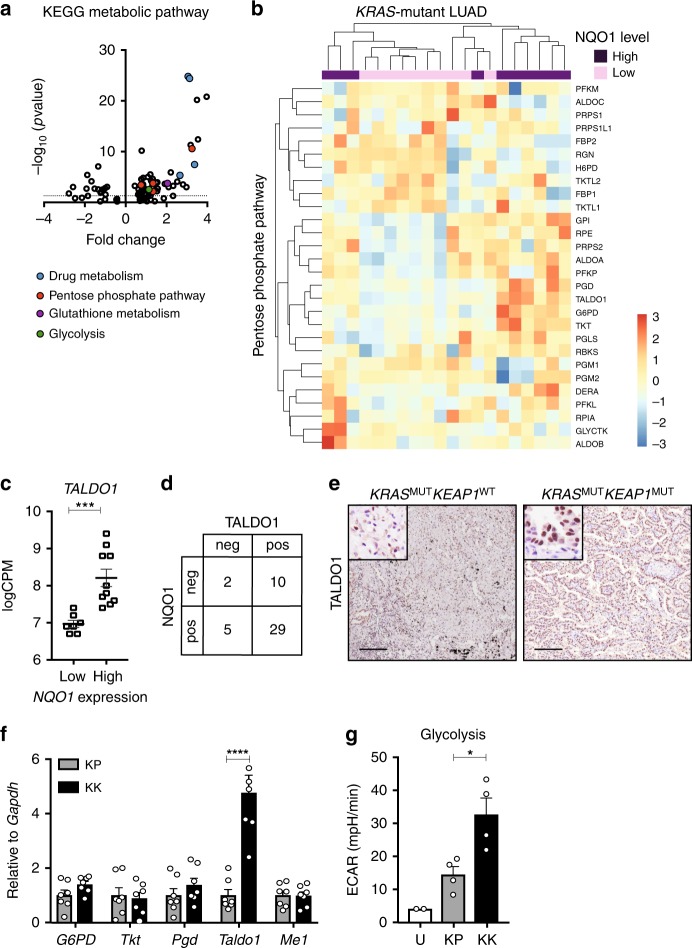
Fig. 6 Enhanced glucose metabolism in Keap1-mutant KrasG12D LUAD. a Volcano plot of top KEGG metabolic pathways differentially expressed in NQO1low (n = 10) and NQO1high (n = 10) KRAS-mutant LUAD from the TCGA dataset. Pathways involved in drug metabolism, pentose phosphate pathway, glutathione metabolism, and glycolysis have been highlighted. Dotted line represents p = 0.05. b Heatmap of KEGG pentose phosphate pathway in NQO1low (n = 10) and NQO1high (n = 10) KRAS-mutant LUAD from the TCGA dataset. c Analysis of TALDO1 expression in NQO1low (n = 7) and NQO1high (n = 10) KRAS-mutant LUAD TCGA patient samples. ***FDR p = 0.0006. Mean ± SEM. d Correlation of TALDO1 and NQO1 immunostaining in KRAS-mutant LUAD (n = 46). e TALDO1 immunostaining on KRASMUTKEAP1WT and KRASMUTKEAP1MUT patient samples. Scale, 200 μm; inset, 50 μm. f Expression of glycolytic enzyme (G6PD), pentose phosphate pathway enzymes (Tkt, Pgd, Taldo1) and malic enzyme (Me1) in tumor pieces from KP (n = 7) and KK (n = 7) lungs. Expression relative to Gapdh housekeeper control and quantified relative to KP expression. Two-way ANOVA/Sidak’s multiple comparisons test Taldo1 KP v KK ****p < 0.0001. Mean ± SEM. g Rate of glycolysis measured by extracellular acidification rate (ECAR) of uninfected lung epithelium (U; n = 2 experiments, n = 6 mice per experiment) and KP (n = 4) as well as KK (n = 4) flow cytometry isolated tumor cells 3 months following Ad5-CMV-Cre infection. Ordinary one-way ANOVA/Holm-Sidak’s multiple comparisons test, KP v KK *p = 0.0198. Mean ± SEM
Fig. 6 Enhanced glucose metabolism in Keap1-mutant KrasG12D LUAD. a Volcano plot of top KEGG metabolic pathways differentially expressed in NQO1low (n = 10) and NQO1high (n = 10) KRAS-mutant LUAD from the TCGA dataset. Pathways involved in drug metabolism, pentose phosphate pathway, glutathione metabolism, and glycolysis have been highlighted. Dotted line represents p = 0.05. b Heatmap of KEGG pentose phosphate pathway in NQO1low (n = 10) and NQO1high (n = 10) KRAS-mutant LUAD from the TCGA dataset. c Analysis of TALDO1 expression in NQO1low (n = 7) and NQO1high (n = 10) KRAS-mutant LUAD TCGA patient samples. ***FDR p = 0.0006. Mean ± SEM. d Correlation of TALDO1 and NQO1 immunostaining in KRAS-mutant LUAD (n = 46). e TALDO1 immunostaining on KRASMUTKEAP1WT and KRASMUTKEAP1MUT patient samples. Scale, 200 μm; inset, 50 μm. f Expression of glycolytic enzyme (G6PD), pentose phosphate pathway enzymes (Tkt, Pgd, Taldo1) and malic enzyme (Me1) in tumor pieces from KP (n = 7) and KK (n = 7) lungs. Expression relative to Gapdh housekeeper control and quantified relative to KP expression. Two-way ANOVA/Sidak’s multiple comparisons test Taldo1 KP v KK ****p < 0.0001. Mean ± SEM. g Rate of glycolysis measured by extracellular acidification rate (ECAR) of uninfected lung epithelium (U; n = 2 experiments, n = 6 mice per experiment) and KP (n = 4) as well as KK (n = 4) flow cytometry isolated tumor cells 3 months following Ad5-CMV-Cre infection. Ordinary one-way ANOVA/Holm-Sidak’s multiple comparisons test, KP v KK *p = 0.0198. Mean ± SEMCC BY · PubMed Central
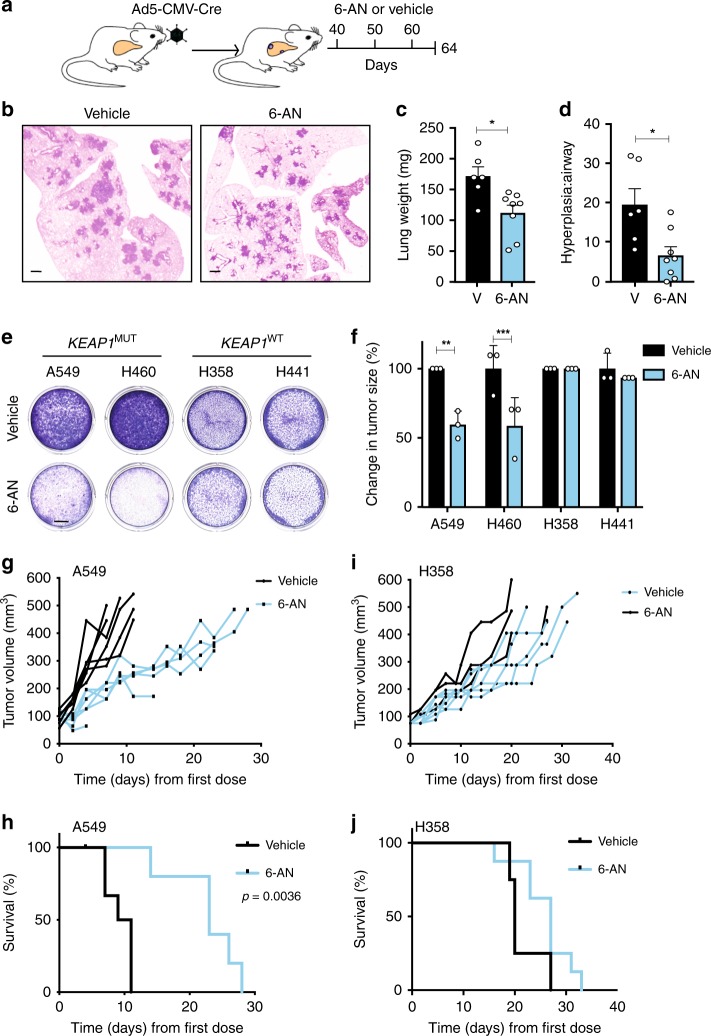
Fig. 7 PPP blockade abrogates the growth of KEAP1-mutant LUAD. a Schematic of spontaneous tumor treatment study. Briefly, KK or KP mice were randomized into 20 mg/kg 6-AN or vehicle treated 40 days post Ad5-CMV-Cre intranasal infection. Lungs were harvested for analysis on day 64. b Representative H&E images of KK vehicle or 6-AN-treated lungs. Scale, 1 mm. c Quantification of KK superior lobe lung weight (milligrams, mg) following vehicle (n = 6) or 6-AN (n = 8) treatment. Unpaired t test *p = 0.0106. Mean ± SEM. d Ratio of KK hyperplasia relative to large airway size in vehicle (n = 6) and 6-AN (n = 8) treated lungs. Unpaired t test *p = 0.0116. Mean ± SEM. e Colony assay 72 h following treatment with 62.5 μM 6-AN vs vehicle in KEAP1MUT and KEAP1WT NSCLC cell lines. Scale, 5 mm. f Relative change in tumor size of xenograft models (n = 3/cell line) of KEAP1MUT and KEAP1WT 48 h following treatment with 20 mg/kg 6-AN or vehicle. Change in size relative to vehicle of each cell line. Two-way ANOVA/Sidak’s multiple comparisons test: A549 **p = 0.0012; H460 ***p = 0.001. Mean ± SD. g Tumor measurements of A549 cell line xenograft following treatment with 20 mg/kg 6-AN (n = 6) or vehicle (n = 6) every 10 days. Survival log-rank (Mantel-Cox) test **p = 0.0023. h Kaplan–Meier survival curve of A549 xenograft NSG mice treated with 20 mg/kg 6-AN (n = 6) or vehicle (n = 6) every 10 days. Mantel–Cox test **p = 0.0017. i Tumor measurements of H358 xenograft following treatment with 20 mg/kg 6-AN (n = 8) or vehicle (n = 4) every 10 days. j Kaplan–Meier survival curve of H358 xenograft NSG mice treated with 20 mg/kg 6-AN (n = 8) or vehicle (n = 4) every 10 days
Fig. 7 PPP blockade abrogates the growth of KEAP1-mutant LUAD. a Schematic of spontaneous tumor treatment study. Briefly, KK or KP mice were randomized into 20 mg/kg 6-AN or vehicle treated 40 days post Ad5-CMV-Cre intranasal infection. Lungs were harvested for analysis on day 64. b Representative H&E images of KK vehicle or 6-AN-treated lungs. Scale, 1 mm. c Quantification of KK superior lobe lung weight (milligrams, mg) following vehicle (n = 6) or 6-AN (n = 8) treatment. Unpaired t test *p = 0.0106. Mean ± SEM. d Ratio of KK hyperplasia relative to large airway size in vehicle (n = 6) and 6-AN (n = 8) treated lungs. Unpaired t test *p = 0.0116. Mean ± SEM. e Colony assay 72 h following treatment with 62.5 μM 6-AN vs vehicle in KEAP1MUT and KEAP1WT NSCLC cell lines. Scale, 5 mm. f Relative change in tumor size of xenograft models (n = 3/cell line) of KEAP1MUT and KEAP1WT 48 h following treatment with 20 mg/kg 6-AN or vehicle. Change in size relative to vehicle of each cell line. Two-way ANOVA/Sidak’s multiple comparisons test: A549 **p = 0.0012; H460 ***p = 0.001. Mean ± SD. g Tumor measurements of A549 cell line xenograft following treatment with 20 mg/kg 6-AN (n = 6) or vehicle (n = 6) every 10 days. Survival log-rank (Mantel-Cox) test **p = 0.0023. h Kaplan–Meier survival curve of A549 xenograft NSG mice treated with 20 mg/kg 6-AN (n = 6) or vehicle (n = 6) every 10 days. Mantel–Cox test **p = 0.0017. i Tumor measurements of H358 xenograft following treatment with 20 mg/kg 6-AN (n = 8) or vehicle (n = 4) every 10 days. j Kaplan–Meier survival curve of H358 xenograft NSG mice treated with 20 mg/kg 6-AN (n = 8) or vehicle (n = 4) every 10 daysCC BY · PubMed Central

Verification

Claims the paper makes

The claims and statistics of this paper haven’t been checked yet.

Run the check — free, no account needed. It reads the open-access text and checks the sources it cites.

A few free checks a day · papers already verified open instantly · results are public

Claims other papers make about this one

Each is checked against this paper’s own text: does it say what the citing paper says it does?

Self-check

Percentages, sums and reported differences re-computed from the paper’s own numbers.

The self-check needs the paper’s full text.

Citations

Cites

Show all 72 references

Cited by

Sorted by citations

Items 101–111 of 111

Metadata

Authors
Best, S. A., Ding, S., Kersbergen, A., Dong, X., Song, J.-Y., Xie, Y., Reljic, B., Li, K., Vince, J. E., Rathi, V., Wright, G. M., Ritchie, M. E., & Sutherland, K. D.
Affiliations
  • The University of Melbourne (AU)
  • Walter and Eliza Hall Institute of Medical Research (AU)
  • The Netherlands Cancer Institute (NL)
Corresponding author
Sutherland, Kate D.
Venue
Nature Communications
Published
2019-09-13
Volume
10
Issue
1
Pages
4190-4190
ISSN
2041-1723 (ISSN-L)
OpenAlex
W2972329402
Cited by
108
References
72
Citations by year
2026: 8 · 2025: 14 · 2024: 14 · 2023: 17 · 2022: 17 · 2021: 22 · 2020: 14 · 2019: 1
FWCI
10.46
Type
journal article
Language
en
Open access
Locations
  • Nature Communications (publishedVersion, cc-by)
  • PubMed Central (publishedVersion, cc-by)
  • PubMed (publishedVersion)
  • Minerva Access (University of Melbourne) (submittedVersion, cc-by)
  • RePEc: Research Papers in Economics (submittedVersion)
  • DOAJ (DOAJ: Directory of Open Access Journals) (submittedVersion, cc-by-sa)
  • DOAJ (DOAJ: Directory of Open Access Journals) (submittedVersion)
Funders
  • Department of Health | National Health and Medical Research Council (1138275, 1159002, 1104924)
  • Victorian Cancer Agency (18003)
  • Peter and Julie Alston WEHI Centenary Fellowship
Topics
  • Health Sciences › Medicine › Pulmonary and Respiratory Medicine › Lung Cancer Treatments and Mutations
  • Life Sciences › Biochemistry, Genetics and Molecular Biology › Molecular Biology › Protein Kinase Regulation and GTPase Signaling
  • Life Sciences › Biochemistry, Genetics and Molecular Biology › Molecular Biology › Genomics, phytochemicals, and oxidative stress
Keywords
KRAS-mutant lung adenocarcinoma, pentose phosphate pathway, tumor cell of origin, tumor-associated macrophages, tumor immune heterogeneity, tumor metabolic heterogeneity, KRAS G12D, co-occurring mutations, therapeutic target
MeSH terms
Kelch-Like ECH-Associated Protein 1, Adenocarcinoma of Lung, Animals, Carcinoma, Non-Small-Cell Lung, Female, Flow Cytometry, Immunohistochemistry, Lung Neoplasms, Male, Mice, Inbred C57BL, Blotting, Western, Proto-Oncogene Proteins p21(ras), Reactive Oxygen Species, Cell Line, Tumor, NF-E2-Related Factor 2, Mice

About these checks

Registry, retraction, Cites and statistics results are computed, not judged, with one exception: a printed reference that no index lists is read once by a model before it counts as a citation error. Claims are extracted by a model and kept only when their quote appears verbatim in the text; each cited source is then checked, with a model’s help, for whether it says what the claim relies on. Those verdicts can be wrong — read the claim’s quote and the cited source before relying on one.

Statistics and arithmetic are recomputed, not judged.

Confidence bands are shown only for fields calibrated on our annotated test set. None is calibrated yet, so no band is shown.

What counts as a claim ›How we measure confidence ›How we check this ›

Are you an author, or do you see a problem with this page? Request a review