

The DOI matches its Crossref record; 49 of the 51 references it cites were found in a registry or an index.
Systematically optimized BCMA/CS1 bispecific CAR-T cells robustly control heterogeneous multiple myeloma
Open accessPublished version of a preprint
Abstract
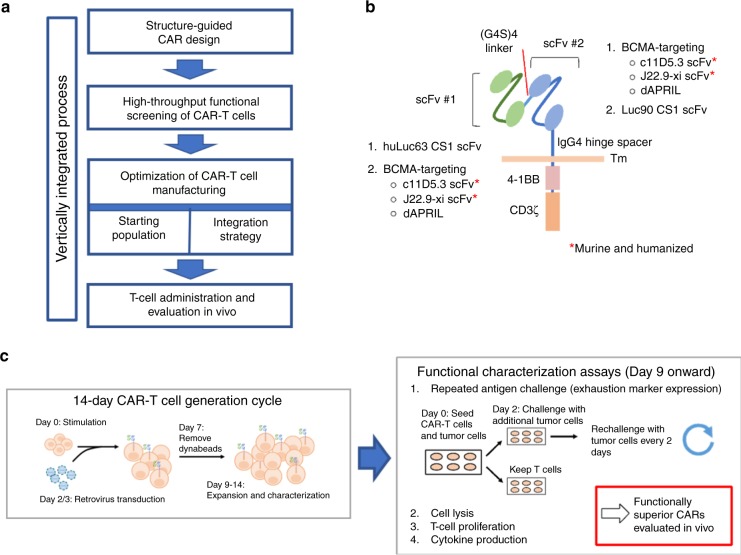
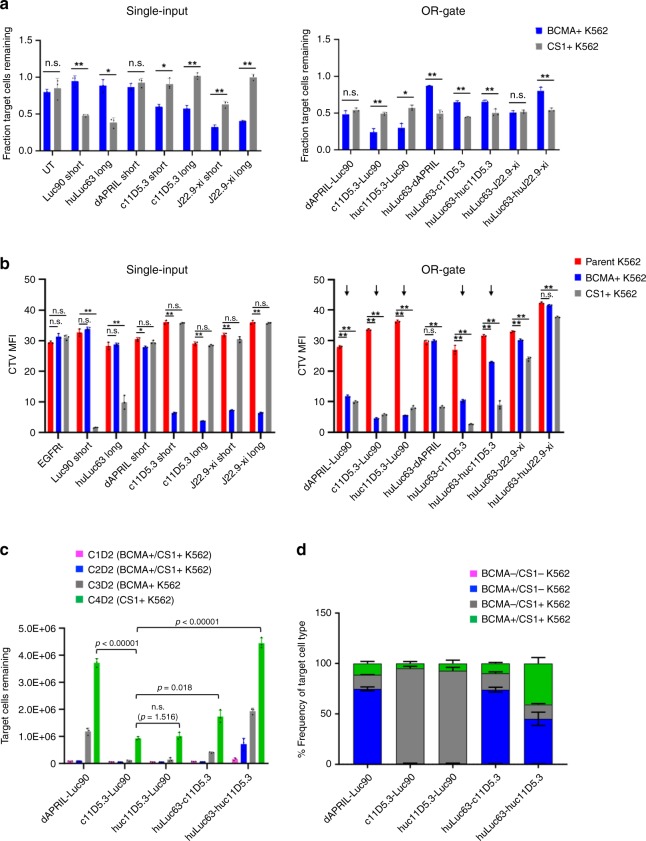
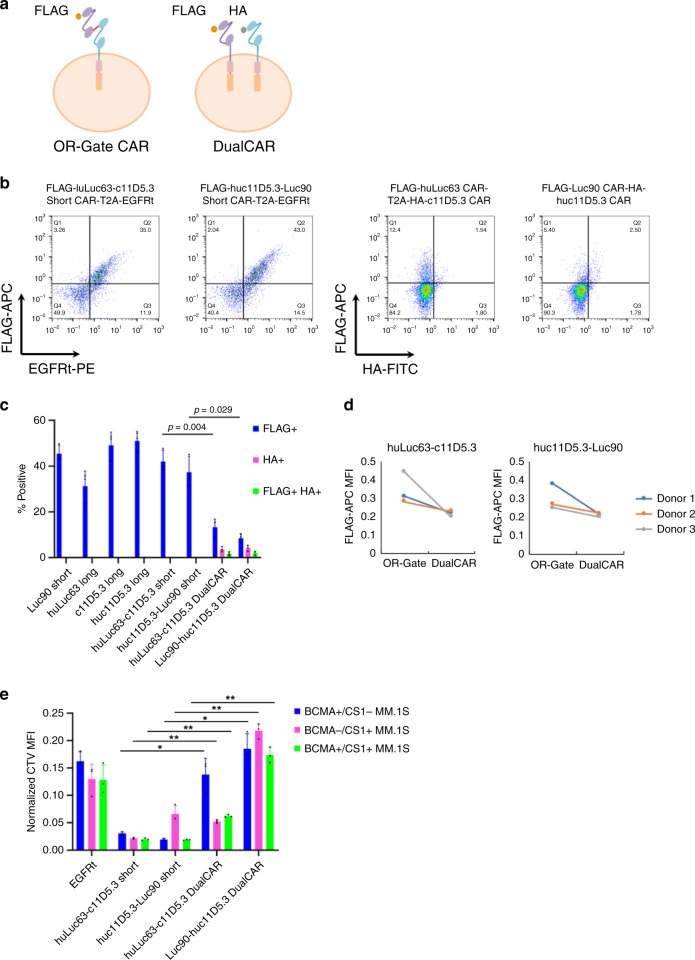
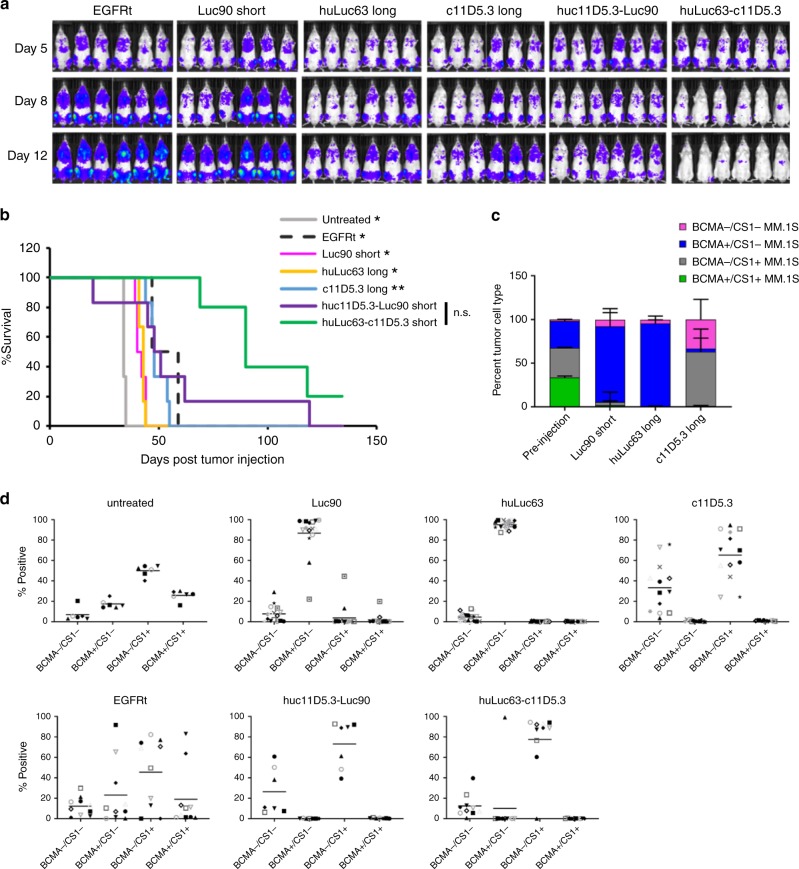
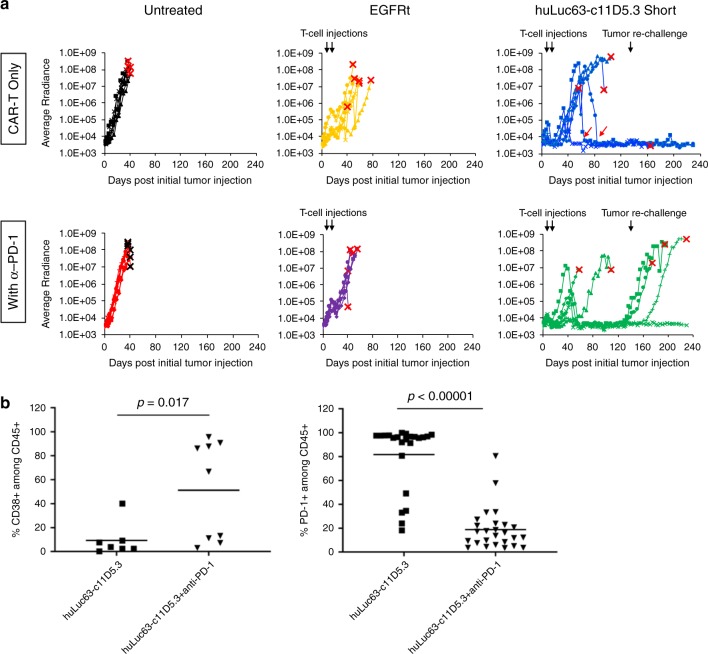
Chimeric antigen receptor (CAR)-T cell therapy has shown remarkable clinical efficacy against B-cell malignancies, yet marked vulnerability to antigen escape and tumor relapse exists. Here we report the rational design and optimization of bispecific CAR-T cells with robust activity against heterogeneous multiple myeloma (MM) that is resistant to conventional CAR-T cell therapy targeting B-cell maturation antigen (BCMA). We demonstrate that BCMA/CS1 bispecific CAR-T cells exhibit superior CAR expression and function compared to T cells that co-express individual BCMA and CS1 CARs. Combination therapy with anti–PD-1 antibody further accelerates the rate of initial tumor clearance in vivo, while CAR-T cell treatment alone achieves durable tumor-free survival even upon tumor re-challenge. Taken together, the BCMA/CS1 bispecific CAR presents a promising treatment approach to prevent antigen escape in CAR-T cell therapy against MM, and the vertically integrated optimization process can be used to develop robust cell-based therapy against novel disease targets.
Overview
The claims and statistics of this paper haven’t been checked yet.
Run the check — free, no account needed. It reads the open-access text and checks the sources it cites.
Integrity signals
Registry
Cites
Statistics
Figures
Verification
Claims the paper makes
The claims and statistics of this paper haven’t been checked yet.
Run the check — free, no account needed. It reads the open-access text and checks the sources it cites.
Claims other papers make about this one
Each is checked against this paper’s own text: does it say what the citing paper says it does?
The cited source says what the claim attributes to it.
In the citing paper
“Several CAR-T cells targeting antigens, such an GPRC5D [229–231], CD19 [232, 233], CD38 [234–236], CD138 [237], CS1 [238–240] and NKG2D [241, 242] are also under exploration for their efficacy in MM treatment.”
From Multiple myeloma: signaling pathways and targeted therapy (2024) · cites this paper as [238]
In the citing paper
“α-PD-1/PD-L1 enhanced CAR-T cell therapy by rescuing CAR-T cell exhaustion [341–343].”
From Combination strategies with PD-1/PD-L1 blockade: current advances and future directions (2022) · cites this paper as [343]
Self-check
Percentages, sums and reported differences re-computed from the paper’s own numbers.
The self-check needs the paper’s full text.
Citations
Cites
Enzymatic assembly of DNA molecules up to several hundred kilobases
Gibson, D. G., Young, L., Chuang, R.-Y., Venter, J. C., Hutchison, C. A., & Smith, H. O. (2009) · Nature Methods · doi:10.1038/nmeth.1318 · Cited by 10,088
CD19 CAR–T cells of defined CD4+:CD8+ composition in adult B cell ALL patients
Turtle, C. J., Hanafi, L.-A., Berger, C., Gooley, T. A., Cherian, S., Hudecek, M., Sommermeyer, D., Melville, K., Pender, B., Budiarto, T. M., et al. (2016) · Journal of Clinical Investigation · doi:10.1172/jci85309 · Cited by 2,112
Targeting a CAR to the TRAC locus with CRISPR/Cas9 enhances tumour rejection
Eyquem, J., Mansilla-Soto, J., Giavridis, T., van der Stegen, S. J. C., Hamieh, M., Cunanan, K. M., Odak, A., Gönen, M., & Sadelain, M. (2017) · Nature · doi:10.1038/nature21405 · Cited by 1,831
Elotuzumab Therapy for Relapsed or Refractory Multiple Myeloma
Lonial, S., Dimopoulos, M., Palumbo, A., White, D., Grosicki, S., Spicka, I., Walter-Croneck, A., Moreau, P., Mateos, M.-V., Magen, H., et al. (2015) · New England Journal of Medicine · doi:10.1056/nejmoa1505654 · Cited by 1,322
Sommermeyer, D., Hudecek, M., Kosasih, P. L., Gogishvili, T., Maloney, D. G., Turtle, C. J., & Riddell, S. R. (2015) · Leukemia · doi:10.1038/leu.2015.247 · Cited by 888
Berger, C., Jensen, M. C., Lansdorp, P. M., Gough, M., Elliott, C., & Riddell, S. R. (2008) · Journal of Clinical Investigation · doi:10.1172/jci32103 · Cited by 822
Brudno, J. N., Marić, I., Hartman, S. D., Rose, J. J., Wang, M., Lam, N., Stetler‐Stevenson, M., Salem, D., Yuan, C. M., Pavletic, S. Z., et al. (2018) · Journal of Clinical Oncology · doi:10.1200/jco.2018.77.8084 · Cited by 792
Clonal hematopoiesis, with and without candidate driver mutations, is common in the elderly
Zink, F., Stacey, S. N., Norddahl, G. L., Frigge, M. L., Magnusson, O. T., Jonsdottir, I., Thorgeirsson, T. E., Sigurdsson, A., Gudjonsson, S. A., Gudmundsson, J., et al. (2017) · Blood · doi:10.1182/blood-2017-02-769869 · Cited by 777
Ali, S. A., Shi, V., Marić, I., Wang, M. L., Stroncek, D. F., Rose, J. J., Brudno, J. N., Stetler‐Stevenson, M., Feldman, S. A., Hansen, B. G., et al. (2016) · Blood · doi:10.1182/blood-2016-04-711903 · Cited by 776
Xu, Y., Zhang, M., Ramos, C. A., Durett, A. G., Liu, E., Dakhova, O., Liu, H., Creighton, C. J., Gee, A. P., Heslop, H. E., et al. (2014) · Blood · doi:10.1182/blood-2014-01-552174 · Cited by 760
Cited by
Sorted by citations
Combination strategies with PD-1/PD-L1 blockade: current advances and future directions
Yi, M., Zheng, X., Niu, M., Zhu, S., Ge, H., & Wu, K. (2022) · Molecular Cancer · doi:10.1186/s12943-021-01489-2 · Cited by 1,445
Natural killer cells in antitumour adoptive cell immunotherapy
Laskowski, T. J., Biederstädt, A., & Rezvani, K. (2022) · Nature reviews. Cancer · doi:10.1038/s41568-022-00491-0 · Cited by 810
Engineering CAR-T Cells for Next-Generation Cancer Therapy
Hong, M., Clubb, J. D., & Chen, Y. Y. (2020) · Cancer Cell · doi:10.1016/j.ccell.2020.07.005 · Cited by 659
Self-citationSpiegel, J. Y., Patel, S., Muffly, L. S., Hossain, N. M., Oak, J. S., Baird, J. H., Frank, M. J., Shiraz, P., Sahaf, B., Craig, J. K., et al. (2021) · Nature Medicine · doi:10.1038/s41591-021-01436-0 · Cited by 640
Navigating CAR-T cells through the solid-tumour microenvironment
Hou, A. J., Chen, L. C., & Chen, Y. Y. (2021) · Nature Reviews Drug Discovery · doi:10.1038/s41573-021-00189-2 · Cited by 580
Self-citationBrown, C. E., Hibbard, J. C., Alizadeh, D., Blanchard, M. S., Natri, H. M., Wang, D., Ostberg, J. R., Aguilar, B., Wagner, J. R., Paul, J. A., et al. (2024) · Nature Medicine · doi:10.1038/s41591-024-02875-1 · Cited by 374
Self-citationEngineering living therapeutics with synthetic biology
Cubillos-Ruiz, A., Guo, T., Sokolovska, A., Miller, P., Collins, J. J., Lu, T. K., & Lora, J. M. (2021) · Nature Reviews Drug Discovery · doi:10.1038/s41573-021-00285-3 · Cited by 387
CAR-T cell manufacturing: Major process parameters and next-generation strategies
Ceja, M. A., Khericha, M., Harris, C. M., Puig-Saus, C., & Chen, Y. Y. (2023) · The Journal of Experimental Medicine · doi:10.1084/jem.20230903 · Cited by 349
Self-citationA bispecific CAR-T cell therapy targeting BCMA and CD38 in relapsed or refractory multiple myeloma
Mei, H., Li, C., Jiang, H., Zhao, X., Huang, Z., Jin, D., Guo, T., Kou, H., Liu, L., Tang, L., et al. (2021) · Journal of Hematology & Oncology · doi:10.1186/s13045-021-01170-7 · Cited by 222
KIR-based inhibitory CARs overcome CAR-NK cell trogocytosis-mediated fratricide and tumor escape
Li, Y., Başar, R., Wang, G., Liu, E., Moyes, J. S. E., Li, L., Kerbauy, L. N., Uprety, N., Fathi, M., Rezvan, A., et al. (2022) · Nature Medicine · doi:10.1038/s41591-022-02003-x · Cited by 191
CAR T therapies in multiple myeloma: unleashing the future
Sheykhhasan, M., Ahmadieh-Yazdi, A., Vicidomini, R., Poondla, N., Tanzadehpanah, H., Dirbaziyan, A., Mahaki, H., Manoochehri, H., Kalhor, N., & Dama, P. (2024) · Cancer Gene Therapy · doi:10.1038/s41417-024-00750-2 · Cited by 183
CAR T-cell therapy in multiple myeloma: more room for improvement
Teoh, P. J., & Chng, W. J. (2021) · Blood Cancer Journal · doi:10.1038/s41408-021-00469-5 · Cited by 179
CAR-T cell therapy in multiple myeloma: Current limitations and potential strategies
Zhang, X., Zhang, H., Lan, H., Wu, J., & Xiao, Y. (2023) · Frontiers in Immunology · doi:10.3389/fimmu.2023.1101495 · Cited by 181
Genetic engineering of T cells for immunotherapy
Ellis, G. I., Sheppard, N. C., & Riley, J. L. (2021) · Nature Reviews Genetics · doi:10.1038/s41576-021-00329-9 · Cited by 170
3D-organoid culture supports differentiation of human CAR+ iPSCs into highly functional CAR T cells
Wang, Z., McWilliams‐Koeppen, H. P., Reza, H., Ostberg, J. R., Chen, W., Wang, X., Huynh, C., Vyas, V., Chang, W.-C., Starr, R., et al. (2022) · Cell stem cell · doi:10.1016/j.stem.2022.02.009 · Cited by 148
Self-citationProgrammable protein circuit design
Chen, Z., & Elowitz, M. B. (2021) · Cell · doi:10.1016/j.cell.2021.03.007 · Cited by 141
Liu, T., Xu, L., He, L.-Z., Zhao, J., Zhang, Z., Chen, Q., & Chen, T. (2020) · Nano Today · doi:10.1016/j.nantod.2020.100975 · Cited by 134
The evolution of synthetic receptor systems
Manhas, J., Edelstein, H. I., Leonard, J. N., & Morsut, L. (2022) · Nature Chemical Biology · doi:10.1038/s41589-021-00926-z · Cited by 119
Current state and next-generation CAR-T cells in multiple myeloma
Manier, S., Ingegnere, T., Escure, G., Prodhomme, C., Nudel, M., Mitra, S., & Facon, T. T. F. (2022) · Blood Reviews · doi:10.1016/j.blre.2022.100929 · Cited by 115
Larson, S. M., Walthers, C. M., Ji, B., Ghafouri, S. N., Naparstek, J., Trent, J., Chen, J. M., Roshandell, M., Harris, C. M., Khericha, M., et al. (2022) · Cancer Discovery · doi:10.1158/2159-8290.cd-22-0964 · Cited by 111
Self-citationMüller, Y. D., Ferreira, L. M. R., Ronin, É., Ho, P., Nguyen, V. Q., Faleo, G., Zhou, Y., Lee, K., Leung, K., Skartsis, N., et al. (2021) · Frontiers in Immunology · doi:10.3389/fimmu.2021.686439 · Cited by 109
Amatya, C., Pegues, M. A., Lam, N., Vanasse, D., Geldres, C., Choi, S. H., Hewitt, S. M., Feldman, S. A., & Kochenderfer, J. N. (2020) · Molecular Therapy · doi:10.1016/j.ymthe.2020.10.008 · Cited by 106
Reprogramming the tumor microenvironment by genome editing for precision cancer therapy
Liu, K., Cui, J., Zhan, Y., Ouyang, Q., Lu, Q., Yang, D., Li, X., & Yin, J. (2022) · Molecular Cancer · doi:10.1186/s12943-022-01561-5 · Cited by 100
Elahi, R., Heydari, A. H., Hadiloo, K., & Esmaeilzadeh, A. (2021) · Stem Cell Reviews and Reports · doi:10.1007/s12015-021-10246-3 · Cited by 95
Advancing cell-based cancer immunotherapy through stem cell engineering
Li, Y.-R., Dunn, Z. S., Yu, Y., Li, M., Wang, P., & Yang, L. (2023) · Cell stem cell · doi:10.1016/j.stem.2023.02.009 · Cited by 95
Xie, B., Li, Z., Zhou, J., & Wang, W. (2022) · Cancers · doi:10.3390/cancers14133230 · Cited by 97
Universal redirection of CAR T cells against solid tumours via membrane-inserted ligands for the CAR
Zhang, A. Q., Hostetler, A., Chen, L. E., Mukkamala, V., Abraham, W. D., Padilla, L. T., Wolff, A. N., Maiorino, L., Backlund, C. M., Aung, A., et al. (2023) · Nature Biomedical Engineering · doi:10.1038/s41551-023-01048-8 · Cited by 93
Multiple myeloma: signaling pathways and targeted therapy
Lu, Q., Yang, D., Li, H., Niu, T., & Tong, A. (2024) · Molecular biomedicine · doi:10.1186/s43556-024-00188-w · Cited by 90
Chuntova, P., Chow, F. E., Watchmaker, P. B., Galvez, M., Heimberger, A. B., Newell, E. W., Diaz, A. A., DePinho, R. A., Li, M. O., Wherry, E. J., et al. (2020) · Neuro-Oncology · doi:10.1093/neuonc/noaa277 · Cited by 89
Self-citationDeterminants of Response and Mechanisms of Resistance of CAR T-cell Therapy in Multiple Myeloma
van de Donk, N. W. C. J., Themeli, M., & Usmani, S. Z. (2021) · Blood Cancer Discovery · doi:10.1158/2643-3230.bcd-20-0227 · Cited by 90
CAR T-Cells in Multiple Myeloma: State of the Art and Future Directions
Rodríguez‐Lobato, L. G., Ganzetti, M., de Larrea, C. F., Hudecek, M., Einsele, H., & Danhof, S. (2020) · Frontiers in Oncology · doi:10.3389/fonc.2020.01243 · Cited by 88
Multiple Myeloma Therapy: Emerging Trends and Challenges
Dima, D., Jiang, D., Singh, D. J., Hasipek, M., Shah, H., Ullah, F., Khouri, J., Maciejewski, J. P., & Jha, B. K. (2022) · Cancers · doi:10.3390/cancers14174082 · Cited by 92
Khan, S. H., Choi, Y., Veena, M. S., Lee, J. K., & Shin, D. S. (2025) · Frontiers in Immunology · doi:10.3389/fimmu.2024.1489827 · Cited by 84
Hou, A. J., Shih, R. M., Uy, B. R., Shafer, A. M., Chang, Z. L., Comin-Anduix, B., Güemes, M., Galić, Z., Phyu, S. M., Okada, H., et al. (2024) · Neuro-Oncology · doi:10.1093/neuonc/noae126 · Cited by 81
Self-citationAntibody variable region engineering for improving cancer immunotherapy
Lou, H., & Cao, X. (2022) · 癌症:英文版 · doi:10.1002/cac2.12330 · Cited by 78
Bispecific CS1-BCMA CAR-T cells are clinically active in relapsed or refractory multiple myeloma
Li, C., Xu, J. L., Luo, W., Liao, D., Xie, W., Wei, Q., Zhang, Y., Wang, X., Wu, Z., Kang, Y. J., et al. (2023) · Leukemia · doi:10.1038/s41375-023-02065-x · Cited by 74
Self-citationOuyang, W., Jin, S., Xu, N., Liu, W.-Y., Zhao, H. Q., Zhang, L., Kang, L., Tao, Y., Liu, Y., Wang, Y., et al. (2024) · Journal for ImmunoTherapy of Cancer · doi:10.1136/jitc-2023-008429 · Cited by 71
Tandem CAR-T cell therapy: recent advances and current challenges
Gómez-Melero, S., Hassouneh, F., Vallejo-Bermúdez, I. M., Agüera, E., Solana, R., & Caballero‐Villarraso, J. (2025) · Frontiers in Immunology · doi:10.3389/fimmu.2025.1546172 · Cited by 69
Zhou, D., Sun, Q., Xia, J., Gu, W., Qian, J., Zhuang, W., Yan, Z., Cheng, H., Chen, W., Zhu, F., et al. (2024) · The Lancet Haematology · doi:10.1016/s2352-3026(24)00176-5 · Cited by 69
Li, W., Zhang, B., Cao, W., Zhang, W., Li, T., Liu, L., Xu, L., Gao, F., Wang, Y., Wang, F., et al. (2023) · Experimental Hematology and Oncology · doi:10.1186/s40164-023-00402-5 · Cited by 66
Two for one: targeting BCMA and CD19 in B-cell malignancies with off-the-shelf dual-CAR NK-92 cells
Roex, G., Campillo-Davó, D., Flumens, D., Shaw, P. A. G., Krekelbergh, L., Reu, H. D., Berneman, Z. N., Lion, E., & Anguille, S. (2022) · Journal of Translational Medicine · doi:10.1186/s12967-022-03326-6 · Cited by 62
Nanobodies in cell-mediated immunotherapy: On the road to fight cancer
Maali, A., Gholizadeh, M., Feghhi-Najafabadi, S., Noei, A., Seyed-Motahari, S. S., Mansoori, S., & Sharifzadeh, Z. (2023) · Frontiers in Immunology · doi:10.3389/fimmu.2023.1012841 · Cited by 62
BCMA in Multiple Myeloma—A Promising Key to Therapy
Kleber, M., Ntanasis‐Stathopoulos, I., & Terpos, E. (2021) · Journal of Clinical Medicine · doi:10.3390/jcm10184088 · Cited by 63
Mueller, K. P., Piscopo, N. J., Forsberg, M. H., Saraspe, L. A., Das, A., Russell, B., Smerchansky, M. E., Cappabianca, D., Shi, L., Shankar, K., et al. (2022) · Journal for ImmunoTherapy of Cancer · doi:10.1136/jitc-2021-004446 · Cited by 62
The antigen‐binding moiety in the driver's seat of CARs
Hanssens, H., Meeus, F., Veirman, K. D., Breckpot, K., & Devoogdt, N. (2021) · Medicinal Research Reviews · doi:10.1002/med.21818 · Cited by 63
Engineering chimeric antigen receptor T cells for solid tumour therapy
Liu, L., Qu, Y., Cheng, L., Yoon, C. W., He, P., Monther, A., Guo, T., Chittle, S. J., & Wang, Y. (2022) · Clinical and Translational Medicine · doi:10.1002/ctm2.1141 · Cited by 61
Camviel, N., Wolf, B., Croce, G., Gfeller, D., Zoete, V., & Arber, C. (2022) · Journal for ImmunoTherapy of Cancer · doi:10.1136/jitc-2022-005091 · Cited by 57
Bispecific BCMA/CD24 CAR-T cells control multiple myeloma growth
Sun, F., Cheng, Y., Wanchai, V., Guo, W., Mery, D. E., Xu, H., Gai, D., Siegel, E. R., Bailey, C., Ashby, C., et al. (2024) · Nature Communications · doi:10.1038/s41467-024-44873-4 · Cited by 55
Bispecific Chimeric Antigen Receptor T Cell Therapy for B Cell Malignancies and Multiple Myeloma
Cronk, R. J., Zurko, J. C., & Shah, N. N. (2020) · Cancers · doi:10.3390/cancers12092523 · Cited by 53
Immunotherapy for the treatment of multiple myeloma
Boussi, L. S., Avigan, Z. M., & Rosenblatt, J. M. (2022) · Frontiers in Immunology · doi:10.3389/fimmu.2022.1027385 · Cited by 48
Zhou, X., Rasche, L., Kortüm, K. M., Danhof, S., Hudecek, M., & Einsele, H. (2020) · Frontiers in Immunology · doi:10.3389/fimmu.2020.620312 · Cited by 49
Precision off-the-shelf natural killer cell therapies for oncology with logic-gated gene circuits
Frankel, N. W., Deng, H., Yucel, G., Gainer, M., Leemans, N., Lam, A., Li, Y., Hung, M. E., Lee, D., Lee, C.-T., et al. (2024) · Cell Reports · doi:10.1016/j.celrep.2024.114145 · Cited by 49
Dahlhoff, J., Manz, H., Steinfatt, T., Tascon, J. D., Seebacher, E., Schneider, T., Wilnit, A., Mokhtari, Z., Tabares, P., Böckle, D., et al. (2021) · Leukemia · doi:10.1038/s41375-021-01422-y · Cited by 46
Immunotargeting of Cancer Stem Cells
Köseer, A. S., Gaetano, S. D., Arndt, C., Bachmann, M. P., & Dubrovska, A. (2023) · Cancers · doi:10.3390/cancers15051608 · Cited by 47
Dual Targeting with CAR T Cells to Limit Antigen Escape in Multiple Myeloma
Simon, S., & Riddell, S. R. (2020) · Blood Cancer Discovery · doi:10.1158/2643-3230.bcd-20-0122 · Cited by 45
Self-regulating CAR-T cells modulate cytokine release syndrome in adoptive T-cell therapy
Lin, M.-Y., Nam, E., Shih, R. M., Shafer, A., Bouren, A., Ceja, M. A., Harris, C. M., Khericha, M., Vo, K., Kim, M., et al. (2024) · The Journal of Experimental Medicine · doi:10.1084/jem.20221988 · Cited by 48
Self-citationNovel antigens of CAR T cell therapy: New roads; old destination
Kozani, P. S., Kozani, P. S., & Rahbarizadeh, F. (2021) · Translational Oncology · doi:10.1016/j.tranon.2021.101079 · Cited by 45
Guo, Z., Tu, S., Yu, S., Wu, L., Pan, W., Chang, N., Zhou, X., Song, C., Li, Y., & He, Y. (2021) · Cancer Science · doi:10.1111/cas.14799 · Cited by 45
Jiang, D., Huang, H., Qin, H., Tang, K., Shi, X., Zhu, T., Gao, Y., Zhang, Y., Tian, X., Fu, J., et al. (2023) · Nature Communications · doi:10.1038/s41467-023-39395-4 · Cited by 42
Natural killer cell-based cancer immunotherapy: from basics to clinical trials
Shi, Y., Hao, D., Qian, H., & Tao, Z. (2024) · Experimental Hematology and Oncology · doi:10.1186/s40164-024-00561-z · Cited by 41
Wang, X., Dong, Z., Awuah, D., Chang, W.-C., Cheng, W. A., Vyas, V., Cha, S.-C., Anderson, A., Zhang, T., Wang, Z., et al. (2022) · Leukemia · doi:10.1038/s41375-021-01477-x · Cited by 41
Self-citationEngineering Next-Generation CAR-T Cells: Overcoming Tumor Hypoxia and Metabolism
Gao, T. A., & Chen, Y. Y. (2022) · Annual Review of Chemical and Biomolecular Engineering · doi:10.1146/annurev-chembioeng-092120-092914 · Cited by 41
Self-citationCAR-T-Cell Therapy in Multiple Myeloma: B-Cell Maturation Antigen (BCMA) and Beyond
Mishra, A. K., Gupta, A., Dagar, G., Das, D., Chakraborty, A., Haque, S., Prasad, C. P., Singh, A. K., Bhat, A. A., Macha, M. A., et al. (2023) · Vaccines · doi:10.3390/vaccines11111721 · Cited by 40
Qin, H., Zhou, Z., Shi, R., Mai, Y., Xu, Y., Fu, P., Cheng, G., Zhang, Z., Chen, W., Chen, Y., et al. (2025) · Journal of Hematology & Oncology · doi:10.1186/s13045-025-01701-6 · Cited by 43
Self-citationPromising Antigens for the New Frontier of Targeted Immunotherapy in Multiple Myeloma
Cho, S., Xing, L., Anderson, K. C., & Tai, Y. (2021) · Cancers · doi:10.3390/cancers13236136 · Cited by 41
Neri, P., Leblay, N., Lee, H., Gullà, A., Bahlis, N. J., & Anderson, K. C. (2024) · Nature Reviews Clinical Oncology · doi:10.1038/s41571-024-00913-y · Cited by 38
Liu, S., Zhang, X., Dai, H., Cui, W., Yin, J., Li, Z., Xiao, Y., Yang, C., Xue, S., Qiu, H., et al. (2023) · Blood Cancer Journal · doi:10.1038/s41408-023-00819-5 · Cited by 37
What is the future of immunotherapy in multiple myeloma?
Rasche, L., Hudecek, M., & Einsele, H. (2020) · Blood · doi:10.1182/blood.2019004176 · Cited by 35
García‐Guerrero, E., Rodríguez‐Lobato, L. G., Sierro-Martínez, B., Danhof, S., Bates, S., Frenz, S., Härtle, L., Götz, R., Sauer, M., Rasche, L., et al. (2022) · Haematologica · doi:10.3324/haematol.2022.281339 · Cited by 35
Synthetic Biology in the Engineering of CAR-T and CAR-NK Cell Therapies: Facts and Hopes
Clubb, J. D., Gao, T. A., & Chen, Y. Y. (2022) · Clinical Cancer Research · doi:10.1158/1078-0432.ccr-22-1491 · Cited by 35
Self-citationNovel BCMA-OR-CD38 tandem-dual chimeric antigen receptor T cells robustly control multiple myeloma
Feng, Y., Liu, X., Li, X., Zhou, Y., Song, Z., Zhang, J., Shi, B., & Wang, J. (2021) · OncoImmunology · doi:10.1080/2162402x.2021.1959102 · Cited by 35
CAR‐T‐cell products in solid tumors: Progress, challenges, and strategies
Qian, K., Li, G., Zhang, S., Fu, W., Li, T., Zhao, J., Lei, C., Wang, Y., & Hu, S. (2024) · Interdisciplinary medicine · doi:10.1002/inmd.20230047 · Cited by 36
Future of CAR T cells in multiple myeloma
Wudhikarn, K., Mailankody, S., & Smith, E. L. (2020) · Hematology · doi:10.1182/hematology.2020000111 · Cited by 35
Engineering CAR T cells for enhanced efficacy and safety
Wu, Y., Huang, Z., Harrison, R. E. S., Liu, L., Zhu, L., Situ, Y., & Wang, Y. (2022) · APL Bioengineering · doi:10.1063/5.0073746 · Cited by 34
Immunotherapy approaches for hematological cancers
Lanier, O. L., Pérez‐Herrero, E., Andrea, A. P. D. ’., Bahrami, K., Lee, E. Y. P., Ward, D. M., Ayala-Suárez, N., Rodríguez-Méndez, S. M., & Peppas, N. A. (2022) · iScience · doi:10.1016/j.isci.2022.105326 · Cited by 36
Tedder, B., & Bhutani, M. (2025) · Cells · doi:10.3390/cells14141077 · Cited by 33
Overcoming solid-tumor barriers: armored CAR-T cell therapy
Kwon, N., & Chen, Y. Y. (2025) · Trends in cancer · doi:10.1016/j.trecan.2025.08.009 · Cited by 33
Self-citationNovellis, D. D., Fontana, R., Giudice, V., Serio, B., & Selleri, C. (2022) · International Journal of Molecular Sciences · doi:10.3390/ijms24010645 · Cited by 34
Nanobody-armed T cells endow CAR-T cells with cytotoxicity against lymphoma cells
Wang, H., Wang, L., Li, Y., Li, G., Zhang, X., Jiang, D., Zhang, Y.-T. Y., Liu, L., Chu, Y., & Xu, G. (2021) · Cancer Cell International · doi:10.1186/s12935-021-02151-z · Cited by 31
Zhou, J., Shi, F., Luo, X., Lei, B., Shi, Z., Huang, C., Zhang, Y., Li, X., Wang, H., Li, X.-Y., et al. (2023) · International Immunopharmacology · doi:10.1016/j.intimp.2023.111239 · Cited by 29
Leung, I., Templeton, M. L., Lo, Y., Rajan, A., Stull, S. M., Garrison, S. M., Salter, A. I., Smythe, K. S., Correnti, C., Srivastava, S., et al. (2022) · Blood Advances · doi:10.1182/bloodadvances.2022008559 · Cited by 28
Zhang, C., & Liu, H. (2025) · Journal of Immunology Research · doi:10.1155/jimr/5845167 · Cited by 27
On the road to eliminating long‐lived plasma cells—“are we there yet?”
Markmann, C., & Bhoj, V. G. (2021) · Immunological Reviews · doi:10.1111/imr.13015 · Cited by 27
Xiao, X., Wang, Y., Zou, Z., Yang, Y., Wang, X., Xin, X., Tu, S., & Li, Y. (2022) · Frontiers in Immunology · doi:10.3389/fimmu.2022.954235 · Cited by 28
Self-citationPeptide-scFv antigen recognition domains effectively confer CAR T cell multiantigen specificity
Zoine, J. T., Immadisetty, K., Ibañez-Vega, J., Moore, S. E., Nevitt, C. D., Thanekar, U., Tian, L., Karouni, A., Chockley, P. J., Arthur, B., et al. (2024) · Cell Reports Medicine · doi:10.1016/j.xcrm.2024.101422 · Cited by 24
Targeting GPRC5D for multiple myeloma therapy
Zhou, D., Wang, Y., Chen, C., Li, Z., Xu, K., & Zhao, K. (2024) · Journal of Hematology & Oncology · doi:10.1186/s13045-024-01611-z · Cited by 23
Hematopoeitic Cell Transplantation and CAR T-Cell Therapy: Complements or Competitors?
Goldsmith, S. R., Ghobadi, A., & DiPersio, J. F. (2020) · Frontiers in Oncology · doi:10.3389/fonc.2020.608916 · Cited by 25
Salas‐Benito, D., Birocchi, F., Park, S., Ho, C. E., Armstrong, A., Parker, A., Bouffard, A. A., Frank, J. A., Kim, E., Kienka, T., et al. (2025) · Journal for ImmunoTherapy of Cancer · doi:10.1136/jitc-2025-012822 · Cited by 22
Current progress in CAR‑T cell therapy for tumor treatment (Review)
Chen, L., Xie, T., Wei, B., & Di, D.-L. (2022) · Oncology Letters · doi:10.3892/ol.2022.13478 · Cited by 25
Guan, M., Lim, L., Holguin, L., Han, T., Vyas, V., Urak, R., Miller, A., Browning, D. L., Echavarria, L., Li, S., et al. (2022) · Molecular Therapy - Methods & Clinical Development · doi:10.1016/j.omtm.2022.04.007 · Cited by 21
Self-citationSimon, S., Bugos, G., Prins, R., Rajan, A., Palani, A., Heyer, K., Stevens, A., Zeng, L., Thompson, K. A., Atilla, P. A., et al. (2025) · Nature Cancer · doi:10.1038/s43018-025-00927-0 · Cited by 21
Anderson, G. S. F., & Chapman, M. A. (2024) · Molecular Therapy · doi:10.1016/j.ymthe.2024.07.028 · Cited by 20
Challenges and optimal strategies of CAR T therapy for hematological malignancies
Zhang, Y., Yang, X., Dang, X., Zhu, Z., Qian, W., Liang, A., & Han, W. (2023) · Chinese Medical Journal · doi:10.1097/cm9.0000000000002476 · Cited by 19
BCMA/CD47-directed universal CAR-T cells exhibit excellent antitumor activity in multiple myeloma
Lu, Q., Li, H., Wu, Z., Zhu, Z., Zhang, Z., Yang, D., & Tong, A. (2024) · Journal of Nanobiotechnology · doi:10.1186/s12951-024-02512-6 · Cited by 19
Immunotherapy of Multiple Myeloma: Promise and Challenges
Abramson, H. N. (2021) · ImmunoTargets and Therapy · doi:10.2147/itt.s306103 · Cited by 19
Rational Protein Design Yields a CD20 CAR with Superior Antitumor Efficacy Compared with CD19 CAR
Chen, X., Chen, L. C., Khericha, M., Meng, X., Salvestrini, E., Shafer, A., Iyer, N., Alag, A. S., Ding, Y., Nicolaou, D. M., et al. (2022) · Cancer Immunology Research · doi:10.1158/2326-6066.cir-22-0504 · Cited by 20
Self-citationResistance and recurrence of malignancies after CAR-T cell therapy
Zeng, W., & Zhang, P. (2021) · Experimental Cell Research · doi:10.1016/j.yexcr.2021.112971 · Cited by 18
Progress and prospect of ASCT combined with CAR-T therapy in the treatment of multiple myeloma
Yuan, S., Chen, Y., & Liu, H. (2024) · Therapeutic Advances in Hematology · doi:10.1177/20406207241237594 · Cited by 19
Self-citationBeyond BCMA: the next wave of CAR T cell therapy in multiple myeloma
Miller, K. C., Hashmi, H., & Rajeeve, S. (2024) · Frontiers in Oncology · doi:10.3389/fonc.2024.1398902 · Cited by 19
Moving Toward a Cure for Myeloma
Mateos, M., Nooka, A. K., & Larson, S. M. (2022) · American Society of Clinical Oncology Educational Book · doi:10.1200/edbk_349603 · Cited by 20
Metadata
- Authors
- Zah, E., Nam, E., Bhuvan, V., Tran, U., Ji, B. Y., Gosliner, S. B., Wang, X., Brown, C. E., & Chen, Y. Y.
- Affiliations
- Amgen (United States) (US)
- University of California, Los Angeles (US)
- City Of Hope National Medical Center (US)
- Corresponding author
- Chen, Yvonne Y.
- Venue
- Nature Communications
- Published
- 2020-05-08
- Volume
- 11
- Issue
- 1
- Pages
- 2283-2283
- ISSN
- 2041-1723 (ISSN-L)
- PMC
- PMC7210316
- OpenAlex
- W3022509419
- Cited by
- 222
- References
- 51
- Citations by year
- 2026: 20 · 2025: 25 · 2024: 52 · 2023: 25 · 2022: 47 · 2021: 37 · 2020: 14
- FWCI
- 11.10
- Type
- journal article
- Language
- en
- Open access
- gold
- doi.org
- Locations
- Nature Communications (publishedVersion, cc-by)
- bioRxiv (Cold Spring Harbor Laboratory) (acceptedVersion)
- PubMed Central (publishedVersion, cc-by)
- PubMed (publishedVersion)
- eScholarship (California Digital Library) (submittedVersion, cc-by)
- RePEc: Research Papers in Economics (submittedVersion)
- DOAJ (DOAJ: Directory of Open Access Journals) (submittedVersion, cc-by-sa)
- eScholarship (California Digital Library) (submittedVersion)
- Funders
- UC | University of California, Los Angeles
- Topics
- Health Sciences › Medicine › Oncology › CAR-T cell therapy research
- Life Sciences › Immunology and Microbiology › Immunology › Immunotherapy and Immune Responses
- Health Sciences › Medicine › Hematology › Multiple Myeloma Research and Treatments
- Keywords
- bispecific CAR T cells, BCMA, CS1, multiple myeloma, chimeric antigen receptor, antigen escape, tumor recurrence, anti-PD-1 combination therapy, tumor rechallenge
- MeSH terms
- Gene Editing, Receptors, Chimeric Antigen, Antigens, Neoplasm, Cytotoxicity, Immunologic, Humans, Immunologic Memory, Multiple Myeloma, T-Lymphocytes, Immunotherapy, Adoptive, K562 Cells, B-Cell Maturation Antigen, Programmed Cell Death 1 Receptor
About these checks
Registry, retraction, Cites and statistics results are computed, not judged, with one exception: a printed reference that no index lists is read once by a model before it counts as a citation error. Claims are extracted by a model and kept only when their quote appears verbatim in the text; each cited source is then checked, with a model’s help, for whether it says what the claim relies on. Those verdicts can be wrong — read the claim’s quote and the cited source before relying on one.
Statistics and arithmetic are recomputed, not judged.
Confidence bands are shown only for fields calibrated on our annotated test set. None is calibrated yet, so no band is shown.
What counts as a claim ›How we measure confidence ›How we check this ›
Are you an author, or do you see a problem with this page? Request a review
