

The DOI matches its Crossref record; 68 of the 69 references it cites were found in a registry or an index.
Robust leaf trait relationships across species under global environmental changes
Open accessAbstract
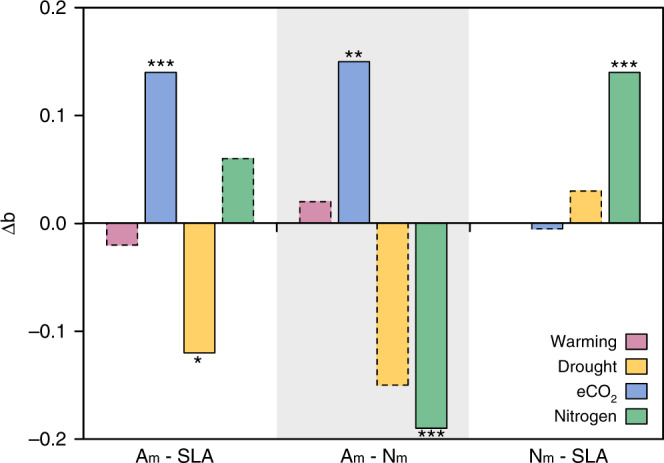
Recent studies show coordinated relationships between plant leaf traits and their capacity to predict ecosystem functions. However, how leaf traits will change within species and whether interspecific trait relationships will shift under future environmental changes both remain unclear. Here, we examine the bivariate correlations between leaf economic traits of 515 species in 210 experiments which mimic climate warming, drought, elevated CO 2 , and nitrogen deposition. We find divergent directions of changes in trait-pairs between species, and the directions mostly do not follow the interspecific trait relationships. However, the slopes in the logarithmic transformed interspecific trait relationships hold stable under environmental changes, while only their elevations vary. The elevation changes of trait relationship are mainly driven by asymmetrically interspecific responses contrary to the direction of the leaf economic spectrum. These findings suggest robust interspecific trait relationships under global changes, and call for linking within-species responses to interspecific coordination of plant traits.
Overview
The claims and statistics of this paper haven’t been checked yet.
Run the check — free, no account needed. It reads the open-access text and checks the sources it cites.
Integrity signals
Registry
Cites
Statistics
Figures
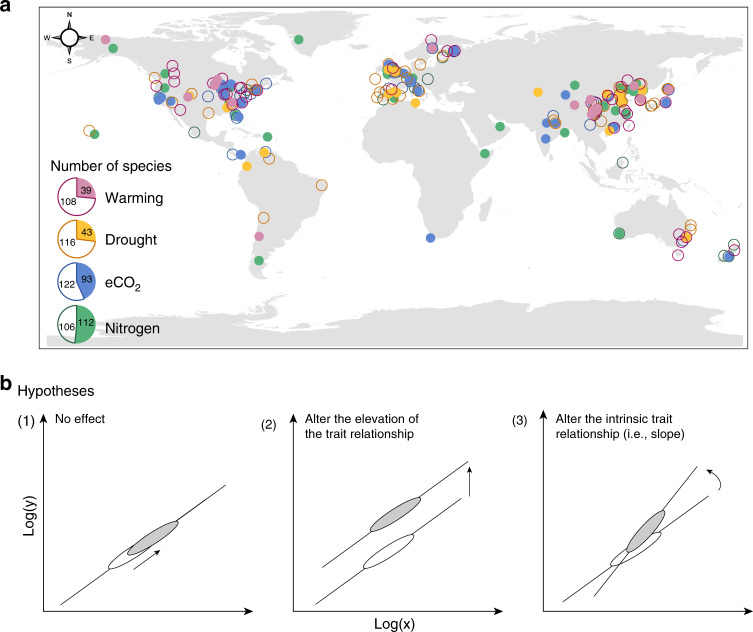
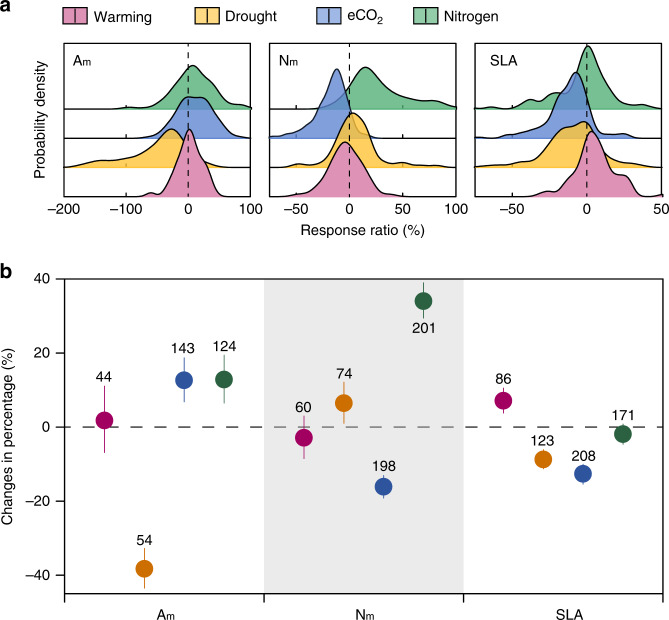
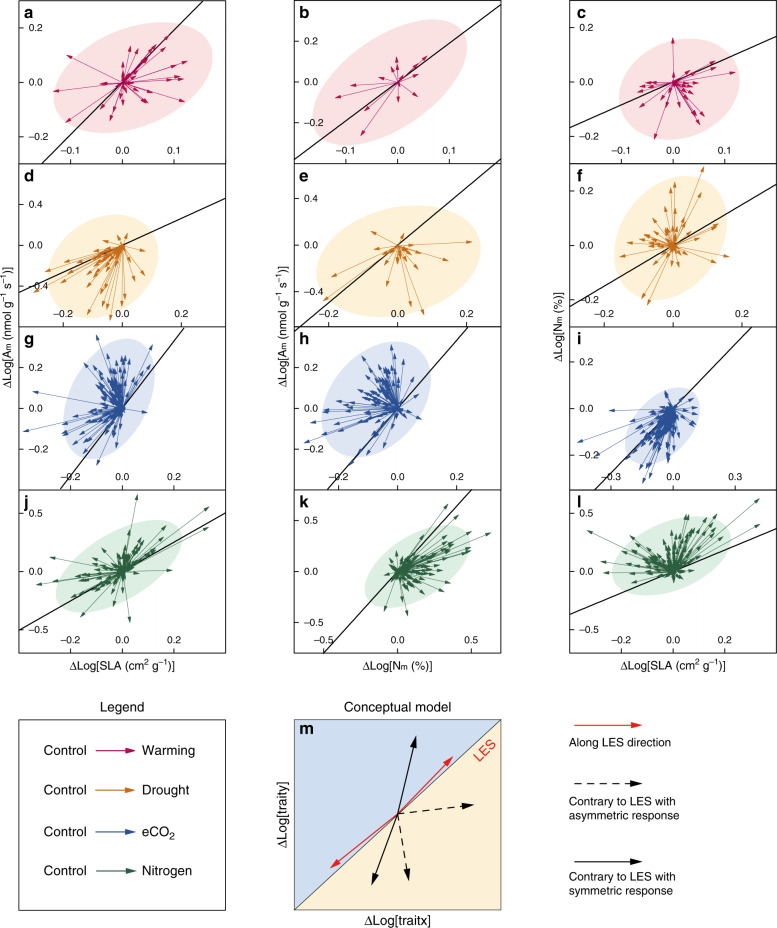
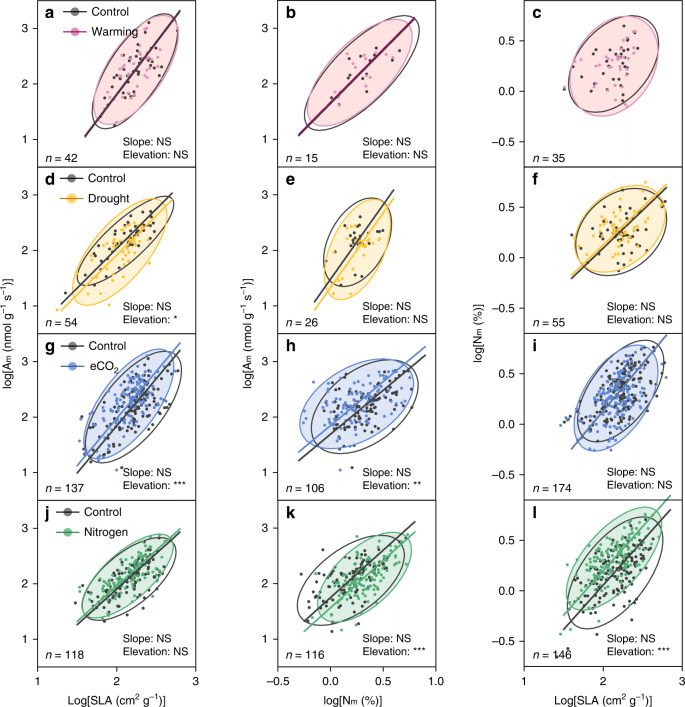
Verification
Claims the paper makes
The claims and statistics of this paper haven’t been checked yet.
Run the check — free, no account needed. It reads the open-access text and checks the sources it cites.
Claims other papers make about this one
Each is checked against this paper’s own text: does it say what the citing paper says it does?
In the citing paper
“Furthermore, the parameter settings of HVG selection and PCA in these methods are far to reach a consensus and inevitably introduce artificial bias for performance evaluation 15- 19 .”
From scBERT as a Large-scale Pretrained Deep Language Model for Cell Type Annotation of Single-cell RNA-seq Data (2021) · cites this paper as [19]
In the citing paper
“Furthermore, the parameter settings of HVG selection and PCA in these methods are far to reach a consensus and inevitably introduce artificial bias for performance evaluation 15- 19 .”
From scBERT as a Large-scale Pretrained Deep Language Model for Cell Type Annotation of Single-cell RNA-seq Data (2021) · cites this paper as [17]
In the citing paper
“Selecting HVGs ignores co-occurrence and biological interaction of genes (especially HVG and non-HVG), which are useful for cell type annotation 20 .”
From scBERT as a Large-scale Pretrained Deep Language Model for Cell Type Annotation of Single-cell RNA-seq Data (2021) · cites this paper as [20]
Self-check
Percentages, sums and reported differences re-computed from the paper’s own numbers.
The self-check needs the paper’s full text.
Citations
Cites
The worldwide leaf economics spectrum
Wright, I. J., Reich, P. B., Westoby, M., Ackerly, D. D., Baruch, Z., Bongers, F., Cavender-Bares, J., Chapin, T., Cornelissen, J. H. C., Diemer, M., et al. (2004) · Nature · doi:10.1038/nature02403 · Cited by 9,021
The meta-analysis of response ratios in experimental ecology
Hedges, L. V., Gurevitch, J., & Curtis, P. S. (1999) · Ecology · doi:10.1890/0012-9658(1999)080[1150:tmaorr]2.0.co;2 · Cited by 4,704
The world‐wide ‘fast–slow’ plant economics spectrum: a traits manifesto
Reich, P. B. (2014) · Journal of Ecology · doi:10.1111/1365-2745.12211 · Cited by 4,209
Ainsworth, E. A., & Long, S. P. (2005) · New Phytologist · doi:10.1111/j.1469-8137.2004.01224.x · Cited by 3,624
The global spectrum of plant form and function
Díaz, S., Kattge, J., Cornelissen, J. H. C., Wright, I. J., Lavorel, S., Dray, S., Reu, B., Kleyer, M., Wirth, C., Prentice, I. C., et al. (2015) · Nature · doi:10.1038/nature16489 · Cited by 3,516
Causes and consequences of variation in leaf mass per area (LMA): a meta‐analysis
Poorter, H., Niinemets, Ü., Poorter, L., Wright, I. J., & Villar, R. (2009) · New Phytologist · doi:10.1111/j.1469-8137.2009.02830.x · Cited by 3,019
Assessing the generality of global leaf trait relationships
Wright, I. J., Reich, P. B., Cornelissen, J. H. C., Falster, D. S., Garnier, É., Hikosaka, K., Lamont, B. B., Lee, W., Oleksyn, J., Osada, N., et al. (2005) · New Phytologist · doi:10.1111/j.1469-8137.2005.01349.x · Cited by 2,611
From tropics to tundra: Global convergence in plant functioning
Reich, P. B., Walters, M. B., & Ellsworth, D. S. (1997) · Proceedings of the National Academy of Sciences · doi:10.1073/pnas.94.25.13730 · Cited by 2,443
GCTE-NEWS, Rustad, L. E., Campbell, J. L., Marion, G. M., Norby, R. J., Mitchell, M. J., Hartley, A. E., Cornelissen, J. H. C., & Gurevitch, J. (2001) · Oecologia · doi:10.1007/s004420000544 · Cited by 2,187
Elevated CO2 effects on plant carbon, nitrogen, and water relations: six important lessons from FACE
Leakey, A. D. B., Ainsworth, E. A., Bernacchi, C. J., Rogers, A., Long, S. P., & Ort, D. R. (2009) · Journal of Experimental Botany · doi:10.1093/jxb/erp096 · Cited by 1,678
Cited by
Sorted by citations
Yang, F., Wang, W., Wang, F., Fang, Y., Tang, D., Huang, J., Lu, H., & Yao, J. (2021) · doi:10.1101/2021.12.05.471261 · Cited by 617
Liu, Z., Zhao, M., Zhang, H., Ren, T., Liu, C., & He, N. (2022) · Global Change Biology · doi:10.1111/gcb.16518 · Cited by 124
How woody plants adjust above‐ and below‐ground traits in response to sustained drought
Rowland, L. M., Ramírez‐Valiente, J. A., Hartley, I. P., & Mencuccini, M. (2023) · New Phytologist · doi:10.1111/nph.19000 · Cited by 117
Leaf economics fundamentals explained by optimality principles
Wang, H., Prentice, I. C., Wright, I. J., Warton, D. I., Qiao, S., Xu, X., Zhou, J., Kikuzawa, K., & Stenseth, N. C. (2023) · Science Advances · doi:10.1126/sciadv.add5667 · Cited by 86
Chandler, M. R., Jain, S., Halman, J. R., Hong, E., Dobrovolskaia, M. A., Zakharov, A. V., & Afonin, K. A. (2022) · Small · doi:10.1002/smll.202204941 · Cited by 61
Metadata
- Authors
- Cui, E., Weng, E., Yan, E., & Xia, J.
- Affiliations
- State Key Laboratory of Estuarine and Coastal Research (CN)
- Columbia University (US)
- Corresponding author
- Xia, Jianyang
- Venue
- Nature Communications
- Published
- 2020-06-12
- Volume
- 11
- Issue
- 1
- Pages
- 2999-2999
- ISSN
- 2041-1723 (ISSN-L)
- PMC
- PMC7293315
- OpenAlex
- W3034255665
- Cited by
- 143
- References
- 69
- Citations by year
- 2026: 18 · 2025: 29 · 2024: 33 · 2023: 24 · 2022: 27 · 2021: 10 · 2020: 2
- FWCI
- 10.01
- Type
- journal article
- Language
- en
- Open access
- gold
- doi.org
- Locations
- Nature Communications (publishedVersion, cc-by)
- PubMed Central (publishedVersion, cc-by)
- PubMed (publishedVersion)
- RePEc: Research Papers in Economics (submittedVersion)
- DOAJ (DOAJ: Directory of Open Access Journals) (submittedVersion, cc-by-sa)
- Columbia Academic Commons (Columbia University)
- Funders
- National Natural Science Foundation of China (31722009, 41630528)
- Topics
- Physical Sciences › Environmental Science › Nature and Landscape Conservation › Ecology and Vegetation Dynamics Studies
- Physical Sciences › Environmental Science › Global and Planetary Change › Plant Water Relations and Carbon Dynamics
- Life Sciences › Agricultural and Biological Sciences › Plant Science › Plant responses to elevated CO2
- Keywords
- leaf economic traits, leaf economics spectrum, global warming, drought, elevated CO2, nitrogen deposition, trait coordination, global change, plant functional traits
- MeSH terms
- Algorithms, Carbon Dioxide, Models, Biological, Nitrogen, Phenotype, Plants, Species Specificity, Ecosystem, Plant Leaves, Droughts, Climate Change, Global Warming
About these checks
Registry, retraction, Cites and statistics results are computed, not judged, with one exception: a printed reference that no index lists is read once by a model before it counts as a citation error. Claims are extracted by a model and kept only when their quote appears verbatim in the text; each cited source is then checked, with a model’s help, for whether it says what the claim relies on. Those verdicts can be wrong — read the claim’s quote and the cited source before relying on one.
Statistics and arithmetic are recomputed, not judged.
Confidence bands are shown only for fields calibrated on our annotated test set. None is calibrated yet, so no band is shown.
What counts as a claim ›How we measure confidence ›How we check this ›
Are you an author, or do you see a problem with this page? Request a review
