

The DOI matches its Crossref record; 57 of the 57 references it cites were found in a registry or an index.
A supervised learning framework for chromatin loop detection in genome-wide contact maps
Open accessPublished version of a preprint
Abstract
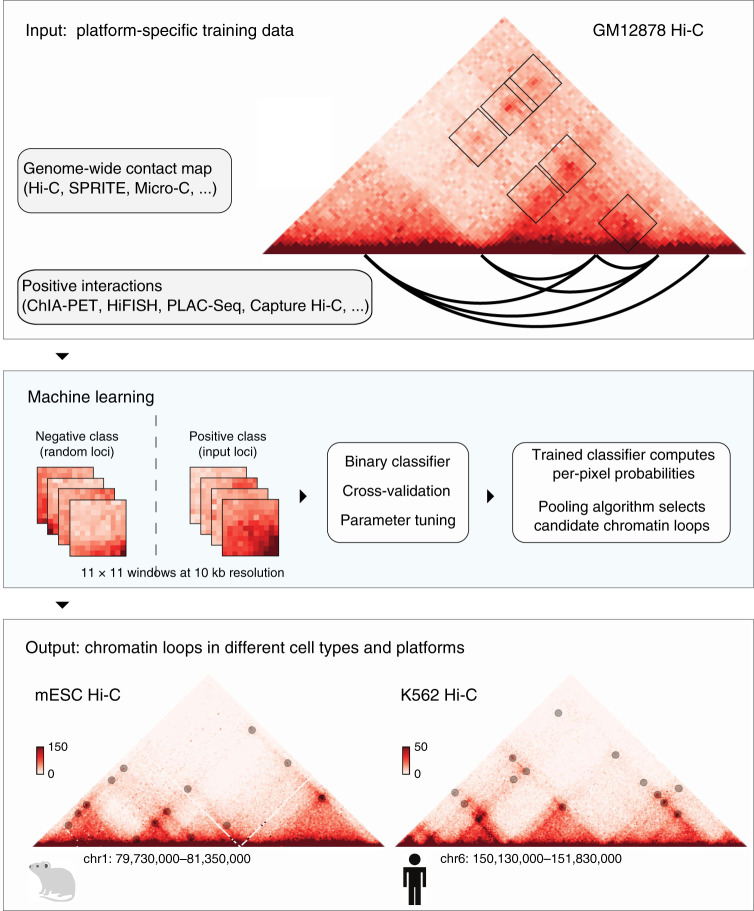
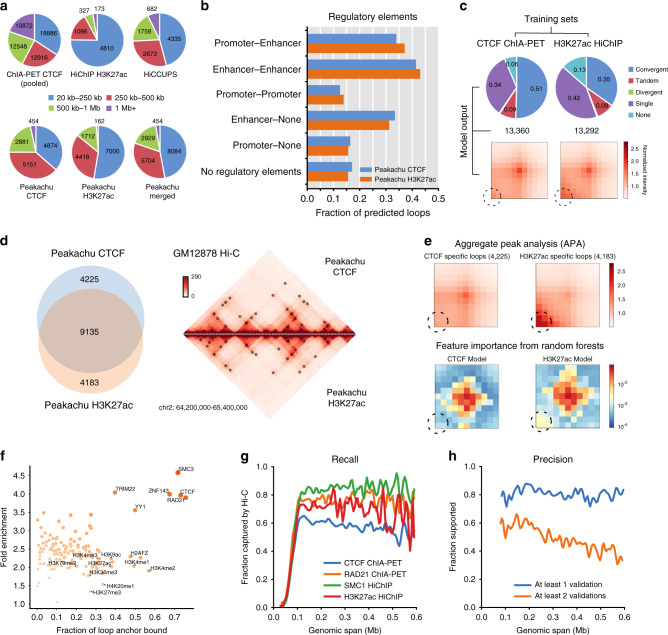
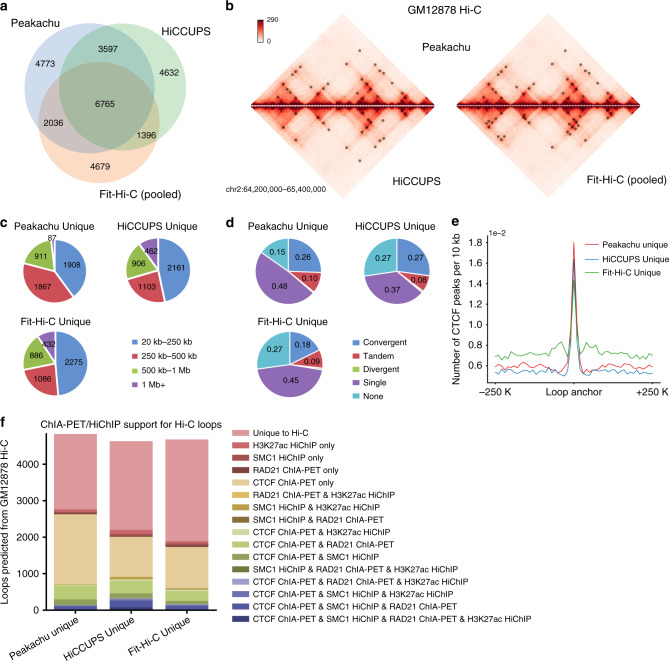
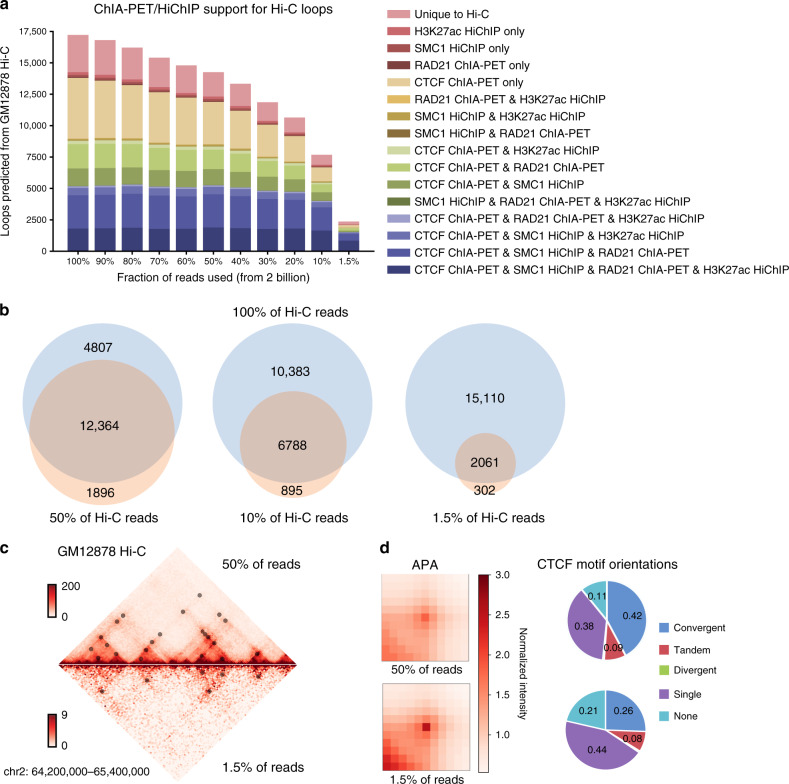
Accurately predicting chromatin loops from genome-wide interaction matrices such as Hi-C data is critical to deepening our understanding of proper gene regulation. Current approaches are mainly focused on searching for statistically enriched dots on a genome-wide map. However, given the availability of orthogonal data types such as ChIA-PET, HiChIP, Capture Hi-C, and high-throughput imaging, a supervised learning approach could facilitate the discovery of a comprehensive set of chromatin interactions. Here, we present Peakachu, a Random Forest classification framework that predicts chromatin loops from genome-wide contact maps. We compare Peakachu with current enrichment-based approaches, and find that Peakachu identifies a unique set of short-range interactions. We show that our models perform well in different platforms, across different sequencing depths, and across different species. We apply this framework to predict chromatin loops in 56 Hi-C datasets, and release the results at the 3D Genome Browser.
Overview
The claims and statistics of this paper haven’t been checked yet.
Run the check — free, no account needed. It reads the open-access text and checks the sources it cites.
Integrity signals
Registry
Cites
Statistics
Figures
Verification
Claims the paper makes
The claims and statistics of this paper haven’t been checked yet.
Run the check — free, no account needed. It reads the open-access text and checks the sources it cites.
Claims other papers make about this one
Each is checked against this paper’s own text: does it say what the citing paper says it does?
In the citing paper
“Peakachu detects loops as CTCF or H3K27ac loops depending on a pre-trained CTCF model or H3K27ac model.”
From Subtype-specific 3D genome alteration in acute myeloid leukaemia (2022) · cites this paper as [27]
In the citing paper
“Peakachu reports a probability score associated with each loop which demarcates confidence of loop calling. The probability score is also positively associated with the loop intensity, making it convenient for differential loop analysis.”
From Subtype-specific 3D genome alteration in acute myeloid leukaemia (2022) · cites this paper as [27]
Self-check
Percentages, sums and reported differences re-computed from the paper’s own numbers.
The self-check needs the paper’s full text.
Citations
Cites
A 3D Map of the Human Genome at Kilobase Resolution Reveals Principles of Chromatin Looping
Rao, S. S. P., Huntley, M. H., Durand, N. C., Stamenova, E. K., Bochkov, I. D., Robinson, J. T., Sanborn, A. L., Machol, I., Omer, A. D., Lander, E. S., et al. (2014) · Cell · doi:10.1016/j.cell.2014.11.021 · Cited by 9,212
Comprehensive Mapping of Long-Range Interactions Reveals Folding Principles of the Human Genome
Lieberman-Aiden, E., van Berkum, N. L., Williams, L., Imakaev, M., Ragoczy, T., Telling, A., Amit, I., Lajoie, B. R., Sabo, P. J., Dorschner, M. O., et al. (2009) · Science · doi:10.1126/science.1181369 · Cited by 8,898
Juicer Provides a One-Click System for Analyzing Loop-Resolution Hi-C Experiments
Durand, N. C., Shamim, M. S., Machol, I., Rao, S. S. P., Huntley, M. H., Lander, E. S., & Aiden, E. L. (2016) · Cell Systems · doi:10.1016/j.cels.2016.07.002 · Cited by 3,860
Capturing Chromosome Conformation
Dekker, J., Rippe, K., Dekker, M., & Kleckner, N. (2002) · Science · doi:10.1126/science.1067799 · Cited by 3,652
ChromHMM: automating chromatin-state discovery and characterization
Ernst, J., & Kellis, M. (2012) · Nature Methods · doi:10.1038/nmeth.1906 · Cited by 2,482
Detection of nonneutral substitution rates on mammalian phylogenies
Pollard, K. S., Hubisz, M. J., Rosenbloom, K. R., & Siepel, A. (2010) · Genome Research · doi:10.1101/gr.097857.109 · Cited by 2,353
Predicting effects of noncoding variants with deep learning–based sequence model
Zhou, J., & Troyanskaya, O. G. (2015) · Nature Methods · doi:10.1038/nmeth.3547 · Cited by 2,338
Formation of chromosomal domains by loop extrusion
Fudenberg, G., Imakaev, M., Lu, C., Goloborodko, A., Abdennur, N., & Mirny, L. A. (2016) · Cell Reports · doi:10.1016/j.celrep.2016.04.085 · Cited by 2,003
Cohesin Loss Eliminates All Loop Domains
Rao, S. S. P., Huang, S.-C., Glenn St Hilaire, B., Engreitz, J. M., Perez, E. M., Kieffer-Kwon, K.-R., Sanborn, A. L., Johnstone, S. E., Bascom, G. D., Bochkov, I. D., et al. (2017) · Cell · doi:10.1016/j.cell.2017.09.026 · Cited by 1,883
An oestrogen-receptor-α-bound human chromatin interactome
Fullwood, M. J., Liu, M. H., Pan, Y. F., Liu, J., Han, X., Mohamed, Y. B., Orlov, Y. L., Velkov, S., Ho, A., Poh, H. M., et al. (2009) · Nature · doi:10.1038/nature08497 · Cited by 1,752
Self-citation
Cited by
Sorted by citations
Glioblastoma evolution and heterogeneity from a 3D whole-tumor perspective
Mathur, R., Wang, Q., Schupp, P. G., Nikolić, A., Hilz, S., Hong, C., Grishanina, N. R., Kwok, D. W., Stevers, N. O., Jin, Q., et al. (2024) · Cell · doi:10.1016/j.cell.2023.12.013 · Cited by 262
Self-citationSubtype-specific 3D genome alteration in acute myeloid leukaemia
Xu, J., Song, F., Lyu, H., Kobayashi, M., Zhang, B., Zhao, Z., Hou, Y., Wang, X., Luan, Y., Jia, B., et al. (2022) · Nature · doi:10.1038/s41586-022-05365-x · Cited by 208
Self-citationWang, X., Xu, J., Zhang, B., Hou, Y., Song, F., Lyu, H., & Yue, F. (2021) · Nature Methods · doi:10.1038/s41592-021-01164-w · Cited by 152
Self-citationDeshpande, A. S., Ulahannan, N., Pendleton, M., Dai, X., Ly, L., Behr, J. M., Schwenk, S., Liao, W., Augello, M. A., Tyer, C., et al. (2022) · Nature Biotechnology · doi:10.1038/s41587-022-01289-z · Cited by 156
iDNA-MS: An Integrated Computational Tool for Detecting DNA Modification Sites in Multiple Genomes
Lv, H., Dao, F., Zhang, D., Guan, Z.-X., Yang, H. Q., Su, W., Liu, M., Ding, H., Chen, W., & Lin, H. (2020) · iScience · doi:10.1016/j.isci.2020.100991 · Cited by 129
Metadata
- Authors
- Salameh, T. J., Wang, X., Song, F., Zhang, B., Wright, S. M., Khunsriraksakul, C., Ruan, Y., & Yue, F.
- Affiliations
- Pennsylvania State University (US)
- Northwestern University (US)
- The Jackson Laboratory for Genomic Medicine (US)
- Corresponding author
- Wang, Xiaotao
- Yue, Feng
- ORCID
- Venue
- Nature Communications
- Published
- 2020-07-09
- Volume
- 11
- Issue
- 1
- Pages
- 3428-3428
- ISSN
- 2041-1723 (ISSN-L)
- PMC
- PMC7347923
- OpenAlex
- W3041895828
- Cited by
- 165
- References
- 57
- Citations by year
- 2026: 26 · 2025: 33 · 2024: 34 · 2023: 32 · 2022: 18 · 2021: 18 · 2020: 4
- FWCI
- 6.33
- Type
- journal article
- Language
- en
- Open access
- gold
- doi.org
- Locations
- Nature Communications (publishedVersion, cc-by)
- bioRxiv (Cold Spring Harbor Laboratory) (acceptedVersion)
- PubMed Central (publishedVersion, cc-by)
- PubMed (publishedVersion)
- RePEc: Research Papers in Economics (submittedVersion)
- DOAJ (DOAJ: Directory of Open Access Journals) (submittedVersion, cc-by-sa)
- The Mouseion at the JAXlibrary (Jackson Laboratory) (submittedVersion)
- Funders
- U.S. Department of Health & Human Services | NIH | National Human Genome Research Institute (R01HG009906)
- U.S. Department of Health & Human Services | NIH | National Institute of General Medical Sciences (R35GM124820)
- U.S. Department of Health & Human Services | NIH | National Institute of Diabetes and Digestive and Kidney Diseases (R24DK106766)
- U.S. Department of Health & Human Services | NIH | NCI | Division of Cancer Epidemiology and Genetics, National Cancer Institute (U01CA200060)
- Topics
- Life Sciences › Biochemistry, Genetics and Molecular Biology › Molecular Biology › Genomics and Chromatin Dynamics
- Life Sciences › Biochemistry, Genetics and Molecular Biology › Genetics › Chromosomal and Genetic Variations
- Life Sciences › Biochemistry, Genetics and Molecular Biology › Molecular Biology › Bioinformatics and Genomic Networks
- Keywords
- Hi-C contact maps, random forest classification, 3D genome organization, gene expression regulation, ChIA-PET, HiChIP, Capture Hi-C
- MeSH terms
- Supervised Machine Learning, Chromatin, Humans, Organ Specificity, Species Specificity, Genome, Sequence Analysis, DNA, K562 Cells, Databases, Genetic
About these checks
Registry, retraction, Cites and statistics results are computed, not judged, with one exception: a printed reference that no index lists is read once by a model before it counts as a citation error. Claims are extracted by a model and kept only when their quote appears verbatim in the text; each cited source is then checked, with a model’s help, for whether it says what the claim relies on. Those verdicts can be wrong — read the claim’s quote and the cited source before relying on one.
Statistics and arithmetic are recomputed, not judged.
Confidence bands are shown only for fields calibrated on our annotated test set. None is calibrated yet, so no band is shown.
What counts as a claim ›How we measure confidence ›How we check this ›
Are you an author, or do you see a problem with this page? Request a review
