

The DOI matches its Crossref record; 44 of the 45 references it cites were found in a registry or an index.
A fast impedance-based antimicrobial susceptibility test
Open accessPublished version of a preprint
Abstract
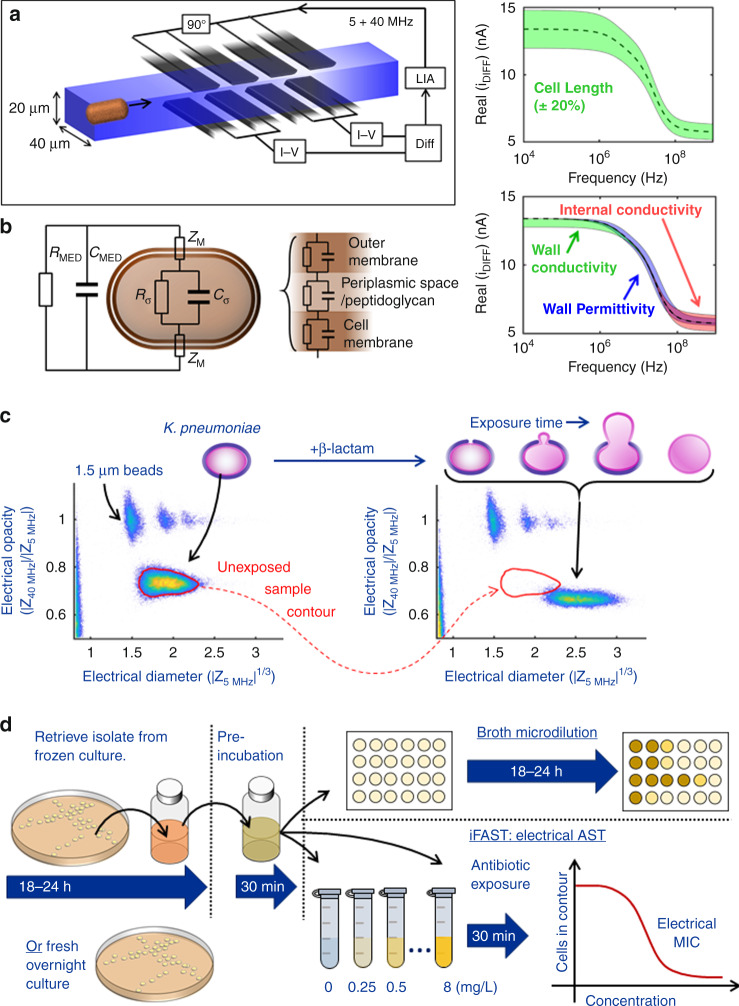
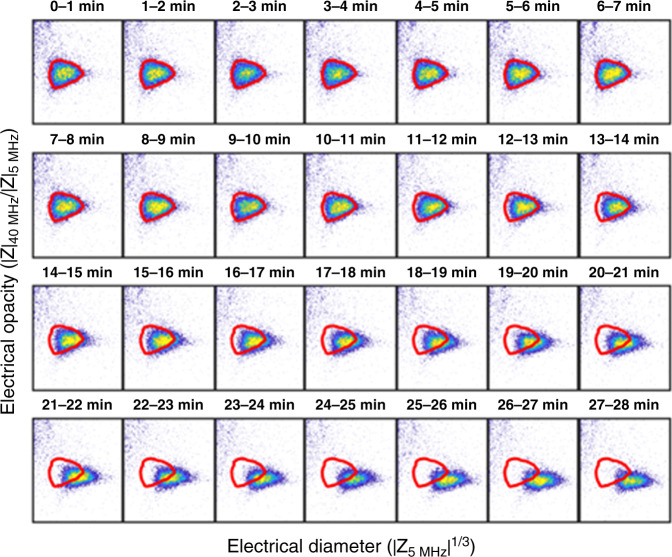
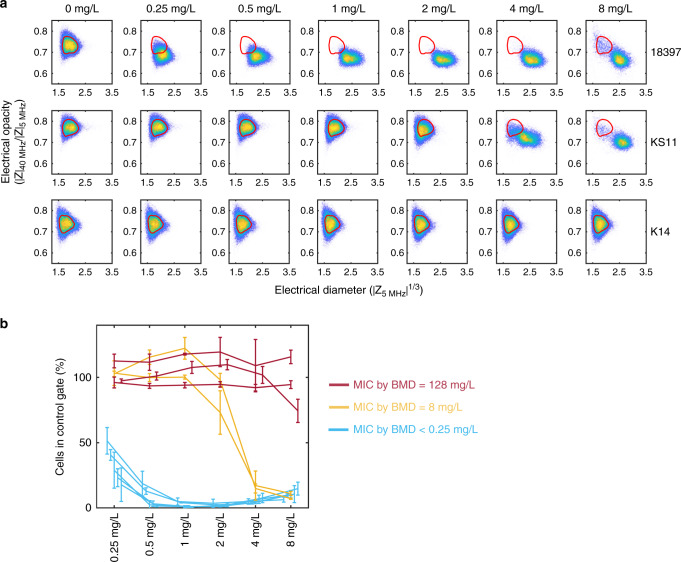
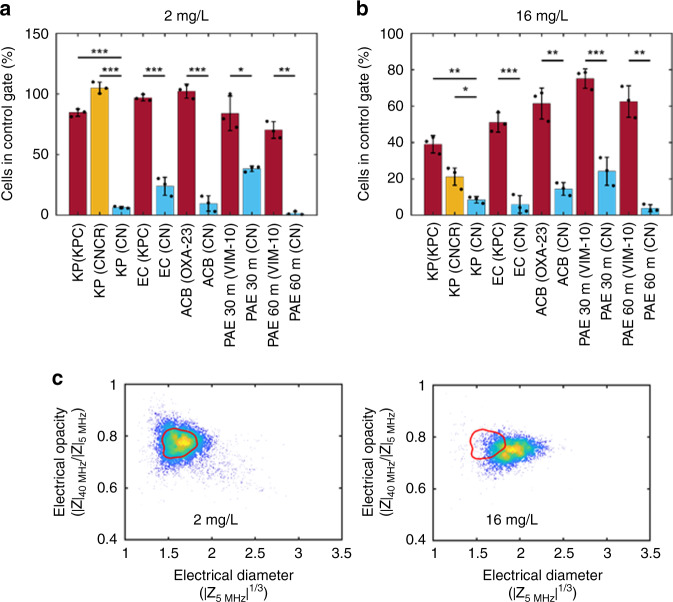
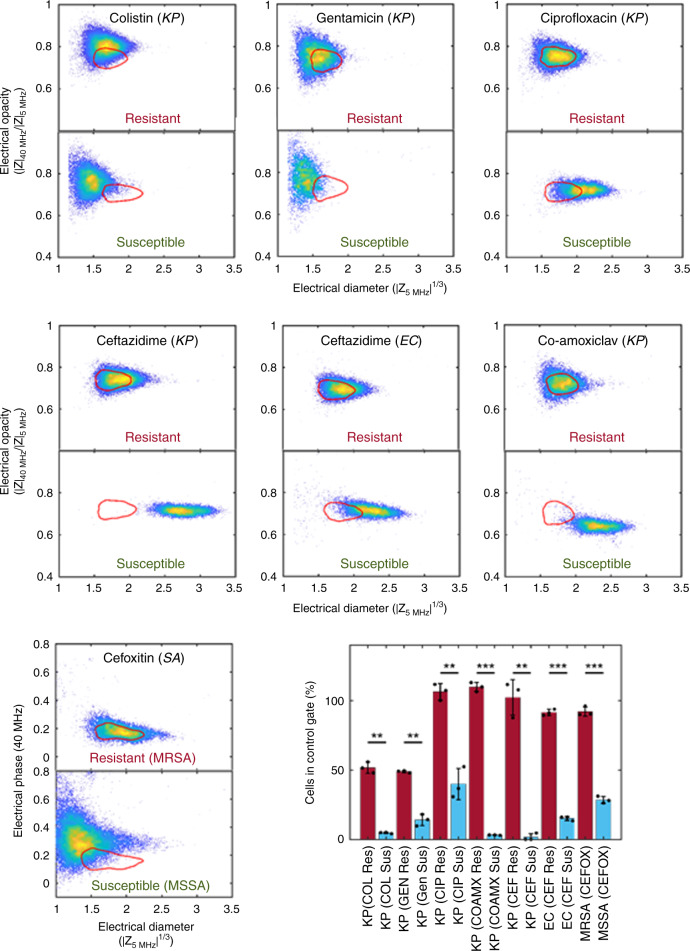
There is an urgent need to develop simple and fast antimicrobial susceptibility tests (ASTs) that allow informed prescribing of antibiotics. Here, we describe a label-free AST that can deliver results within an hour, using an actively dividing culture as starting material. The bacteria are incubated in the presence of an antibiotic for 30 min, and then approximately 10 5 cells are analysed one-by-one with microfluidic impedance cytometry for 2–3 min. The measured electrical characteristics reflect the phenotypic response of the bacteria to the mode of action of a particular antibiotic, in a 30-minute incubation window. The results are consistent with those obtained by classical broth microdilution assays for a range of antibiotics and bacterial species.
Overview
The claims and statistics of this paper haven’t been checked yet.
Run the check — free, no account needed. It reads the open-access text and checks the sources it cites.
Integrity signals
Registry
Cites
Statistics
Figures
Verification
Claims the paper makes
The claims and statistics of this paper haven’t been checked yet.
Run the check — free, no account needed. It reads the open-access text and checks the sources it cites.
Claims other papers make about this one
Each is checked against this paper’s own text: does it say what the citing paper says it does?
The source backs part of the claim, not all of it — or backs it for a different population, condition or comparison.
In the citing paper
“By measuring changes in electrical impedance, researchers can infer valuable information about cell volume, membrane permeability, and metabolic activity [96].”
From Methods for screening and evaluation of antimicrobial activity: A review of protocols, advantages, and limitations (2024) · cites this paper as [96]
Experimental — accuracy not yet measured
Self-check
Percentages, sums and reported differences re-computed from the paper’s own numbers.
The self-check needs the paper’s full text.
Citations
Cites
Cassini, A., Högberg, L. D., Plachouras, D., Quattrocchi, A., Hoxha, A., Simonsen, G. S., Colomb-Cotinat, M., Kretzschmar, M., Devleesschauwer, B., Cecchini, M., et al. (2018) · The Lancet Infectious Diseases · doi:10.1016/s1473-3099(18)30605-4 · Cited by 2,951
Antimicrobial Susceptibility Testing: A Review of General Principles and Contemporary Practices
Jorgensen, J. H., & Ferraro, M. J. (2009) · Clinical Infectious Diseases · doi:10.1086/647952 · Cited by 1,894
Davey, H. M., & Kell, D. B. (1996) · Microbiological Reviews · doi:10.1128/mr.60.4.641-696.1996 · Cited by 886
Structure−Activity Relationships of Polymyxin Antibiotics
Velkov, T., Thompson, P. E., Nation, R. L., & Li, J. (2009) · Journal of Medicinal Chemistry · doi:10.1021/jm900999h · Cited by 786
Single-cell microfluidic impedance cytometry: a review
Sun, T., & Morgan, H. (2010) · Microfluidics and Nanofluidics · doi:10.1007/s10404-010-0580-9 · Cited by 585
Self-citationIndustrial production of β-lactam antibiotics
Elander, R. P. (2003) · Applied Microbiology and Biotechnology · doi:10.1007/s00253-003-1274-y · Cited by 573
Single cell dielectric spectroscopy
Morgan, H., Sun, T., Holmes, D., Gawad, S., & Green, N. G. (2006) · Journal of Physics D Applied Physics · doi:10.1088/0022-3727/40/1/s10 · Cited by 446
Self-citationAntibiotic susceptibility testing in less than 30 min using direct single-cell imaging
Baltekin, Ö., Boucharin, A., Tano, E., Andersson, D. I., & Elf, J. (2017) · Proceedings of the National Academy of Sciences · doi:10.1073/pnas.1708558114 · Cited by 422
Using buoyant mass to measure the growth of single cells
Godin, M., Delgado, F. F., Son, S., Grover, W. H., Bryan, A. K., Tzur, A., Jorgensen, P., Payer, K., Grossman, A. D., Kirschner, M. W., et al. (2010) · Nature Methods · doi:10.1038/nmeth.1452 · Cited by 394
Genome-Based Prediction of Bacterial Antibiotic Resistance
Su, M., Satola, S. W., & Read, T. D. (2018) · Journal of Clinical Microbiology · doi:10.1128/jcm.01405-18 · Cited by 373
Research works printed but not linked: 2
- O’Neill, J. (ed.) The Review on Antimicrobial Resistance. Tackling drug-resistant infections globally: final report and recommendations. 1–72 (amr-review.org, HM Government, 2016).
- Spencer, D. C., Paton, T., Inglis, T. J. J., Sutton, J. M., and Morgan, H. A fast impedance-based antimicrobial susceptibility test. Protoc. Exch. https://doi.org/10.21203/rs.3.pex-1088/v1 (2020). · DOI
Cited by
Sorted by citations
Items 101–187 of 187
Hannah, S., Domingo-Roca, R., Hoskisson, P. A., Murphy, M. E., & Corrigan, D. K. (2022) · Current Opinion in Electrochemistry · doi:10.1016/j.coelec.2022.101033 · Cited by 9
Ashley, B. K., Sui, J., Javanmard, M., & Hassan, U. (2022) · Lab on a Chip · doi:10.1039/d2lc00563h · Cited by 9
Alataş, Y. C., Tefek, U., Küçükoğlu, B., Bardakci, N., Salehin, S., & Hanay, M. S. (2024) · IEEE Sensors Journal · doi:10.1109/jsen.2024.3384984 · Cited by 8
Zhang, H., Wang, L., Zhang, Z., Lin, J., & Ju, F. (2023) · Biosensors · doi:10.3390/bios13121028 · Cited by 7
Bock, L. J., Spencer, D. C., Martin, B., Daniels, C. N., Dyball, X., Hind, C. K., Wand, M. E., Allen, C. E., Read, R. C., Morgan, H., et al. (2025) · Journal of Infection · doi:10.1016/j.jinf.2025.106549 · Cited by 7
Self-citationIdentification of Single Yeast Budding Using Impedance Cytometry with a Narrow Electrode Span
Liu, X., Tang, T., Yi, P.-W., Yuan, Y., Lei, C., Li, M., Tanaka, Y., Hosokawa, Y., & Yalikun, Y. (2022) · Sensors · doi:10.3390/s22207743 · Cited by 7
Jiang, N., Xu, L., Han, Y., Wang, S., Duan, X., Dai, J., Hu, Y., Liu, X., Liu, Z., & Huang, J. (2023) · Advanced Science · doi:10.1002/advs.202300882 · Cited by 7
Saulnier, J., Jose, C., & Lagarde, F. (2023) · Bioelectrochemistry · doi:10.1016/j.bioelechem.2023.108587 · Cited by 7
In situ detection and viability assessment of target microorganisms
David, S., Cârtoc, R.-E., Petcu, I.-C., Polonschii, C., Petran, A., Turcu, R. P., Bratu, D., Gheorghiu, M., & Gheorghiu, E. (2023) · Biosensors and Bioelectronics · doi:10.1016/j.bios.2023.115821 · Cited by 7
Zhong, J., Chang, Y., Liang, M., Zhou, Y., & Ai, Y. (2024) · Biosensors and Bioelectronics · doi:10.1016/j.bios.2024.116397 · Cited by 7
Chang, Y., Zhong, J., Kassim, A. K. B., Koo, S. H., Tan, T. Y., Zhou, Y., & Ai, Y. (2024) · Sensors and Actuators B Chemical · doi:10.1016/j.snb.2024.136764 · Cited by 7
Nazar, F. N., Pellegrini, S., Azuaje‐Hualde, E., Arciniega, X., Guevara‐Pantoja, P. E., Marqués, M. C., Longo, F., Gómez, G., Basabe‐Desmonts, L., & Benito‐Lopez, F. (2025) · Microchemical Journal · doi:10.1016/j.microc.2025.115148 · Cited by 6
Lab-on-a-chip devices for bacterial systems: Tracking biofilm growth and antimicrobial interactions
Hariharasudha, H. K. R. S., Chandrasekaran, M., Baskaran, C., Govindarajan, D. K., & Kandaswamy, K. (2025) · Total Environment Microbiology · doi:10.1016/j.temicr.2025.100042 · Cited by 6
Shen, M., Wang, Q., Luo, Q., Zhao, J., & Shen, F. (2025) · Sensors & Diagnostics · doi:10.1039/d5sd00118h · Cited by 6
Pérez-Rodríguez, M., Serrano‐Pertierra, E., & Blanco‐López, M. C. (2026) · Frontiers in Cellular and Infection Microbiology · doi:10.3389/fcimb.2025.1741845 · Cited by 6
Highmore, C. J., Hanrahan, N., Cook, Y., Pritchard, Y., Lister, A. P., Cooper, K., Devitt, G., Munro, A. P. S., Faust, S. N., Mahajan, S., et al. (2025) · npj Antimicrobials and Resistance · doi:10.1038/s44259-025-00141-z · Cited by 6
Emerging advances in optical-based analysis of bacterial motility
Zhang, Z., Liao, X., Tong, W., Wang, J., & Wang, C. (2023) · TrAC Trends in Analytical Chemistry · doi:10.1016/j.trac.2023.117218 · Cited by 6
Xu, Y., & Ren, D. (2023) · Journal of Biological Engineering · doi:10.1186/s13036-023-00373-5 · Cited by 6
Corrigan, D. K. (2023) · Elsevier eBooks · doi:10.1016/b978-0-323-88431-0.00004-1 · Cited by 5
Ralston, H., Butterworth, A., Clark, B., Katsafadou, M., Vezza, V. J., Campbell, T., Malecha, M., Murphy, M. E., Poojary, A. A., Winter, A., et al. (2026) · ACS Sensors · doi:10.1021/acssensors.5c02725 · Cited by 5
Jakubec, P., Ranc, V., Kolář, M., Zítka, O., Panáček, D., & Otyepka, M. (2026) · Chemical Communications · doi:10.1039/d6cc01897a · Cited by 5
Dielectric Detection of Single Nanoparticles Using a Microwave Resonator Integrated with a Nanopore
Seçme, A., Küçükoğlu, B., Pisheh, H. S., Alataş, Y. C., Tefek, U., Uslu, H. D., Kaynak, B. E., Alhmoud, H. Z., & Hanay, M. S. (2024) · ACS Omega · doi:10.1021/acsomega.3c07506 · Cited by 5
Data-driven modeling of impedance biosensors: a subspace approach
Ramírez-Chavarría, R. G., Alvarez-Serna, B. E., Schoukens, M., & Álvarez-Icaza, L. A. (2021) · Measurement Science and Technology · doi:10.1088/1361-6501/ac0b15 · Cited by 5
Single-cell electrical characterization
Cottet, J., & Caselli, F. (2021) · Elsevier eBooks · doi:10.1016/b978-0-323-89841-6.00008-6 · Cited by 5
Yi, Q., Cui, J., Xiao, M., Tang, M.-Z., Zhang, H.-C., Zhang, G., Yang, W.-H., & Xu, Y.-C. (2023) · ACS Omega · doi:10.1021/acsomega.3c00947 · Cited by 4
Jusková, P., Kling, A., Schmitt, S., & Dittrich, P. S. (2024) · Methods in molecular biology · doi:10.1007/978-1-0716-3850-7_11 · Cited by 4
Pîndaru, A., Marutescu, L. G., Popa, M., & Chifiriuc, M. C. (2024) · International Journal of Molecular Sciences · doi:10.3390/ijms25137158 · Cited by 4
Moore, J. H., Salahi, A., Honrado, C., Warburton, C., Tate, S., Warren, C. A., & Swami, N. S. (2023) · ACS Infectious Diseases · doi:10.1021/acsinfecdis.3c00192 · Cited by 4
Booton, R. D., Agnew, E., Pople, D., Evans, S., Bock, L. J., Sutton, J. M., Robotham, J. V., & Naylor, N. R. (2024) · BMJ Open · doi:10.1136/bmjopen-2023-081865 · Cited by 4
Self-citationRotem, S., Shifman, O., Aftalion, M., Gur, D., Aminov, T., & Aloni-Grinstein, R. (2021) · Frontiers in Microbiology · doi:10.3389/fmicb.2021.664041 · Cited by 4
A renewed challenge to electrical bioimpedance: rapid assessment of pathogenic bacteria
Gheorghiu, E. (2023) · Journal of Electrical Bioimpedance · doi:10.2478/joeb-2023-0001 · Cited by 4
Zhang, C., Zaki, F. R., Won, J., & Boppart, S. A. (2023) · Journal of Biophotonics · doi:10.1002/jbio.202300384 · Cited by 4
Rafiee, Z., Rezaie, M., & Choi, S. (2024) · The Analyst · doi:10.1039/d4an00393d · Cited by 4
In Vitro Susceptibility Assays for Bacterial Response to Antimicrobial Agents
Majumder, A., Mandal, B., Dalal, S., Sahoo, R., & Samanta, S. (2025) · Springer eBooks · doi:10.1007/978-981-96-4620-3_4 · Cited by 3
Antimicrobial resistance detection: Rapid transition to point-of-care platforms
Madaje, A. I., Fande, S., Sriram, D., & Goel, S. (2025) · Microchemical Journal · doi:10.1016/j.microc.2025.115471 · Cited by 3
Wei, L., Shao, F., Dharmasena, S., Li, S., Yang, J., Mirmiran, A., Zhang, P., Lewis, S., Carroll, K. C., Hsieh, K., et al. (2025) · Small · doi:10.1002/smll.202510292 · Cited by 3
Microfluidics for antimicrobial susceptibility testing: Current advances and future perspectives
Herath, D., Hwang, B.-H., & Lee, C.-S. (2026) · Biomicrofluidics · doi:10.1063/5.0306466 · Cited by 3
Kim, J. S., Hwang, B.-H., 김진경, Heo, H. Y., Song, H., Hazra, A., Kim, J.-S., Kim, W., & Lee, C.-S. (2026) · Sensors and Actuators B Chemical · doi:10.1016/j.snb.2026.139747 · Cited by 3
Electrokinetics in antimicrobial resistance analysis: A review
Zhang, J., Li, M., Xu, R., Kapur, S., Bombard, A. J. F., & Song, Y. (2022) · Electrophoresis · doi:10.1002/elps.202200153 · Cited by 3
Haeverbeke, M. V., Cums, C., Vackier, T., Braeken, D., Stock, M., Steenackers, H. P. L., & Bernard De Baets, C. (2024) · IEEE Biomedical Circuits and Systems Conference (BioCAS) · doi:10.1109/biocas61083.2024.10798403 · Cited by 2
A perspective on microfluidic impedance cytometry in cellular biophysical property analysis
Ni, C., Ni, Z., & Xiang, N. (2025) · Biomicrofluidics · doi:10.1063/5.0290852 · Cited by 2
Bayinqiaoge, Zhang, C., & Tang, S. (2026) · Droplet · doi:10.1002/dro2.70046 · Cited by 2
Chen, X., Zhu, Z., Ni, C., Guo, Y., Wu, W., Zhu, S., & Xiang, N. (2026) · Talanta · doi:10.1016/j.talanta.2026.129896 · Cited by 2
Basant, N., Reid, T.-E. R., Singh, R., & Singh, R. (2026) · Journal of environmental chemical engineering · doi:10.1016/j.jece.2026.123240 · Cited by 2
Drug Release, Susceptibility and Time-Kill Assays to Develop Novel Anti-Infective Drugs
Esentürk‐Güzel, İ., Durgun, M. E., Özsoy, Y., & Güngör, S. (2022) · Elsevier eBooks · doi:10.1016/b978-0-12-818731-9.00143-9 · Cited by 2
Gauthier, A., Tlili, L., Battu, S., Le-Moan, C., Ploy, M.-C., Lalloué, F., Bégaud, G., & Barraud, O. (2024) · Journal of Antimicrobial Chemotherapy · doi:10.1093/jac/dkae132 · Cited by 1
Sensors for Antibiotics Susceptibility Testing—Recent Advances
Riester, O., Laufer, S., Mertelsmann, R., & Deigner, H. (2024) · Advanced Sensor Research · doi:10.1002/adsr.202400046 · Cited by 1
Development of an impedance-based fast antimicrobial susceptibility test for Neisseria gonorrhoeae
Daniels, C., Martin, B. K., Nahar, K. S., Rahman, K. M., Sutton, J. M., & Bock, L. J. (2026) · Journal of Antimicrobial Chemotherapy · doi:10.1093/jac/dkaf493 · Cited by 1
Self-citationNanotechnology for single-cell bacterial activity monitoring
Xiao, F., Yang, T., Javed, M., Yang, C., & Lin, X. (2026) · Coordination Chemistry Reviews · doi:10.1016/j.ccr.2026.217645 · Cited by 1
Label-Free Nanoparticle Characterization via Electrical Impedance-Based Submicrofluidic Analysis
Zhao, Q., & Ai, Y. (2026) · Nano Letters · doi:10.1021/acs.nanolett.5c05825 · Cited by 1
Lybrook, P., Chen, H., Barna, E., Brown, J., Wong, A., Ketchum, J., Zhang, G., & Zhe, J. (2026) · Biomedical Microdevices · doi:10.1007/s10544-026-00797-y · Cited by 1
Timchenko, L. D., Ивановна, Г. Н., Kharina, E., Morozova, A. M., Medvedev, A., Penkova, N., & Nagdalian, A. A. (2025) · World Journal of Environmental Biosciences · doi:10.51847/skdbgtgnux · Cited by 1
Fast fourteen-frequency impedance spectroscopy of single erythrocytes and yeast cells in flow
Righetto, M., Reale, R., Carneri, F., Mistretta, A., Zotti, M. D., Roversi, D., Bisegna, P., Ninno, A. D., & Caselli, F. (2026) · Biosensors and Bioelectronics · doi:10.1016/j.bios.2026.118757 · Cited by 1
Popa, I., Iancu, I., Popa, S. A., Gligor, A., Imre, K., Tîrziu, E., Bochiș, T. A., Pop, C., Dégi, J., Ivan, A., et al. (2026) · Pathogens · doi:10.3390/pathogens15050525 · Cited by 1
Hornsey, M., Taylor, I., King, T., Brown, Z., Cançado, D. N. T., Judd, K., Kuszynski, E. P., Lines, R., Lyon, R., Wang, X., et al. (2026) · Journal of Clinical Microbiology · doi:10.1128/jcm.00558-26 · Cited by 1
Self-citationReal-Time Tracking of Individual Droplets in Multiphase Microfluidics
Ibarlucea, B., Schütt, J., Baraban, L., Makarov, D., Medina‐Sánchez, M., & Cuniberti, G. (2022) · Biomedical engineering · doi:10.5772/intechopen.106796 · Cited by 1
Pragadeeshwara Rao, R. (2023) · ChemRxiv · doi:10.26434/chemrxiv-2023-900l3
Permittivity-Based Classification by the Integration of Impedance Cytometry and Microwave Sensing
Tefek, U., Sari, B., Alhmoud, H. Z., & Hanay, M. S. (2023) · IEEE MTT-S International Microwave Biomedical Conference (IMBioC) · doi:10.1109/imbioc56839.2023.10305104
Chen, X., Li, Y., Wang, M., Qin, X., Wang, J., Huo, X., & Chen, J. (2024) · Proceedings of IEEE Sensors/Proceedings of IEEE Sensors ... · doi:10.1109/sensors60989.2024.10784526
Chen, Y., Han, Z., Wei, W., & Duan, X. (2024) · Proceedings of IEEE Sensors/Proceedings of IEEE Sensors ... · doi:10.1109/sensors60989.2024.10785222
Du, X., Chen, X., Tan, H., Fang, Z., Wang, J., Huo, X., Chen, X., & Chen, J. (2025) · IEEE International Conference on Nano/Micro Engineered and Molecular Systems · doi:10.1109/nems67320.2025.11170034
Song, Y. Q., Liu, J., Xu, X., Lan, T., Yi, Z., Hong, H., Nazeeruddin, M. K., Sun, L., Huang, Q., Wang, Z., et al. (2025) · Biosensors and Bioelectronics · doi:10.1016/j.bios.2025.118150
Wu, G., Zhang, Z., Du, M., Wu, D., Zhou, J., Xie, X., & Tian, F. (2025) · Analytica Chimica Acta · doi:10.1016/j.aca.2025.345004
Silicon Nanowire Based Sensors for Bacterial Tests
Yu, Y. (2023) · Uppsala University Publications (Uppsala University)
Safdar, N., Sultan, A., Malik, N., & Nizamuddin, S. (2025) · Infectious Diseases Journal of Pakistan · doi:10.61529/idjp.v34i4.457
Antagonistic activity of lactic acid bacteria strains and commercial bacterial starters
Хабибуллин, Р. Э., Kitaevskaya, S. V., Решетник, О. А., & Vildanova, S. (2026) · Exploration of Foods and Foodomics · doi:10.37349/eff.2026.1010112
Parallelised detection of bacteria viability using an electrode array and the Exeter Multiscope
Lee, K. K., Horsell, D. W., Stratford, J. P., Karlikowska, M., Khattak, S., Rodrigues, T. D. S. G., Jiang, J., Shaw, M., Pagliara, S., & Corbett, A. D. (2026) · Scientific Reports · doi:10.1038/s41598-026-66381-9
The impact of inoculation methods on bacterial aggregation and antimicrobial susceptibility testing
Cai, Y.-M., Wang, Z., Webber, M. A., & Malone, J. G. (2026) · Microbiology · doi:10.1099/mic.0.001676
Economic burden of antimicrobial resistance in Lebanon
Iskandar, K. (2021) · theses.fr (ABES) · doi:10.70675/d10942f1z725ez4266z99daz8749e61e110b
Liu, J., Zhao, M., Wang, Z., Feng, D., Wu, W., Li, Y., & Hu, Q. (2026) · Biosensors and Bioelectronics · doi:10.1016/j.bios.2026.118732
Clinical impact of bacterial heteroresistance
Joyce, C., Anwar, S., Hind, C. K., Sutton, J. M., & Sergaki, C. (2026) · JAC-Antimicrobial Resistance · doi:10.1093/jacamr/dlag075
Self-citationWang, H., Ren, X., Kong, W.-L., Sun, X.-G., Wang, C., Su, N., Li, J.-M., Li, R.-X., Li, H.-Z., Wu, T.-H., et al. (2026) · Biosensors and Bioelectronics · doi:10.1016/j.bios.2026.118858
Methods toward Single-Cell Total-Analysis
Zhang, Q., Liao, W., Lin, L., Li, X. J., Lin, J., Song, Y., Hou, Y., & Lin, J. (2026) · Chemical Reviews · doi:10.1021/acs.chemrev.5c01127
Light scattering characterization of bacterial morphology in aqueous suspension
Meza-Martínez, K. A., Zuccolotto-Bernez, A. B., Escobedo-Sanchez, M. A., Huerta-Cantillo, J., Navarro‐García, F., González-Mozuelos, P., & Rojas-Ochoa, L. F. (2026) · Journal of Physics Condensed Matter · doi:10.1088/1361-648x/ae7886
CommAST Enables Antibiotic Susceptibility Testing at the Gut Microbiota Community Level
Ding, C., Wu, W., Zhang, Y., Han, J., Wang, W., Song, J., Gao, Y., Gao, J., & Yang, C. (2026) · Analytical Chemistry · doi:10.1021/acs.analchem.6c00243
Li, J., Yang, W., Su, T., Pan, S., Zhou, H., Wu, J. R., & Li, S. (2026) · Electrophoresis · doi:10.1002/elps.70132
Díaz, J. J. S., Sotomonte, S., & Buitrago, A. (2026) · JAC-Antimicrobial Resistance · doi:10.1093/jacamr/dlag132
Ding, Q., Peng, L., Xu, W., Zhang, Y., Wang, W., Yu, S., Liu, D., & Hu, Z. (2026) · Food Research International · doi:10.1016/j.foodres.2026.120777
Isolating viable bacteria from positive blood cultures: impedance cytometry analysis
Cançado, D. N. T., Saito, M. S., Spencer, D. C., & Morgan, H. (2026) · Biomedical Microdevices · doi:10.1007/s10544-026-00847-5
Self-citationMicrofluidics-Integrated Microwave Cytometry for Dielectric Characterization at the Micron Scale
Tefek, U. (2026) · URSI Radio Science Letters · doi:10.46620/26-0093
Fu, L., Chen, J., Zhang, Y., Wang, Z., & Huang, X. (2026) · Analytica Chimica Acta · doi:10.1016/j.aca.2026.346347
Moakhar, R. S., Jalali, M., AbdElFatah, T., Yedire, S. G., Petkun, M., Mata, C. D. R., He, Z., Shieh, H., McKay, G. A., Corsini, R., et al. (2026) · Science Advances · doi:10.1126/sciadv.aec7686
Li, J., Chen, J., Zhang, X., Li, P., Zhang, L., Nayak, N., Zou, Y., Liang, X., Zhao, H., Weerasekera, R., et al. (2026) · arXiv (Cornell University) · doi:10.48550/arxiv.2610.33648
Corolea, A., Dima, L., Neculoiu, C.-D., Idomir, M. E., Totan, A., Pițuru, S., & Badea, M. (2026) · Biosensors · doi:10.3390/bios16110627
Metadata
- Authors
- Spencer, D. C., Paton, T. F., Mulroney, K. T., Inglis, T. J. J., Sutton, J. M., & Morgan, H.
- Affiliations
- University of Southampton (GB)
- Pathwest Laboratory Medicine (AU)
- The University of Western Australia (AU)
- Public Health England (GB)
- Corresponding author
- Morgan, Hywel
- ORCID
- Venue
- Nature Communications
- Published
- 2020-10-21
- Volume
- 11
- Issue
- 1
- Pages
- 5328-5328
- ISSN
- 2041-1723 (ISSN-L)
- PMC
- PMC7578651
- OpenAlex
- W3094320129
- Cited by
- 183
- References
- 45
- Citations by year
- 2026: 31 · 2025: 26 · 2024: 33 · 2023: 39 · 2022: 29 · 2021: 24 · 2020: 1
- FWCI
- 15.40
- Type
- journal article
- Language
- en
- Open access
- gold
- doi.org
- Locations
- Nature Communications (publishedVersion, cc-by)
- Research Square (acceptedVersion, cc-by)
- PubMed Central (publishedVersion, cc-by)
- PubMed (publishedVersion)
- ePrints Soton (University of Southampton) (acceptedVersion)
- RePEc: Research Papers in Economics (submittedVersion)
- DOAJ (DOAJ: Directory of Open Access Journals) (submittedVersion, cc-by-sa)
- UWA Profiles and Research Repository (UWA) (submittedVersion, cc-by)
- Funders
- National Institute for Health and Care Research (NIHR200968)
- Royal Society
- Topics
- Health Sciences › Medicine › Microbiology (medical) › Bacterial Identification and Susceptibility Testing
- Physical Sciences › Engineering › Biomedical Engineering › Microfluidic and Bio-sensing Technologies
- Life Sciences › Immunology and Microbiology › Applied Microbiology and Biotechnology › Antimicrobial agents and applications
- Keywords
- antimicrobial susceptibility testing, impedance cytometry, microfluidics, label-free detection, antibiotic mechanism of action, broth microdilution comparison, antibiotic prescribing
- MeSH terms
- Meropenem, Bacteria, Equipment Design, Humans, Klebsiella pneumoniae, Microbial Sensitivity Tests, Electric Impedance, Drug Resistance, Bacterial, Microfluidic Analytical Techniques, Biophysical Phenomena, Lab-On-A-Chip Devices
About these checks
Registry, retraction, Cites and statistics results are computed, not judged, with one exception: a printed reference that no index lists is read once by a model before it counts as a citation error. Claims are extracted by a model and kept only when their quote appears verbatim in the text; each cited source is then checked, with a model’s help, for whether it says what the claim relies on. Those verdicts can be wrong — read the claim’s quote and the cited source before relying on one.
Statistics and arithmetic are recomputed, not judged.
Confidence bands are shown only for fields calibrated on our annotated test set. None is calibrated yet, so no band is shown.
What counts as a claim ›How we measure confidence ›How we check this ›
Are you an author, or do you see a problem with this page? Request a review
