

The DOI matches its Crossref record; 65 of the 65 references it cites were found in a registry or an index.
An HDAC6-dependent surveillance mechanism suppresses tau-mediated neurodegeneration and cognitive decline
Open accessAbstract
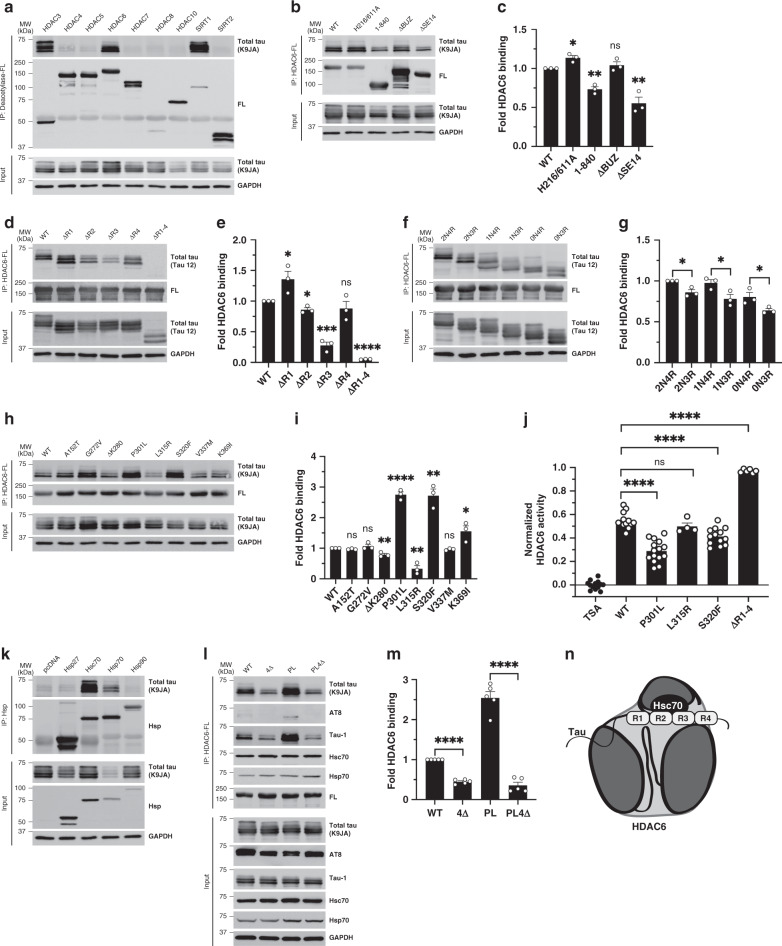
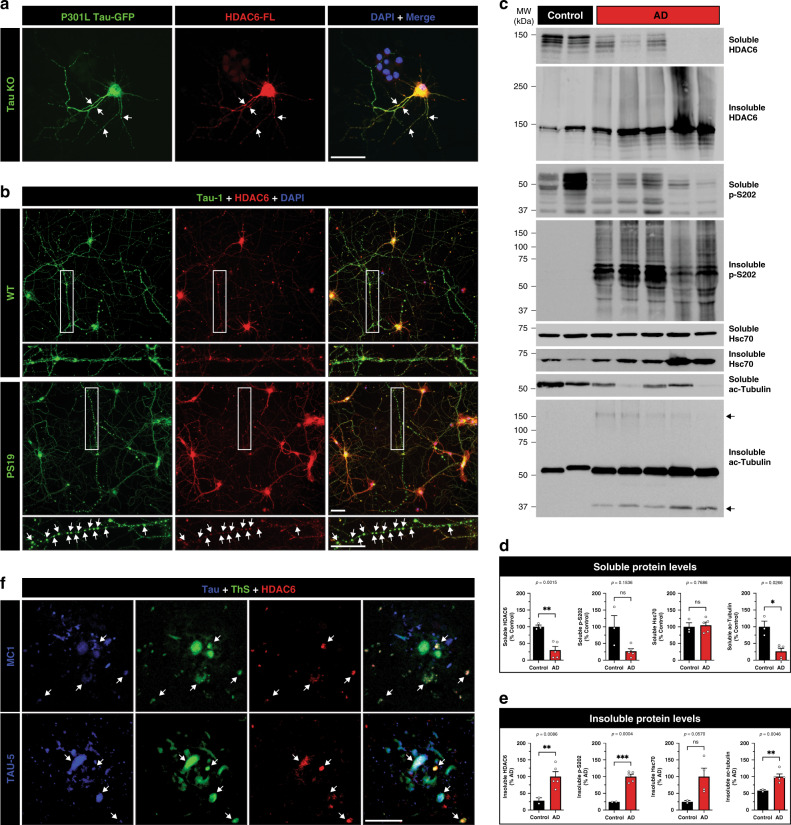
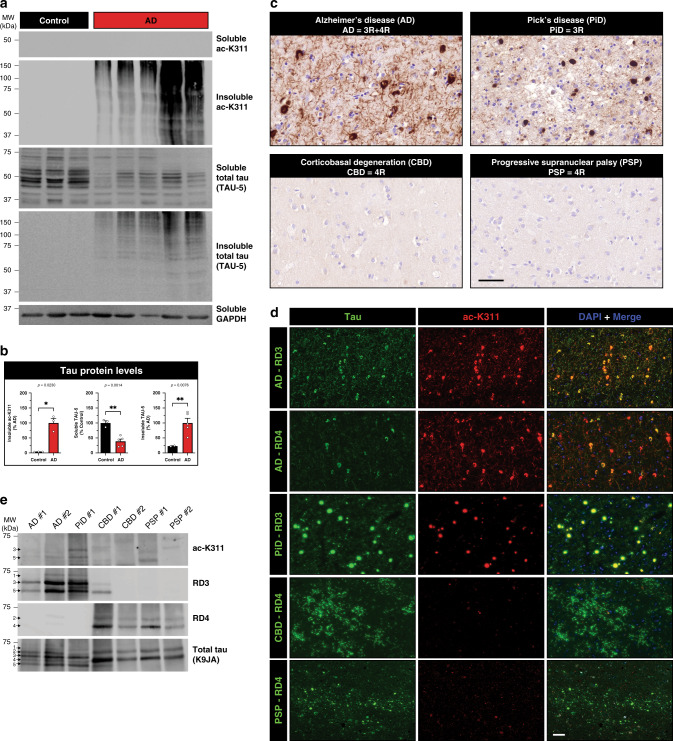
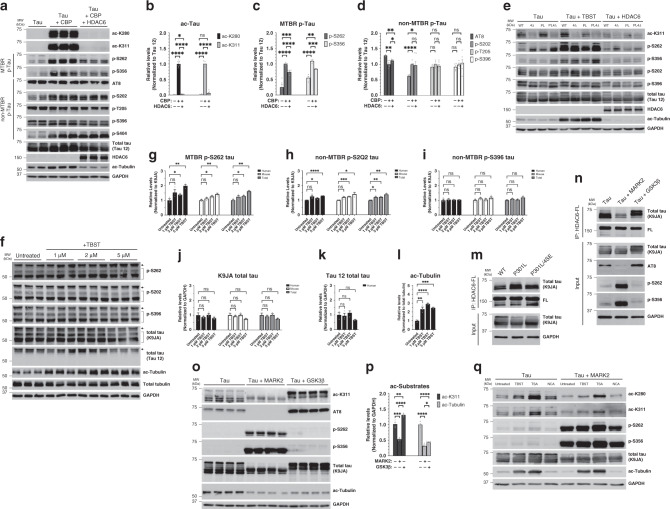
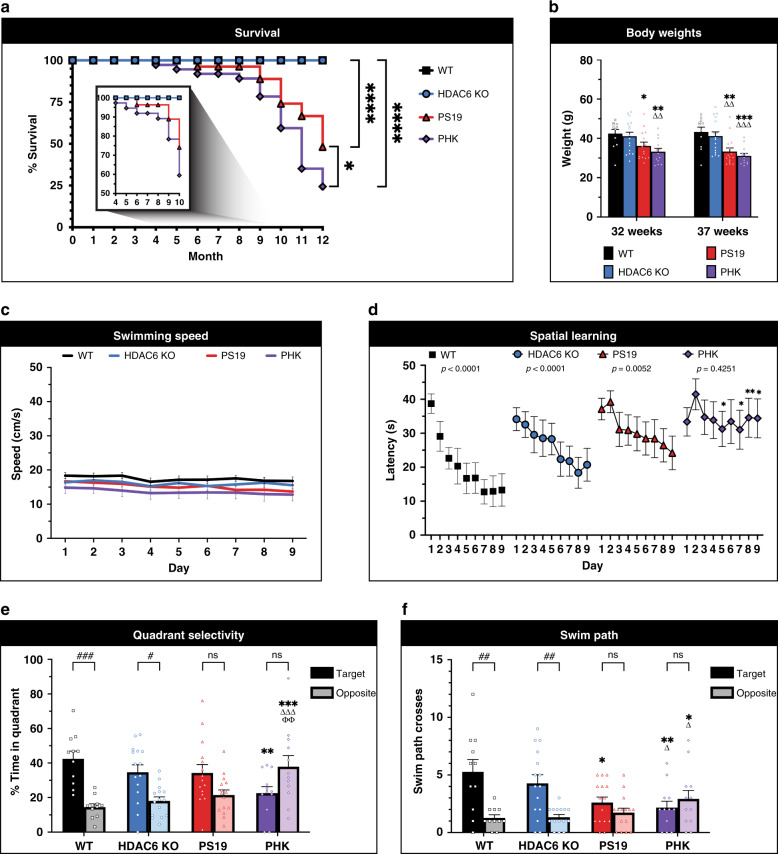
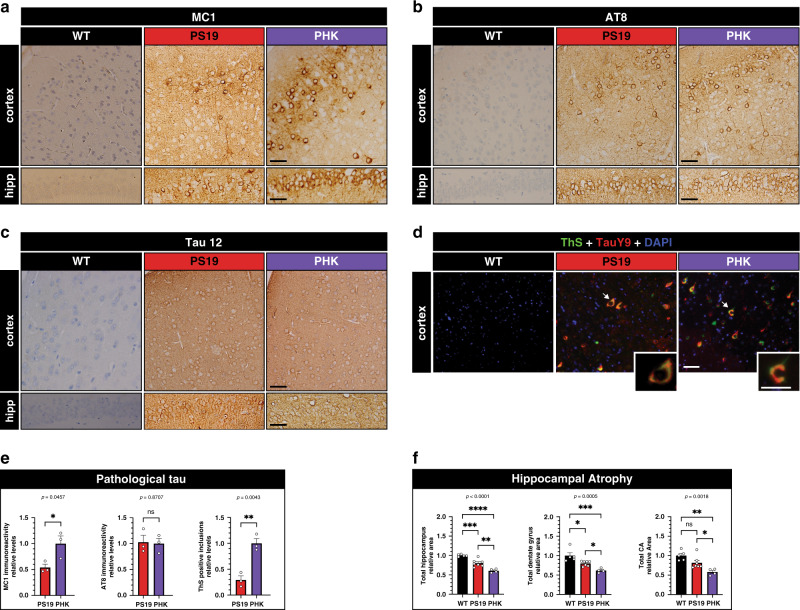
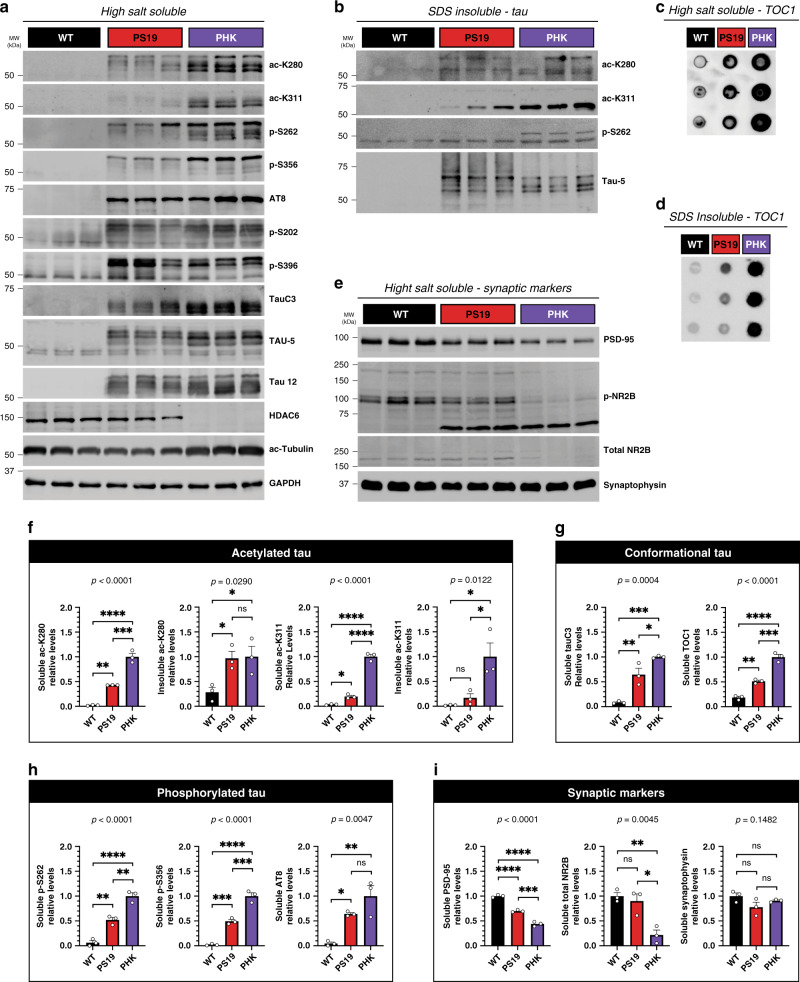
Tauopathies including Alzheimer’s disease (AD) are marked by the accumulation of aberrantly modified tau proteins. Acetylated tau, in particular, has recently been implicated in neurodegeneration and cognitive decline. HDAC6 reversibly regulates tau acetylation, but its role in tauopathy progression remains unclear. Here, we identified an HDAC6-chaperone complex that targets aberrantly modified tau. HDAC6 not only deacetylates tau but also suppresses tau hyperphosphorylation within the microtubule-binding region. In neurons and human AD brain, HDAC6 becomes co-aggregated within focal tau swellings and human AD neuritic plaques. Using mass spectrometry, we identify a novel HDAC6-regulated tau acetylation site as a disease specific marker for 3R/4R and 3R tauopathies, supporting uniquely modified tau species in different neurodegenerative disorders. Tau transgenic mice lacking HDAC6 show reduced survival characterized by accelerated tau pathology and cognitive decline. We propose that a HDAC6-dependent surveillance mechanism suppresses toxic tau accumulation, which may protect against the progression of AD and related tauopathies.
Overview
The claims and statistics of this paper haven’t been checked yet.
Run the check — free, no account needed. It reads the open-access text and checks the sources it cites.
Integrity signals
Registry
Cites
Statistics
Figures
Verification
Claims the paper makes
The claims and statistics of this paper haven’t been checked yet.
Run the check — free, no account needed. It reads the open-access text and checks the sources it cites.
Claims other papers make about this one
Each is checked against this paper’s own text: does it say what the citing paper says it does?
The cited source says what the claim attributes to it.
In the citing paper
“Increased expression of HDAC6 decreases Tau acetylation [40], which is a key factor contributing to the formation of Tau aggregates [39, 49].”
From Elevated SGK1 increases Tau phosphorylation and microtubule instability in Alzheimer’s patient-derived cortical neurons (2026) · cites this paper as [39]
In the citing paper
“HDAC6 also inhibits tau hyperphosphorylation within the MTBR [181].”
From Tau and neuroinflammation in Alzheimer’s disease: interplay mechanisms and clinical translation (2023) · cites this paper as [181]
Self-check
Percentages, sums and reported differences re-computed from the paper’s own numbers.
The self-check needs the paper’s full text.
Citations
Cites
1 retracted
Janczura, K. J., Volmar, C.-H., Sartor, G. C., Rao, S. J., Ricciardi, N. R., Lambert, G., Brothers, S. P., & Wahlestedt, C. (2018) · Proceedings of the National Academy of Sciences · doi:10.1073/pnas.1805436115 · Cited by 183
RetractedOakley, H., Cole, S. L., Logan, S., Maus, E., Shao, P., Craft, J., Guillozet-Bongaarts, A., Ohno, M., Disterhoft, J., Van Eldik, L., et al. (2006) · The Journal of Neuroscience · doi:10.1523/jneurosci.1202-06.2006 · Cited by 3,530
HDAC6 is a microtubule-associated deacetylase
Hubbert, C., Guardiola, A., Shao, R., Kawaguchi, Y., Ito, A., Nixon, A., Yoshida, M., Wang, X.-F., & Yao, T.-P. (2002) · Nature · doi:10.1038/417455a · Cited by 2,403
Synapse Loss and Microglial Activation Precede Tangles in a P301S Tauopathy Mouse Model
Yoshiyama, Y., Higuchi, M., Zhang, B., Huang, S.-M., Iwata, N., Saido, T. C., Maeda, J., Suhara, T., Trojanowski, J. Q., & Lee, V. M.-Y. (2007) · Neuron · doi:10.1016/j.neuron.2007.01.010 · Cited by 2,208
Self-citationKawaguchi, Y., Kovacs, J. J., McLaurin, A. C., Vance, J. M., Ito, A., & Yao, T. (2003) · Cell · doi:10.1016/s0092-8674(03)00939-5 · Cited by 1,529
HDAC6 rescues neurodegeneration and provides an essential link between autophagy and the UPS.
Pandey, U. B., Nie, Z., Batlevi, Y., McCray, B. A., Ritson, G. P., Nedelsky, N. B., Schwartz, S. L., DiProspero, N. A., Knight, M. A., Schuldiner, O., et al. (2007) · Nature · doi:10.1038/nature05853 · Cited by 1,234
HDAC6 Regulates Hsp90 Acetylation and Chaperone-Dependent Activation of Glucocorticoid Receptor
Kovacs, J. J., Murphy, P. J. M., Gaillard, S., Zhao, X., Wu, J.-T., Nicchitta, C. V., Yoshida, M., Toft, D. O., Pratt, W. B., & Yao, T.-P. (2005) · Molecular Cell · doi:10.1016/j.molcel.2005.04.021 · Cited by 1,153
von Bergen, M., Friedhoff, P., Biernat, J., Heberle, J., Mandelkow, E.-M., & Mandelkow, E. (2000) · Proceedings of the National Academy of Sciences · doi:10.1073/pnas.97.10.5129 · Cited by 1,021
Acetylation of Tau Inhibits Its Degradation and Contributes to Tauopathy
Min, S.-W., Cho, S.-H., Zhou, Y., Schroeder, S., Haroutunian, V., Seeley, W. W., Huang, E. J., Shen, Y., Masliah, E., Mukherjee, C., et al. (2010) · Neuron · doi:10.1016/j.neuron.2010.08.044 · Cited by 949
HDAC6 Modulates Cell Motility by Altering the Acetylation Level of Cortactin
Zhang, X. M., Yuan, Z., Zhang, Y., Yong, S., Salas-Burgos, A., Koomen, J. M., Olashaw, N., Parsons, J. T., Yang, X., Dent, S., et al. (2007) · Molecular Cell · doi:10.1016/j.molcel.2007.05.033 · Cited by 731
The acetylation of tau inhibits its function and promotes pathological tau aggregation
Cohen, T. J., Guo, J. L., Hurtado, D. E., Kwong, L. K., Mills, I. P., Trojanowski, J. Q., & Lee, V. M. Y. (2011) · Nature Communications · doi:10.1038/ncomms1255 · Cited by 724
Self-citationvon Bergen�, M., Barghorn, S., Li, L., Marx, A., Biernat, J., Mandelkow, E., & Mandelkow�, E. (2001) · Journal of Biological Chemistry · doi:10.1074/jbc.m105196200 · Cited by 618
Mice Lacking Histone Deacetylase 6 Have Hyperacetylated Tubulin but Are Viable and Develop Normally
Zhang, Y., Kwon, S., Yamaguchi, T., Cubizolles, F., Rousseaux, S., Kneissel, M., Cao, C., Li, N., Cheng, H.-L., Chua, K., et al. (2008) · Molecular and Cellular Biology · doi:10.1128/mcb.01154-06 · Cited by 559
Lee, J., Nagano, Y., Taylor, J. P., Lim, K. L., & Yao, T. (2010) · The Journal of Cell Biology · doi:10.1083/jcb.201001039 · Cited by 545
Critical role of acetylation in tau-mediated neurodegeneration and cognitive deficits
Min, S.-W., Chen, X., Tracy, T. E., Li, Y., Zhou, Y., Wang, C., Shirakawa, K., Minami, S. S., Defensor, E., Mok, S. A., et al. (2015) · Nature Medicine · doi:10.1038/nm.3951 · Cited by 516
HDAC and HDAC Inhibitor: From Cancer to Cardiovascular Diseases
Yoon, S., & Eom, G. H. (2016) · Chonnam Medical Journal · doi:10.4068/cmj.2016.52.1.1 · Cited by 474
Morris, M., Knudsen, G. M., Maeda, S., Trinidad, J. C., Ioanoviciu, A., Burlingame, A. L., & Mucke, L. (2015) · Nature Neuroscience · doi:10.1038/nn.4067 · Cited by 472
d’Ydewalle, C. V. O., Krishnan, J., Chiheb, D., Damme, P. V., Irobi, J., Kozikowski, A. P., Berghe, P. V., Timmerman, V., Robberecht, W., & Bosch, L. V. D. (2011) · Nature Medicine · doi:10.1038/nm.2396 · Cited by 462
Kaufman, S. K., Sanders, D. W., Thomas, T. L., Ruchinskas, A. J., Vaquer-Alicea, J., Sharma, A. M., Miller, T. M., & Diamond, M. I. (2016) · Neuron · doi:10.1016/j.neuron.2016.09.055 · Cited by 450
Guo, J. L., Narasimhan, S., Changolkar, L., He, Z., Stieber, A., Zhang, B., Gathagan, R. J., Iba, M., McBride, J. D., Trojanowski, J. Q., et al. (2016) · Journal of Experimental Medicine · doi:10.1084/jem.20160833 · Cited by 440
Self-citationAn Acetylation Site in the Middle Domain of Hsp90 Regulates Chaperone Function
Scroggins, B. T., Robzyk, K., Wang, D., Marcu, M. G., Tsutsumi, S., Beebe, K., Cotter, R. J., Felts, S., Toft, D., Karnitz, L., et al. (2007) · Molecular Cell · doi:10.1016/j.molcel.2006.12.008 · Cited by 413
HDAC6 controls major cell response pathways to cytotoxic accumulation of protein aggregatesPreprint
Boyault, C., Zhang, Y., Fritah, S., Caron, C., Gilquin, B., Kwon, S. H., Garrido, C., Yao, T., Vourc’h, C., Matthias, P., et al. (2007) · Genes & Development · doi:10.1101/gad.436407 · Cited by 387
Narasimhan, S., Guo, J. L., Changolkar, L., Stieber, A., McBride, J. D., Silva, L. V., He, Z., Zhang, B., Gathagan, R. J., Trojanowski, J. Q., et al. (2017) · The Journal of Neuroscience · doi:10.1523/jneurosci.1230-17.2017 · Cited by 374
Self-citationHDAC6 inhibition reverses axonal transport defects in motor neurons derived from FUS-ALS patients
Guo, W., Naujock, M., Fumagalli, L., Vandoorne, T., Baatsen, P., Boon, R., Ordovás, L., Patel, A., Welters, M., Vanwelden, T., et al. (2017) · Nature Communications · doi:10.1038/s41467-017-00911-y · Cited by 373
Reducing HDAC6 ameliorates cognitive deficits in a mouse model for Alzheimer's disease
Govindarajan, N., Rao, P., Burkhardt, S., Sananbenesi, F., Schlüter, O. M., Bradke, F., Lu, J., & Fischer, A. (2012) · EMBO Molecular Medicine · doi:10.1002/emmm.201201923 · Cited by 351
Cook, C. N., Carlomagno, Y., Gendron, T. F., Dunmore, J. H., Scheffel, K., Stetler, C. T., Davis, M., Dickson, D. W., Jarpe, M. B., Deture, M. A., et al. (2013) · Human Molecular Genetics · doi:10.1093/hmg/ddt402 · Cited by 325
Acetylation of intrinsically disordered regions regulates phase separation
Saito, M., Heß, D., Eglinger, J., Fritsch, A. W., Kreysing, M., Weinert, B. T., Choudhary, C., & Matthias, P. (2018) · Nature Chemical Biology · doi:10.1038/s41589-018-0180-7 · Cited by 296
Tracy, T. E., Sohn, P. D., Minami, S. S., Wang, C., Min, S.-W., Li, Y., Zhou, Y., Le, D., Lo, I., Ponnusamy, R., et al. (2016) · Neuron · doi:10.1016/j.neuron.2016.03.005 · Cited by 277
Histone Deacetylase 6 Regulates Growth Factor-Induced Actin Remodeling and Endocytosis
Gao, Y., Hubbert, C. C., Lu, J., Lee, Y.-S., Lee, J., & Yao, T. (2007) · Molecular and Cellular Biology · doi:10.1128/mcb.00393-07 · Cited by 209
Szendrei, G., Lee, V. M. Y., & Otvos, L. (1993) · Journal of Neuroscience Research · doi:10.1002/jnr.490340212 · Cited by 204
Self-citationTubastatin A/ACY-1215 Improves Cognition in Alzheimer's Disease Transgenic Mice
Zhang, L., Liu, C., Wu, J., Tao, J.-J., Sui, X., Yao, Z., Xu, Y., Huang, L., Zhu, H., Sheng, S., et al. (2014) · Journal of Alzheimer s Disease · doi:10.3233/jad-140066 · Cited by 193
Sohn, P. D., Tracy, T. E., Son, H.-I., Zhou, Y., Leite, R. E. P., Miller, B. L., Seeley, W. W., Grinberg, L. T., & Gan, L. (2016) · Molecular Neurodegeneration · doi:10.1186/s13024-016-0109-0 · Cited by 160
Recent advances in the discovery of potent and selective HDAC6 inhibitors
Wang, X.-X., Wan, R.-Z., & Liu, Z.-P. (2018) · European Journal of Medicinal Chemistry · doi:10.1016/j.ejmech.2017.10.040 · Cited by 152
SIRT1 Deacetylates Tau and Reduces Pathogenic Tau Spread in a Mouse Model of Tauopathy
Min, S., Sohn, P., Li, Y., Devidze, N., Johnson, J. R., Krogan, N. J., Masliah, E., Mok, S., Gestwicki, J. E., & Gan, L. (2018) · Journal of Neuroscience · doi:10.1523/jneurosci.2369-17.2018 · Cited by 151
The microtubule-associated tau protein has intrinsic acetyltransferase activity
Cohen, T. J., Friedmann, D., Hwang, A. W., Marmorstein, R., & Lee, V. M. Y. (2013) · Nature Structural & Molecular Biology · doi:10.1038/nsmb.2555 · Cited by 149
Self-citationSelenica, M. B., Benner, L., Housley, S. B., Manchec, B., Lee, D. C., Nash, K. R., Kalin, J. H., Bergman, J. A., Kozikowski, A. P., Gordon, M. N., et al. (2014) · Alzheimer s Research & Therapy · doi:10.1186/alzrt241 · Cited by 148
An acetylation–phosphorylation switch that regulates tau aggregation propensity and function
Carlomagno, Y., Chung, D.-E. C., Yue, M., Castanedes-Casey, M., Madden, B. J., Dunmore, J., Tong, J., DeTure, M., Dickson, D. W., Petrucelli, L., et al. (2017) · Journal of Biological Chemistry · doi:10.1074/jbc.m117.794602 · Cited by 143
Nucleation-dependent Tau Filament Formation
Congdon, E. E., Kim, S., Bonchak, J., Songrug, T., Anastasios Matzavinos, A., & Kuret, J. (2008) · Journal of Biological Chemistry · doi:10.1074/jbc.m800247200 · Cited by 126
Strang, K. H., Croft, C. L., Sorrentino, Z. A., Chakrabarty, P., Golde, T. E., & Giasson, B. I. (2018) · Journal of Biological Chemistry · doi:10.1074/jbc.m117.815357 · Cited by 124
Imbalance of Hsp70 family variants fosters tau accumulation
Jinwal, U. K., Akoury, E., Abisambra, J. F., O’Leary, J. C., Thompson, A. D., Blair, L. J., Jin, Y., Bacon, J. A., Nordhues, B. A., Cockman, M. E., et al. (2012) · The FASEB Journal · doi:10.1096/fj.12-220889 · Cited by 121
Jicha, G. A., Berenfeld, B., & Davies, P. J. (1999) · Journal of Neuroscience Research · doi:10.1002/(sici)1097-4547(19990315)55:6 · Cited by 119
Prior, R. C., Helleputte, L. V., Benoy, V., & Bosch, L. V. D. (2017) · Neurobiology of Disease · doi:10.1016/j.nbd.2017.02.009 · Cited by 118
HDAC6 is a therapeutic target in mutant GARS-induced Charcot-Marie-Tooth disease
Benoy, V., Helleputte, L. V., Prior, R. C., d’Ydewalle, C. V. O., Haeck, W., Geens, N., Scheveneels, W., Schevenels, B., Cader, M. Z., Talbot, K., et al. (2017) · Brain · doi:10.1093/brain/awx375 · Cited by 116
Kim, C., Choi, H., Jung, E. S., Lee, W., Oh, S., Jeon, N. L., & Mook‐Jung, I. (2012) · PLoS ONE · doi:10.1371/journal.pone.0042983 · Cited by 115
A Dual Pathogenic Mechanism Links Tau Acetylation to Sporadic Tauopathy
Trzeciakiewicz, H., Tseng, J., Wander, C. M., Madden, V. J., Tripathy, A., Yuan, C., & Cohen, T. J. (2017) · Scientific Reports · doi:10.1038/srep44102 · Cited by 112
Self-citationArgyrophilic grain disease differs from other tauopathies by lacking tau acetylation
Grinberg, L. T., Wang, X., Wang, C., Sohn, P., Theofilas, P., Sidhu, M., Arevalo, J. B., Heinsen, H., Huang, E. J., Rosen, H. J., et al. (2013) · Acta Neuropathologica · doi:10.1007/s00401-013-1080-2 · Cited by 110
HDAC inhibitors: A new promising drug class in anti-aging research
Pasyukova, E. G., & Vaiserman, A. M. (2017) · Mechanisms of Ageing and Development · doi:10.1016/j.mad.2017.08.008 · Cited by 99
Sarkar, M., Kuret, J., & Lee, G. S. (2008) · Journal of Neuroscience Research · doi:10.1002/jnr.21721 · Cited by 96
Tapia, M., Wandosell, F. G., & Garrido, J. J. (2010) · PLoS ONE · doi:10.1371/journal.pone.0012908 · Cited by 95
Gibbons, G. S., Banks, R. A., Kim, B., Changolkar, L., Riddle, D. M., Leight, S. N., Irwin, D. J., Trojanowski, J. Q., & Lee, V. M. Y. (2018) · Journal of Neuropathology & Experimental Neurology · doi:10.1093/jnen/nly010 · Cited by 94
Self-citationThe Deacetylase HDAC6 Mediates Endogenous Neuritic Tau Pathology
Tseng, J.-H., Xie, L., Song, S., Xie, Y., Allen, L., Ajit, D., Hong, J.-S., Chen, X., Meeker, R. B., & Cohen, T. J. (2017) · Cell Reports · doi:10.1016/j.celrep.2017.07.082 · Cited by 93
Self-citationHistone Deacetylase Inhibitors: New Promise in the Treatment of Immune and Inflammatory Diseases
Shuttleworth, S. J., Bailey, S. G., & Townsend, P. A. (2010) · Current Drug Targets · doi:10.2174/1389450111009011430 · Cited by 88
TOC1: Characterization of a Selective Oligomeric Tau Antibody
Ward, S., Himmelstein, D. S., Lancia, J. K., Fu, Y., Patterson, K. R., & Binder, L. I. (2013) · Journal of Alzheimer s Disease · doi:10.3233/jad-131235 · Cited by 81
Noack, M., Leyk, J., & Richter‐Landsberg, C. (2014) · Glia · doi:10.1002/glia.22624 · Cited by 77
HDAC6 and RhoA are novel players in Abeta-driven disruption of neuronal polarity
Tsushima, H., Emanuele, M., Polenghi, A., Esposito, A., Vassalli, M., Barberis, A., Difato, F., & Chieregatti, E. (2015) · Nature Communications · doi:10.1038/ncomms8781 · Cited by 71
Zhang, L., Liu, S., Liu, N., Zhang, Y., Liu, M., Li, D., Seto, E., Yao, T., Shui, W., & Zhou, J. (2014) · Protein & Cell · doi:10.1007/s13238-014-0102-8 · Cited by 66
rAAV-based brain slice culture models of Alzheimer’s and Parkinson’s disease inclusion pathologies
Croft, C. L., Cruz, P. E., Ryu, D. H., Ceballos‐Diaz, C., Strang, K. H., Woody, B. M., Lin, W.-L., Deture, M. A., Rodríguez-Lebrón, E., Dickson, D. W., et al. (2019) · The Journal of Experimental Medicine · doi:10.1084/jem.20182184 · Cited by 65
Combining P301L and S320F tau variants produces a novel accelerated model of tauopathy
Koller, E. J., Gonzalez De La Cruz, E., Machula, T., Ibanez, K. R., Lin, W.-L., Williams, T., Riffe, C. J., Ryu, D., Strang, K. H., Liu, X., et al. (2019) · Human Molecular Genetics · doi:10.1093/hmg/ddz151 · Cited by 63
Landucci, E., Brindisi, M., Bianciardi, L., Catania, L. M., Daga, S., Croci, S., Frullanti, E., Fallerini, C., Butini, S., Brogi, S., et al. (2018) · Experimental Cell Research · doi:10.1016/j.yexcr.2018.05.001 · Cited by 57
Arai, T., Ikeda, K., Akiyama, H., Tsuchiya, K., Iritani, S., Ishiguro, K., Yagishita, S., Oda, T., Odawara, T., & Iseki, E. (2003) · Acta Neuropathologica · doi:10.1007/s00401-003-0671-8 · Cited by 55
Inhibition of HDAC6 Modifies Tau Inclusion Body Formation and Impairs Autophagic Clearance
Leyk, J., Goldbaum, O., Noack, M., & Richter‐Landsberg, C. (2014) · Journal of Molecular Neuroscience · doi:10.1007/s12031-014-0460-y · Cited by 49
The role of histone deacetylase 6 in synaptic plasticity and memory
Perry, S., Kiragasi, B., Dickman, D., & Ray, A. (2017) · Cell Reports · doi:10.1016/j.celrep.2017.01.028 · Cited by 49
Conserved Lysine Acetylation within the Microtubule-Binding Domain Regulates MAP2/Tau Family Members
Hwang, A. W., Trzeciakiewicz, H., Friedmann, D., Yuan, C., Marmorstein, R., Lee, V. M. ‐., & Cohen, T. J. (2016) · PLoS ONE · doi:10.1371/journal.pone.0168913 · Cited by 18
Self-citationDopaminergic abnormalities in Hdac6-deficient mice
Fukada, M., Nakayama, A., Mamiya, T., Yao, T., & Kawaguchi, Y. (2016) · Neuropharmacology · doi:10.1016/j.neuropharm.2016.08.018 · Cited by 17
Cited by
Sorted by citations
Brain-Derived Neurotrophic Factor in Alzheimer’s Disease and Its Pharmaceutical Potential
Gao, L., Zhang, Y., Sterling, K., & Song, W. (2022) · Translational Neurodegeneration · doi:10.1186/s40035-022-00279-0 · Cited by 606
Neuroinflammation in Alzheimer disease
Heneka, M. T., van der Flier, W. M., Jessen, F., Hoozemanns, J., Thal, D. R., Boche, D., Brosseron, F., Teunissen, C., Zetterberg, H., Jacobs, A. H., et al. (2025) · Nature Reviews Immunology · doi:10.1038/s41577-024-01104-7 · Cited by 638
Tau and neuroinflammation in Alzheimer’s disease: interplay mechanisms and clinical translation
Chen, Y., & Yu, Y. (2023) · Journal of Neuroinflammation · doi:10.1186/s12974-023-02853-3 · Cited by 516
Self-citationProtein acylation: mechanisms, biological functions and therapeutic targets
Shang, S., Liu, J., & Hua, F. (2022) · Signal Transduction and Targeted Therapy · doi:10.1038/s41392-022-01245-y · Cited by 261
Updates in Alzheimer's disease: from basic research to diagnosis and therapies
Liu, E., Zhang, Y., & Wang, J. (2024) · Translational Neurodegeneration · doi:10.1186/s40035-024-00432-x · Cited by 241
Metadata
- Authors
- Trzeciakiewicz, H., Ajit, D., Tseng, J.-H., Chen, Y., Ajit, A., Tabassum, Z., Lobrovich, R., Peterson, C., Riddick, N. V., Itano, M. S., Tripathy, A., Moy, S. S., Lee, V. M. Y., Trojanowski, J. Q., Irwin, D. J., & Cohen, T. J.
- Affiliations
- University of North Carolina at Chapel Hill (US)
- University of Pennsylvania (US)
- Corresponding author
- Cohen, Todd J.
- ORCID
- Venue
- Nature Communications
- Published
- 2020-11-02
- Volume
- 11
- Issue
- 1
- Pages
- 5522-5522
- ISSN
- 2041-1723 (ISSN-L)
- PMC
- PMC7606452
- OpenAlex
- W3096112623
- Cited by
- 102
- References
- 65
- Citations by year
- 2026: 11 · 2025: 21 · 2024: 21 · 2023: 18 · 2022: 22 · 2021: 9
- FWCI
- 7.67
- Type
- journal article
- Language
- en
- Open access
- gold
- doi.org
- Locations
- Nature Communications (publishedVersion, cc-by)
- PubMed Central (publishedVersion, cc-by)
- PubMed (publishedVersion)
- Carolina Digital Repository (University of North Carolina at Chapel Hill) (submittedVersion)
- RePEc: Research Papers in Economics (submittedVersion)
- DOAJ (DOAJ: Directory of Open Access Journals) (submittedVersion, cc-by-sa)
- UNC Libraries
- Funders
- U.S. Department of Health & Human Services | NIH | National Center for Advancing Translational Sciences (UL1TR001111)
- Alzheimer’s Association (NIRG-14-321219)
- Association for Frontotemporal Degeneration (-)
- U.S. Department of Health & Human Services | NIH | National Institute on Aging (R21AG058080)
- CurePSP (656-2018-06)
- American Federation for Aging Research (RAG15247)
- Topics
- Life Sciences › Neuroscience › Cellular and Molecular Neuroscience › Alzheimer's disease research and treatments
- Life Sciences › Biochemistry, Genetics and Molecular Biology › Molecular Biology › Histone Deacetylase Inhibitors Research
- Health Sciences › Medicine › Psychiatry and Mental health › Dementia and Cognitive Impairment Research
- Keywords
- HDAC6, tau acetylation, tauopathy, Alzheimer's disease, tau hyperphosphorylation, protein deacetylation, chaperone complex, tau aggregation, neuritic plaques, cognitive decline, tau transgenic mice, neurodegeneration
- MeSH terms
- Histone Deacetylase 6, Acetylation, Aged, Aged, 80 and over, Animals, Brain, Disease Models, Animal, Female, Humans, Male, Mice, Transgenic, Middle Aged, Phosphorylation, Protein Processing, Post-Translational, tau Proteins, Disease Progression, Tauopathies, Mice, Cognitive Dysfunction
About these checks
Registry, retraction, Cites and statistics results are computed, not judged, with one exception: a printed reference that no index lists is read once by a model before it counts as a citation error. Claims are extracted by a model and kept only when their quote appears verbatim in the text; each cited source is then checked, with a model’s help, for whether it says what the claim relies on. Those verdicts can be wrong — read the claim’s quote and the cited source before relying on one.
Statistics and arithmetic are recomputed, not judged.
Confidence bands are shown only for fields calibrated on our annotated test set. None is calibrated yet, so no band is shown.
What counts as a claim ›How we measure confidence ›How we check this ›
Are you an author, or do you see a problem with this page? Request a review
