

The DOI matches its Crossref record; 91 of the 93 references it cites were found in a registry or an index.
Directing reaction pathways via in situ control of active site geometries in PdAu single-atom alloy catalysts
Open accessAbstract
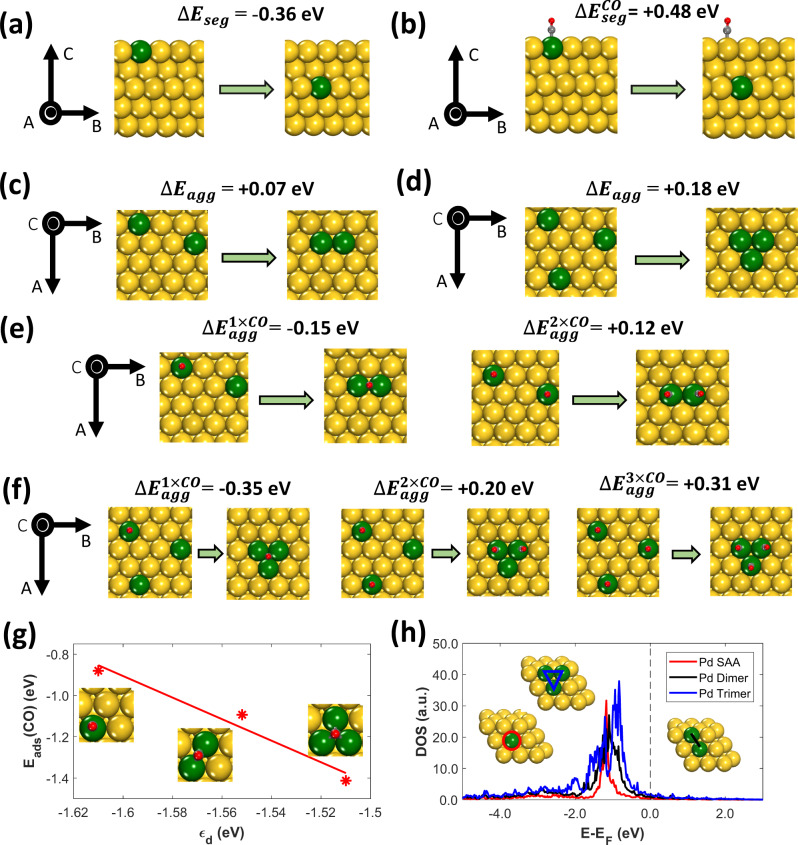
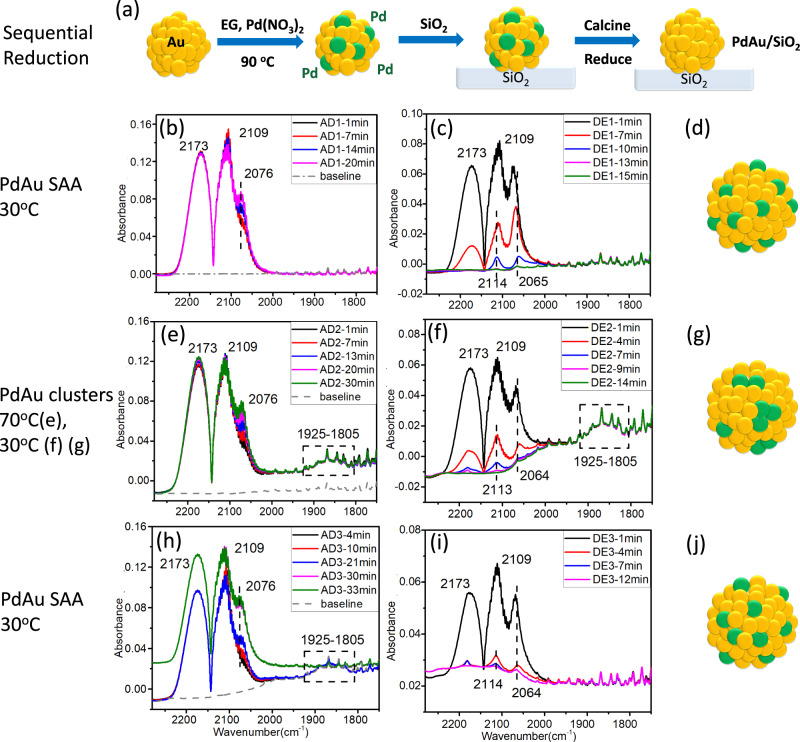
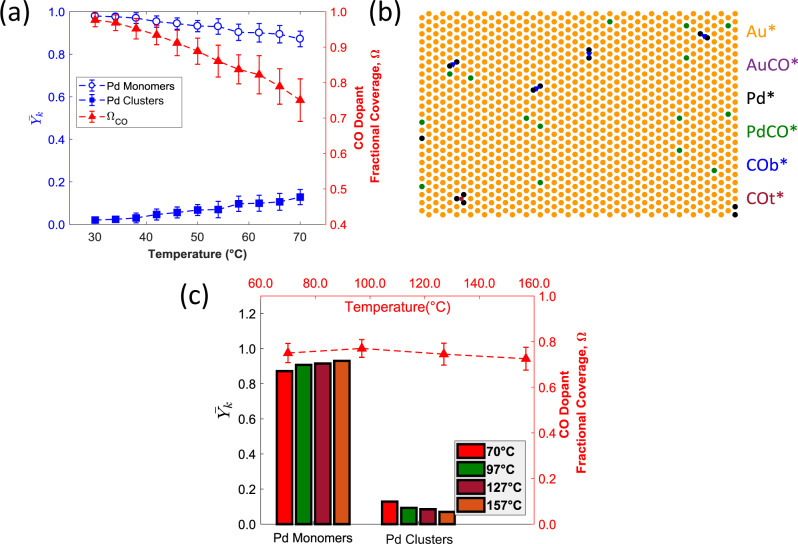
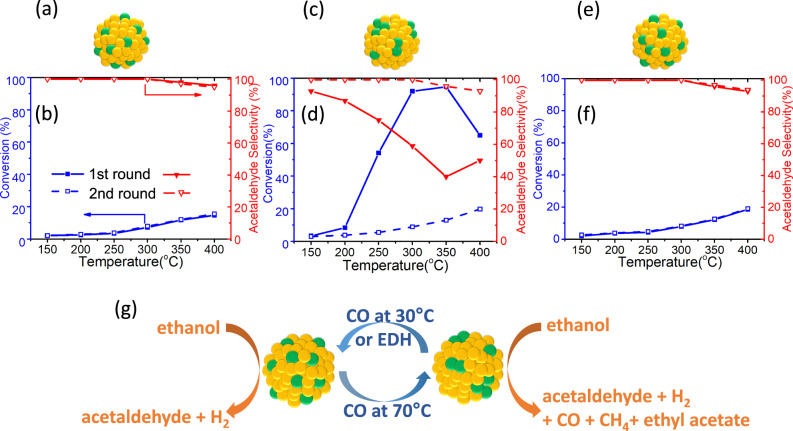
The atomic scale structure of the active sites in heterogeneous catalysts is central to their reactivity and selectivity. Therefore, understanding active site stability and evolution under different reaction conditions is key to the design of efficient and robust catalysts. Herein we describe theoretical calculations which predict that carbon monoxide can be used to stabilize different active site geometries in bimetallic alloys and then demonstrate experimentally that the same PdAu bimetallic catalyst can be transitioned between a single-atom alloy and a Pd cluster phase. Each state of the catalyst exhibits distinct selectivity for the dehydrogenation of ethanol reaction with the single-atom alloy phase exhibiting high selectivity to acetaldehyde and hydrogen versus a range of products from Pd clusters. First-principles based Monte Carlo calculations explain the origin of this active site ensemble size tuning effect, and this work serves as a demonstration of what should be a general phenomenon that enables in situ control over catalyst selectivity.
Overview
The claims and statistics of this paper haven’t been checked yet.
Run the check — free, no account needed. It reads the open-access text and checks the sources it cites.
Integrity signals
Registry
Cites
Statistics
Figures
Verification
Claims the paper makes
The claims and statistics of this paper haven’t been checked yet.
Run the check — free, no account needed. It reads the open-access text and checks the sources it cites.
Claims other papers make about this one
Each is checked against this paper’s own text: does it say what the citing paper says it does?
The check wasn’t confident either way, so it gives no verdict — never disputed.
In the citing paper
“These carbon skeleton materials can provide some active sites for the carriers and prevent the aggregation of metal particles”
From Carbon Aerogels Loaded with Noble Metal Nanocrystal Electrocatalysts for Efficient Full Water Splitting (2023) · cites this paper as [27]
Experimental — accuracy not yet measured
Self-check
Percentages, sums and reported differences re-computed from the paper’s own numbers.
The self-check needs the paper’s full text.
Citations
Cites
Generalized Gradient Approximation Made Simple
Perdew, J. P., Burke, K., & Ernzerhof, M. (1996) · Physical Review Letters · doi:10.1103/physrevlett.77.3865 · Cited by 215,824
Projector augmented-wave method
Blöchl, P. E. (1994) · Physical Review B · doi:10.1103/physrevb.50.17953 · Cited by 92,732
Kresse, G., & Furthmüller, J. (1996) · Computational Materials Science · doi:10.1016/0927-0256(96)00008-0 · Cited by 76,871
Hammer, B., Hansen, L. B., & Nørskov, J. K. (1999) · Physical Review B · doi:10.1103/physrevb.59.7413 · Cited by 8,270
Why gold is the noblest of all the metals
Hammer, B., & Norskov, J. K. (1995) · Nature · doi:10.1038/376238a0 · Cited by 3,935
Ab initio molecular dynamics for liquid metals
Kresse, G. (1995) · Journal of Non-Crystalline Solids · doi:10.1016/0022-3093(95)00355-x · Cited by 2,160
Solvent-Free Oxidation of Primary Alcohols to Aldehydes Using Au-Pd/TiO2 Catalysts
Enache, D., Edwards, J. K., Landon, P., Solsona-Espriu, B., Carley, A., Herzing, A., Watanabe, M., Kiely, C., Knight, D., & Hutchings, G. (2006) · Science · doi:10.1126/science.1120560 · Cited by 1,929
Surface free energies of solid metals: Estimation from liquid surface tension measurements
Tyson, W., & Miller, W. (1977) · Surface Science · doi:10.1016/0039-6028(77)90442-3 · Cited by 1,713
Activity Descriptors for CO 2 Electroreduction to Methane on Transition-Metal Catalysts
Peterson, A. A., & Nørskov, J. K. (2012) · The Journal of Physical Chemistry Letters · doi:10.1021/jz201461p · Cited by 1,667
Reaction-Driven Restructuring of Rh-Pd and Pt-Pd Core-Shell Nanoparticles
Tao, F., Grass, M., Zhang, Y.-W., Butcher, D. R., Renzas, J. R., Liu, Z., Chung, J.-Y., Mun, B., Salmeron, M., & Somorjai, G. (2008) · Science · doi:10.1126/science.1164170 · Cited by 1,157
A review on reforming bio-ethanol for hydrogen production
Ni, M., Leung, D., & Leung, M. (2007) · International Journal of Hydrogen Energy · doi:10.1016/j.ijhydene.2007.04.038 · Cited by 1,137
Hannagan, R. T., Giannakakis, G., Flytzani‐Stephanopoulos, M., & Sykes, E. C. H. (2020) · Chemical Reviews · doi:10.1021/acs.chemrev.0c00078 · Cited by 1,034
Self-citationFeibelman, P. J., Hammer, B., Nørskov, J. K., Wagner, F. R., Scheffler, M., Stumpf, R., Watwe, R. M., & Dumesic, J. A. (2000) · The Journal of Physical Chemistry B · doi:10.1021/jp002302t · Cited by 734
Mezey, L. Z., & Giber, J. (1982) · Japanese Journal of Applied Physics · doi:10.1143/jjap.21.1569 · Cited by 655
Pt/Cu single-atom alloys as coke-resistant catalysts for efficient C–H activation
Marcinkowski, M. D., Darby, M. T., Liu, J., Wimble, J. M., Lucci, F. R., Lee, S., Michaelides, A., Flytzani‐Stephanopoulos, M., Stamatakis, M., & Sykes, E. C. H. (2018) · Nature Chemistry · doi:10.1038/nchem.2915 · Cited by 640
Self-citationCharacterization of Oxide Surfaces and Zeolites by Carbon Monoxide as an IR Probe Molecule
Hadjiivanov, K., & Vayssilov, G. N. (2003) · doi:10.1002/chin.200317296 · Cited by 616
Selective hydrogenation of 1,3-butadiene on platinum–copper alloys at the single-atom limit
Lucci, F. R., Liu, J., Marcinkowski, M. D., Yang, M., Allard, L. F., Flytzani‐Stephanopoulos, M., & Sykes, E. C. H. (2015) · Nature Communications · doi:10.1038/ncomms9550 · Cited by 602
Self-citationProbing the surfaces of heterogeneous catalysts by in situ IR spectroscopy
Lamberti, C., Zecchina, A., Groppo, E., & Bordiga, S. (2010) · Chemical Society Reviews · doi:10.1039/c0cs00117a · Cited by 500
Single-Atom Alloys as a Reductionist Approach to the Rational Design of Heterogeneous Catalysts
Giannakakis, G., Flytzani‐Stephanopoulos, M., & Sykes, E. C. H. (2018) · Accounts of Chemical Research · doi:10.1021/acs.accounts.8b00490 · Cited by 420
Self-citationDesigning Pd-on-Au Bimetallic Nanoparticle Catalysts for Trichloroethene Hydrodechlorination
Nutt, M. O., Hughes, J. B., & Wong, M. S. (2005) · Environmental Science & Technology · doi:10.1021/es048560b · Cited by 391 · cited 1×
“(5), negative values of ΔEagg suggest that the formation of aggregates of Pd atoms is thermodynamically favored over the formation of isolated Pd atoms, while the opposite is true for ΔEagg > 0.”
BackgroundKellogg, G. (1994) · doi:10.1016/0167-5729(94)90007-8 · Cited by 339
Darby, M. T., Stamatakis, M., Michaelides, A., & Sykes, E. C. H. (2018) · The Journal of Physical Chemistry Letters · doi:10.1021/acs.jpclett.8b01888 · Cited by 326
Self-citationCrossley, A., & King, D. (1977) · doi:10.1016/0039-6028(77)90245-x · Cited by 298
Catalyst deactivation via decomposition into single atoms and the role of metal loading
Goodman, E. D., Johnston‐Peck, A. C., Dietze, E. M., Wrasman, C. J., Hoffman, A. S., Abild‐Pedersen, F., Bare, S. R., Pleßow, P. N., & Cargnello, M. (2019) · Nature Catalysis · doi:10.1038/s41929-019-0328-1 · Cited by 291
Self-citationBimetallic synergy in cobalt–palladium nanocatalysts for CO oxidation
Wu, C., Liu, C., Su, D., Xin, H.-L. L., Fang, H., Eren, B., Zhang, S., Murray, C., & Salmeron, M. (2018) · Nature Catalysis · doi:10.1038/s41929-018-0190-6 · Cited by 246
A graph-theoretical kinetic Monte Carlo framework for on-lattice chemical kinetics
Stamatakis, M., & Vlachos, D. G. (2011) · The Journal of Chemical Physics · doi:10.1063/1.3596751 · Cited by 242
Self-citationElucidating the Stability and Reactivity of Surface Intermediates on Single-Atom Alloy Catalysts
Darby, M. T., Réocreux, R., Sykes, E. C. H., Michaelides, A., & Stamatakis, M. (2018) · ACS Catalysis · doi:10.1021/acscatal.8b00881 · Cited by 231
Self-citationGao, F., Wang, Y.-L., & Goodman, D. (2009) · Journal of the American Chemical Society · doi:10.1021/ja9008437 · Cited by 216
Stamatakis, M., & Vlachos, D. (2012) · doi:10.1002/chin.201306198 · Cited by 211
Self-citationDesign of a Pd–Au Nitrite Reduction Catalyst by Identifying and Optimizing Active Ensembles
Li, H., Guo, S., Shin, K., Wong, M. S., & Henkelman, G. (2019) · ACS Catalysis · doi:10.1021/acscatal.9b02182 · Cited by 199
Molecular adsorption at Pt(111). How accurate are DFT functionals?
Gautier, S., Steinmann, S., Michel, C., Fleurat-Lessard, P., & Sautet, P. (2015) · Physical Chemistry, Chemical Physics - PCCP · doi:10.1039/c5cp04534g · Cited by 190
Shan, J., Liu, J., Li, M., Lustig, S., Lee, S., & Flytzani‐Stephanopoulos, M. (2017) · Applied Catalysis B: Environmental · doi:10.1016/j.apcatb.2017.12.059 · Cited by 190
Self-citationSachtler, J. W. A., & Somorjai, G. (1983) · Journal of Catalysis · doi:10.1016/0021-9517(83)90148-3 · Cited by 187 · cited 1×
“(8) after reaching stationary conditions.”
Pérez-Temprano, M. H., Casares, J. A., & Espinet, P. (2012) · Chemistry · doi:10.1002/chem.201102888 · Cited by 183
Guan, Y.-J., & Hensen, E. E. (2009) · doi:10.1016/j.apcata.2009.03.033 · Cited by 178
Nielsen, J. H., d’Avezac, M., Hetherington, J., & Stamatakis, M. (2013) · The Journal of Chemical Physics · doi:10.1063/1.4840395 · Cited by 177
Self-citationGao, F., Wang, Y.-L., & Goodman, D. (2009) · doi:10.1021/jp9053132 · Cited by 158
Surface diffusion by an atomic exchange mechanism
Wrigley, J. D. (1980) · doi:10.1103/physrevlett.44.661 · Cited by 154
Shan, J., Janvelyan, N., Li, H., Liu, J.-L., Egle, T., Ye, J., Biener, M., Biener, J., Friend, C., & Flytzani-Stephanopoulos, M. (2017) · doi:10.1016/j.apcatb.2016.12.045 · Cited by 148
Self-citationCarbon Monoxide Poisoning Resistance and Structural Stability of Single Atom Alloys
Darby, M. T., Sykes, E., Michaelides, A., & Stamatakis, M. (2018) · Topics in catalysis · doi:10.1007/s11244-017-0882-1 · Cited by 140
Self-citationKinetic modelling of heterogeneous catalytic systems
Stamatakis, M. (2014) · Journal of Physics Condensed Matter · doi:10.1088/0953-8984/27/1/013001 · Cited by 123
Self-citationCharacterization and Chemical Properties of Pd-Au Alloy Surfaces †
Wei, T., Wang, J., & Goodman, D. (2007) · doi:10.1021/jp067177l · Cited by 121
Wrasman, C. J., Boubnov, A., Riscoe, A. R., Hoffman, A. S., Bare, S., & Cargnello, M. (2018) · Journal of the American Chemical Society · doi:10.1021/jacs.8b07515 · Cited by 119
Self-citationDual role of CO in the stability of subnano Pt clusters at the Fe3O4(001) surface
Bliem, R., van der Hoeven, J. V. D., Hulva, J., Pavelec, J., Gamba, O., de Jongh, P. D., Schmid, M., Blaha, P., Diebold, U., & Parkinson, G. (2016) · Proceedings of the National Academy of Sciences of the United States of America · doi:10.1073/pnas.1605649113 · Cited by 118
Zhu, B., Thrimurthulu, G., Delannoy, L., Louis, C., Mottet, C., Creuze, J., Legrand, B., & Guesmi, H. (2013) · Journal of Catalysis · doi:10.1016/j.jcat.2013.08.022 · Cited by 118
Self-diffusion on copper surfaces
Hansen, L. T., Stoltze, P., Jacobsen, K., & Nørskov, J. (1991) · doi:10.1103/physrevb.44.6523 · Cited by 101
Innovation and science in the process industry: Steam reforming and hydrogenolysis
Rostrup-Nielsen, J., & Alstrup, I. (1999) · doi:10.1016/s0920-5861(99)00125-x · Cited by 100
Li, H., & Henkelman, G. (2017) · The Journal of Physical Chemistry C · doi:10.1021/acs.jpcc.7b09953 · Cited by 99
Tierney, H. L., Baber, A. E., & Sykes, E. (2009) · doi:10.1021/jp809766d · Cited by 92
Self-citationKim, H. Y., & Henkelman, G. (2013) · doi:10.1021/cs4006259 · Cited by 90
Segregation at the surface of an Au/Pd alloy exposed to CO
Soto-Verdugo, V., & Metiu, H. (2007) · doi:10.1016/j.susc.2007.08.022 · Cited by 88
Mccue, A., & Anderson, J. A. (2015) · doi:10.1016/j.jcat.2015.06.002 · Cited by 87
Lazić, P., Alaei, M., Atodiresei, N., Caciuc, V., Brako, R., & Blügel, S. (2010) · doi:10.1103/physrevb.81.045401 · Cited by 87
Giannakakis, G., Trimpalis, A., Shan, J., Qi, Z., Cao, S., Liu, J.-L., Ye, J., Biener, J., & Flytzani-Stephanopoulos, M. (2018) · Topics in catalysis · doi:10.1007/s11244-017-0883-0 · Cited by 86
Self-citationDynamics of Surface Alloys: Rearrangement of Pd/Ag(111) Induced by CO and O2
van Spronsen, M. V., Daunmu, K., O'Connor, C. R., Egle, T., Kersell, H., Oliver-Meseguer, J., Salmeron, M., Madix, R., Sautet, P., & Friend, C. (2018) · Journal of Physical Chemistry C · doi:10.1021/acs.jpcc.8b08849 · Cited by 85
CO-Induced Aggregation and Segregation of Highly Dilute Alloys: A Density Functional Theory Study
Papanikolaou, K. G., Darby, M. T., & Stamatakis, M. (2019) · The Journal of Physical Chemistry C · doi:10.1021/acs.jpcc.9b00649 · Cited by 79
Self-citationPalladium–gold single atom alloy catalysts for liquid phase selective hydrogenation of 1-hexyne
Liu, J.-L., Shan, J., Lucci, F. R., Cao, S., Sykes, E., & Flytzani-Stephanopoulos, M. (2017) · doi:10.1039/c7cy00794a · Cited by 77
Self-citationLiu, J.-L., Uhlman, M. B., Montemore, M., Trimpalis, A., Giannakakis, G., Shan, J., Cao, S., Hannagan, R. T., Sykes, E., & Flytzani-Stephanopoulos, M. (2019) · ACS Catalysis · doi:10.1021/acscatal.9b00491 · Cited by 73
Self-citationVannice, M., & Wang, S.-Y. (1981) · doi:10.1021/j150617a026 · Cited by 70
Reshaping of Metal Nanoparticles in Reaction Conditions.
Zhu, B.-E., Meng, J., Yuan, W.-T., Zhang, X., Yang, H.-S., Wang, Y., & Gao, Y. (2020) · Angewandte Chemie · doi:10.1002/anie.201906799 · Cited by 69
Adding Pieces to the CO/Pt(111) Puzzle: The Role of Dispersion
Janthon, P., Viñes, F., Sirijaraensre, J., Limtrakul, J. P., & Illas, F. (2017) · The Journal of Physical Chemistry C · doi:10.1021/acs.jpcc.7b00365 · Cited by 69
Study of Supported PtCu and PdAu Bimetallic Nanoparticles Using In-Situ X-ray Tools†
Oxford, S., Lee, P., Chupas, P., Chapman, K., Kung, M., & Kung, H. (2010) · doi:10.1021/jp103675n · Cited by 67
Enhancing catalytic performance of dilute metal alloy nanomaterials
Luneau, M., Guan, E.-J., Chen, W., Foucher, A. C., Marcella, N., Shirman, T., Verbart, D. M. A., Aizenberg, J., Aizenberg, M., Stach, E., et al. (2020) · Communications Chemistry · doi:10.1038/s42004-020-0293-2 · Cited by 66
Ward, T., Delannoy, L., Hahn, R., Kendell, S., Pursell, C., Louis, C., & Chandler, B. (2013) · doi:10.1021/cs400569v · Cited by 64
Restructuring of AuPd Nanoparticles Studied by a Combined XAFS/DRIFTS Approach
Gibson, E., Beale, A., Catlow, C. A., Chutia, A., Gianolio, D., Gould, A. L., Kroner, A., Mohammed, K., Perdjon, M., Rogers, S., et al. (2015) · doi:10.1021/acs.chemmater.5b00866 · Cited by 63
Theoretical modeling of zeolite catalysis: Nitrogen oxide catalysis over metal-exchanged zeolites
Agrios, A. G., & Gray, K. (2005) · doi:10.1201/9781420027679 · Cited by 63 · cited 1×
“(4) while in the presence of chemisorbed CO is given by Eq.”
BackgroundMamatkulov, M., Yudanov, I. V., Bukhtiyarov, A. V., Prosvirin, I. P., Bukhtiyarov, V. I., & Neyman, K. M. (2018) · The Journal of Physical Chemistry C · doi:10.1021/acs.jpcc.8b07402 · Cited by 60
Equilibrium Shape of Metal Nanoparticles under Reactive Gas Conditions
Zhu, B., Meng, J., & Gao, Y. (2017) · The Journal of Physical Chemistry C · doi:10.1021/acs.jpcc.6b13021 · Cited by 58
Lu, Z., Yadav, S., & Singh, C. V. (2019) · Catalysis Science & Technology · doi:10.1039/c9cy02070e · Cited by 48
Wang, C., Ouyang, M., Li, M.-W., Lee, S., & Flytzani-Stephanopoulos, M. (2019) · Applied Catalysis A : General · doi:10.1016/j.apcata.2019.05.006 · Cited by 44
Self-citationEvans, E., Li, H., Yu, W.-Y., Mullen, G. M., Henkelman, G., & Mullins, C. (2017) · Physical Chemistry, Chemical Physics - PCCP · doi:10.1039/c7cp05097f · Cited by 44
Role of Small Pd Ensembles in Boosting CO Oxidation in AuPd Alloys.
Ham, H., Stephens, J. A., Hwang, G.-S., Han, J., Nam, S., & Lim, T. (2012) · Journal of Physical Chemistry Letters · doi:10.1021/jz201585q · Cited by 42
Engineering the Surface Architecture of Highly Dilute Alloys: An ab Initio Monte Carlo Approach
Papanikolaou, K. G., Darby, M. T., & Stamatakis, M. (2020) · ACS Catalysis · doi:10.1021/acscatal.9b04029 · Cited by 40
Self-citationAtomically Dispersed Pd Supported on Zinc Oxide for Selective Nonoxidative Ethanol Dehydrogenation
Ouyang, M., Cao, S., Yang, S.-Z., Li, M.-W., & Flytzani-Stephanopoulos, M. (2020) · doi:10.1021/acs.iecr.9b05202 · Cited by 38
Self-citationHanrieder, E. K., Jentys, A., & Lercher, J. (2015) · doi:10.1021/acscatal.5b01140 · Cited by 36
An, H., Ha, H., Yoo, M., & Kim, H. Y. (2017) · Nanoscale · doi:10.1039/c7nr04435f · Cited by 31
García-Mota, M., & López, N. (2010) · doi:10.1103/physrevb.82.075411 · Cited by 25
Nadeem, M., Majeed, I., Waterhouse, G. I. N., & Idriss, H. (2015) · doi:10.1179/2055075814y.0000000008 · Cited by 23
The effect of single pd atoms on the energetics of recombinative O2 desorption from Au(111)
Lucci, F. R., Zhang, L., Thuening, T., Uhlman, M. B., Schilling, A., Henkelman, G., & Sykes, E. (2018) · Surface Science · doi:10.1016/j.susc.2018.08.001 · Cited by 21
Self-citationSurface Composition Evolution of Bimetallic Alloys under Reaction Conditions
Meng, J., Zhu, B.-E., & Gao, Y. (2019) · Journal of Physical Chemistry C · doi:10.1021/acs.jpcc.9b08398 · Cited by 20
Toyoshima, R., Hiramatsu, N., Yoshida, M., Amemiya, K., Mase, K., Mun, B., & Kondoh, H. (2016) · doi:10.1021/acs.jpcc.5b10661 · Cited by 17
Wang, Q., Xia, G., Zhao, Z.-L., Zhu, Y.-M., Shi, X., Huang, L.-M., Wang, Y.-G., & Gu, M. (2020) · Nano Energy · doi:10.1016/j.nanoen.2020.105099 · Cited by 16
Insight into restructuring of Pd-Au nanoparticles using EXAFS
Boubnov, A., Timoshenko, J., Wrasman, C. J., Hoffman, A. S., Cargnello, M., Frenkel, A., & Bare, S. (2020) · doi:10.1016/j.radphyschem.2019.04.054 · Cited by 14
Self-citationPdAu-catalyzed oxidation through in situ generated H2O2 in simulated produced water
Yin, Y.-Y., Heck, K. N., Coonrod, C. L., Powell, C. D., Guo, S.-J., Reynolds, M. A., & Wong, M. (2020) · doi:10.1016/j.cattod.2019.05.001 · Cited by 14
A Caching Scheme to Accelerate Kinetic Monte Carlo Simulations of Catalytic Reactions.
Ravipati, S., d'Avezac, M., Nielsen, J., Hetherington, J., & Stamatakis, M. (2020) · Journal of Physical Chemistry A · doi:10.1021/acs.jpca.0c03571 · Cited by 13
Self-citationPapanikolaou, K. G., & Stamatakis, M. (2020) · Frontiers of nanoscience · doi:10.1016/b978-0-12-821495-4.00007-5 · Cited by 11
Self-citationSavva, G. D., & Stamatakis, M. (2020) · Journal of Physical Chemistry A · doi:10.1021/acs.jpca.0c06871 · Cited by 10
Self-citationOn the behaviour of structure-sensitive reactions on single atom and dilute alloy surfaces
Papanikolaou, K. G., & Stamatakis, M. (2020) · Catalysis science & technology · doi:10.1039/d0cy00904k · Cited by 6
Self-citationSchay, Z., & Tétényi, P. (1979) · doi:10.1039/f19797501001 · Cited by 6
Johnston-Peck, A., Goodman, E., Dietze, E., Wrasman, C. J., Hoffman, A. S., Abild-Pedersen, F., Bare, S., Plessow, P., & Cargnello, M. (2019) · doi:10.1002/https://doi.org/10.1038/s41929-019-0328-1 · Cited by 4
Self-citationComputational Modelling of Nanomaterials
(2020) · Frontiers of Nanoscience · doi:10.1016/c2018-0-03837-2 · Cited by 3
Cited by
Sorted by citations
Liu, L., & Corma, A. (2023) · Chemical Reviews · doi:10.1021/acs.chemrev.2c00733 · Cited by 712
Selectivity in Chemiresistive Gas Sensors: Strategies and Challenges
Bulemo, P. M., Kim, D., Shin, H., Cho, H., Koo, W., Choi, S., Park, C., Ahn, J., Güntner, A. T., Penner, R. M., et al. (2025) · Chemical Reviews · doi:10.1021/acs.chemrev.4c00592 · Cited by 481
Author Correction: Ensemble effect for single-atom, small cluster and nanoparticle catalysts
Guo, Y., Wang, M., Zhu, Q.-J., Xiao, D.-Q., & Ma, D. (2022) · Nature Catalysis · doi:10.1038/s41929-022-00839-7 · Cited by 358
Catalysis of Alloys: Classification, Principles, and Design for a Variety of Materials and Reactions
Nakaya, Y., & Furukawa, S. (2022) · Chemical Reviews · doi:10.1021/acs.chemrev.2c00356 · Cited by 427
Electrocatalytic nitrate reduction to ammonia on defective Au1Cu (111) single-atom alloys
Zhang, Y., Chen, X., Wang, W., Yin, L., & Crittenden, J. C. (2022) · Applied Catalysis B: Environmental · doi:10.1016/j.apcatb.2022.121346 · Cited by 322
Metadata
- Authors
- Ouyang, M., Papanikolaou, K. G., Boubnov, A., Hoffman, A. S., Giannakakis, G., Bare, S. R., Stamatakis, M., Flytzani-Stephanopoulos, M., & Sykes, E. C. H.
- Affiliations
- Tufts University (US)
- Thomas Young Centre (GB)
- SLAC National Accelerator Laboratory (US)
- Corresponding author
- Sykes, E. Charles H.
- ORCID
- Venue
- Nature Communications
- Published
- 2021-03-09
- Volume
- 12
- Issue
- 1
- Pages
- 1549-1549
- ISSN
- 2041-1723 (ISSN-L)
- PMC
- PMC7943817
- OpenAlex
- W3135341684
- Cited by
- 187
- References
- 93
- Citations by year
- 2026: 25 · 2025: 47 · 2024: 38 · 2023: 31 · 2022: 27 · 2021: 19
- FWCI
- 8.73
- Type
- journal article
- Language
- en
- Open access
- gold
- doi.org
- Locations
- Nature Communications (publishedVersion, cc-by)
- PubMed Central (publishedVersion, cc-by)
- PubMed (publishedVersion)
- eScholarship (California Digital Library) (submittedVersion, cc-by)
- RePEc: Research Papers in Economics (submittedVersion)
- DOAJ (DOAJ: Directory of Open Access Journals) (submittedVersion, cc-by-sa)
- UCL Discovery (University College London) (submittedVersion)
- OSTI OAI (U.S. Department of Energy Office of Scientific and Technical Information) (submittedVersion)
- Funders
- U.S. Department of Energy (DE-SC0004738, DE-SC0012573, DE-AC02-76SF00515)
- Topics
- Physical Sciences › Materials Science › Materials Chemistry › Catalytic Processes in Materials Science
- Physical Sciences › Chemical Engineering › Catalysis › Catalysis and Oxidation Reactions
- Physical Sciences › Chemistry › Organic Chemistry › Nanomaterials for catalytic reactions
- Keywords
- single-atom alloy catalysts, active site geometry, palladium clusters, ethanol dehydrogenation, acetaldehyde selectivity, hydrogen selectivity, Monte Carlo simulation, heterogeneous catalysis
About these checks
Registry, retraction, Cites and statistics results are computed, not judged, with one exception: a printed reference that no index lists is read once by a model before it counts as a citation error. Claims are extracted by a model and kept only when their quote appears verbatim in the text; each cited source is then checked, with a model’s help, for whether it says what the claim relies on. Those verdicts can be wrong — read the claim’s quote and the cited source before relying on one.
Statistics and arithmetic are recomputed, not judged.
Confidence bands are shown only for fields calibrated on our annotated test set. None is calibrated yet, so no band is shown.
What counts as a claim ›How we measure confidence ›How we check this ›
Are you an author, or do you see a problem with this page? Request a review
