Cited by 47

The DOI matches its Crossref record; 5 of the 5 references it cites were found in a registry or an index.

Cell reprogramming shapes the mitochondrial DNA landscape

Wei, Wei, Gaffney, Daniel J., Chinnery, Patrick F.·2021·Nature Communications

Abstract

Individual induced pluripotent stem cells (iPSCs) show considerable phenotypic heterogeneity, but the reasons for this are not fully understood. Comprehensively analysing the mitochondrial genome (mtDNA) in 146 iPSC and fibroblast lines from 151 donors, we show that most age-related fibroblast mtDNA mutations are lost during reprogramming. However, iPSC-specific mutations are seen in 76.6% (108/141) of iPSC lines at a mutation rate of 8.62 × 10⁻⁵/base pair. The mutations observed in iPSC lines affect a higher proportion of mtDNA molecules, favouring non-synonymous protein-coding and tRNA variants, including known disease-causing mutations. Analysing 11,538 single cells shows stable heteroplasmy in sub-clones derived from the original donor during differentiation, with mtDNA variants influencing the expression of key genes involved in mitochondrial metabolism and epidermal cell differentiation. Thus, the dynamic mtDNA landscape contributes to the heterogeneity of human iPSCs and should be considered when using reprogrammed cells experimentally or as a therapy.

Overview

The claims and statistics of this paper haven’t been checked yet.

Run the check — free, no account needed. It reads the open-access text and checks the sources it cites.

A few free checks a day · papers already verified open instantly · results are public

Integrity signals

Registry

Crossref · 10.1038/s41467-021-25482-x

Cites

5 of 5 references verified0 citation errors · 0 not checkable

Statistics

Figures

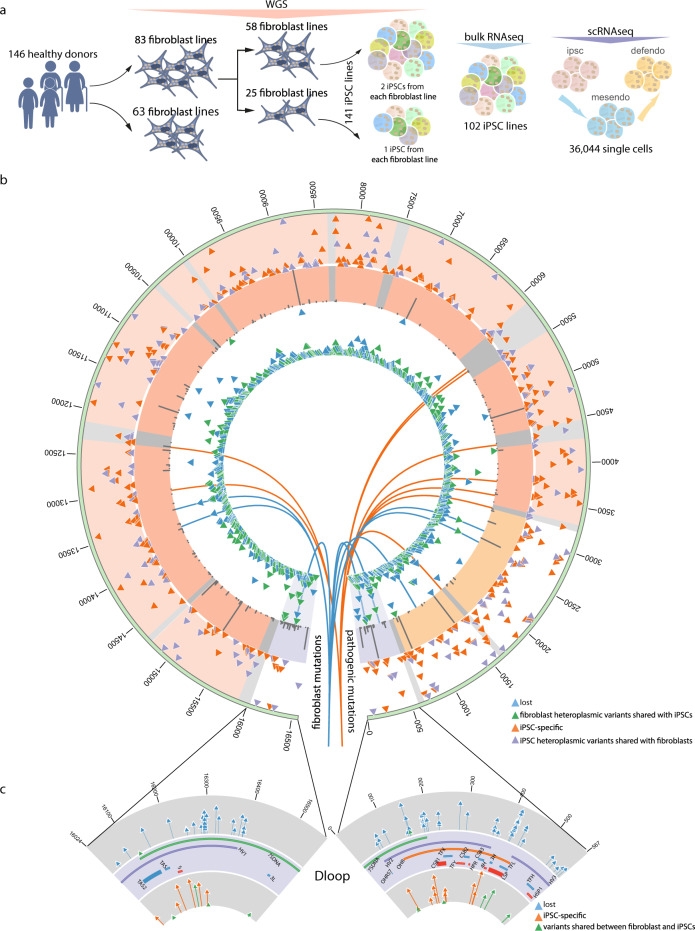
Fig. 1 mtDNA heteroplasmic variants detected from whole-genome sequences. a Summary of bulk whole-genome (WGS), bulk RNA and single-cell RNA (scRNA) sequencing data analysed in this study. Colour represents the heterogeneity of cell populations under WGS and bulk RNA-seq, and three different cell stages under scRNAseq, where mesendo = mesoderm, and defendo = definitive endoderm. b Heteroplasmic variants detected from WGS. Circos plot from outside the circle to inside: (1) mtDNA position; (2) heteroplasmic variants identified in 141 iPSC lines; (3) minor allele frequency of common variants (MAF > 1%) in European population55; mtDNA genes (purple— D-loop, red—coding region, yellow—rRNAs and grey—tRNAs); (4) heteroplasmic variants identified in fibroblast cell lines; (5) blue lines pointing to the positions of variants specific in fibroblast cell lines; (6) orange lines pointing to the positions of pathogenic mutations; (2) & (4) vertical axes represent the HFs; (3) vertical axes represent the frequencies of single-nucleotide substitutions. c High resolution of mtDNA D-loop region. Plots from top to bottom: (1) mtDNA position; (2) decrease shift variants; (3) D-loop regions; (4) increase shift variants; (2) & (4) vertical axes represent heteroplasmic shifts.
Fig. 1 mtDNA heteroplasmic variants detected from whole-genome sequences. a Summary of bulk whole-genome (WGS), bulk RNA and single-cell RNA (scRNA) sequencing data analysed in this study. Colour represents the heterogeneity of cell populations under WGS and bulk RNA-seq, and three different cell stages under scRNAseq, where mesendo = mesoderm, and defendo = definitive endoderm. b Heteroplasmic variants detected from WGS. Circos plot from outside the circle to inside: (1) mtDNA position; (2) heteroplasmic variants identified in 141 iPSC lines; (3) minor allele frequency of common variants (MAF > 1%) in European population55; mtDNA genes (purple— D-loop, red—coding region, yellow—rRNAs and grey—tRNAs); (4) heteroplasmic variants identified in fibroblast cell lines; (5) blue lines pointing to the positions of variants specific in fibroblast cell lines; (6) orange lines pointing to the positions of pathogenic mutations; (2) & (4) vertical axes represent the HFs; (3) vertical axes represent the frequencies of single-nucleotide substitutions. c High resolution of mtDNA D-loop region. Plots from top to bottom: (1) mtDNA position; (2) decrease shift variants; (3) D-loop regions; (4) increase shift variants; (2) & (4) vertical axes represent heteroplasmic shifts.CC BY · PubMed Central
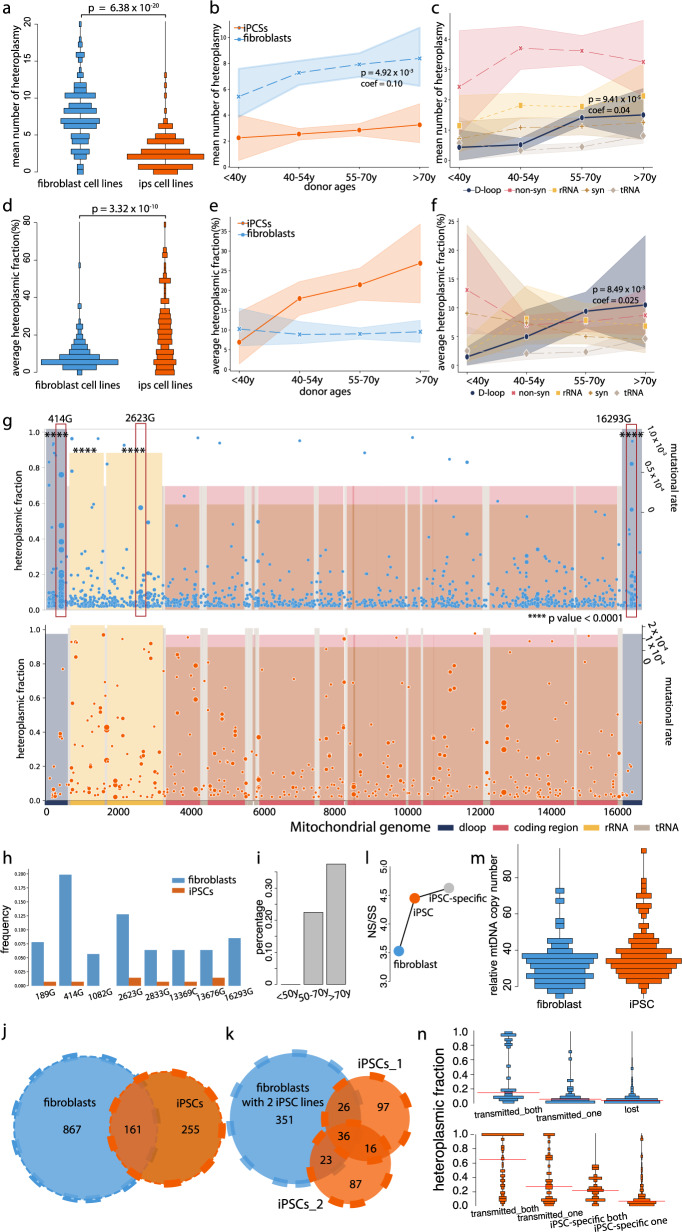
Fig. 2 Characteristics of mtDNA heteroplasmic variants detected through the bulk analysis of 146 fibroblast cell lines and 141 derived iPSC lines. a Distribution of the mean number of heteroplasmies defined in fibroblast and iPS cell lines. b Correlation of the mean number of heteroplasmies per fibroblast cell line with the donor’s age. Shaded regions show mean ± standard deviation (s.d.). c Correlation of the mean number of heteroplasmies per fibroblast cell line in each mtDNA region with the donor’s age. Shaded regions show mean ± s.d. d Distribution of the average heteroplasmy fraction (HF) in fibroblast and iPS cell lines. e Correlation of the average HF per fibroblast cell line with the donor’s age. Shaded regions show mean ± s.d. f Correlation of the average HF per fibroblast cell line in each mtDNA region with the donor’s age. Shaded regions show mean ± s.d. g Heteroplasmies defined in fibroblast (top) and iPS cell lines (bottom). HFs are shown on the left y axis. mtDNA regions covered by different colours. The depth of the shading represents the mutation rate of each mtDNA region (shown on the right side of y axis). Three fibroblast-specific mutations are highlighted in red rectangles. The regions were significantly enriched mutations than expected by chance were labelled by asterisks. h Frequency of specific mutations in fibroblast and iPS cell lines. i The fibroblast-specific mutation 414G was associated with the donor’s age. j Distribution of heteroplasmies defined in fibroblast and iPS cell lines. k Distribution of heteroplasmies defined in fibroblast and iPS cell lines, two iPSC lines derived from the same fibroblast cell line are shown separately. l Ratio of non-synonymous/synonymous variants (NS/SS) observed in fibroblasts, iPSCs and iPSC-specific variants. m Distribution of the mtDNA copy number in fibroblast and iPS cell lines. n Distribution of the heteroplasmy fraction in fibroblast and iPS cell lines. Red lines show the mean HFs within each dataset. a, d P values were calculated using two-sided Wilcoxon test. Source data are provided as a Source Data file. b, c, f P values were calculated using linear regression model. g P values were calculated using two-sided Fisher’s exact test.
Fig. 2 Characteristics of mtDNA heteroplasmic variants detected through the bulk analysis of 146 fibroblast cell lines and 141 derived iPSC lines. a Distribution of the mean number of heteroplasmies defined in fibroblast and iPS cell lines. b Correlation of the mean number of heteroplasmies per fibroblast cell line with the donor’s age. Shaded regions show mean ± standard deviation (s.d.). c Correlation of the mean number of heteroplasmies per fibroblast cell line in each mtDNA region with the donor’s age. Shaded regions show mean ± s.d. d Distribution of the average heteroplasmy fraction (HF) in fibroblast and iPS cell lines. e Correlation of the average HF per fibroblast cell line with the donor’s age. Shaded regions show mean ± s.d. f Correlation of the average HF per fibroblast cell line in each mtDNA region with the donor’s age. Shaded regions show mean ± s.d. g Heteroplasmies defined in fibroblast (top) and iPS cell lines (bottom). HFs are shown on the left y axis. mtDNA regions covered by different colours. The depth of the shading represents the mutation rate of each mtDNA region (shown on the right side of y axis). Three fibroblast-specific mutations are highlighted in red rectangles. The regions were significantly enriched mutations than expected by chance were labelled by asterisks. h Frequency of specific mutations in fibroblast and iPS cell lines. i The fibroblast-specific mutation 414G was associated with the donor’s age. j Distribution of heteroplasmies defined in fibroblast and iPS cell lines. k Distribution of heteroplasmies defined in fibroblast and iPS cell lines, two iPSC lines derived from the same fibroblast cell line are shown separately. l Ratio of non-synonymous/synonymous variants (NS/SS) observed in fibroblasts, iPSCs and iPSC-specific variants. m Distribution of the mtDNA copy number in fibroblast and iPS cell lines. n Distribution of the heteroplasmy fraction in fibroblast and iPS cell lines. Red lines show the mean HFs within each dataset. a, d P values were calculated using two-sided Wilcoxon test. Source data are provided as a Source Data file. b, c, f P values were calculated using linear regression model. g P values were calculated using two-sided Fisher’s exact test.CC BY · PubMed Central
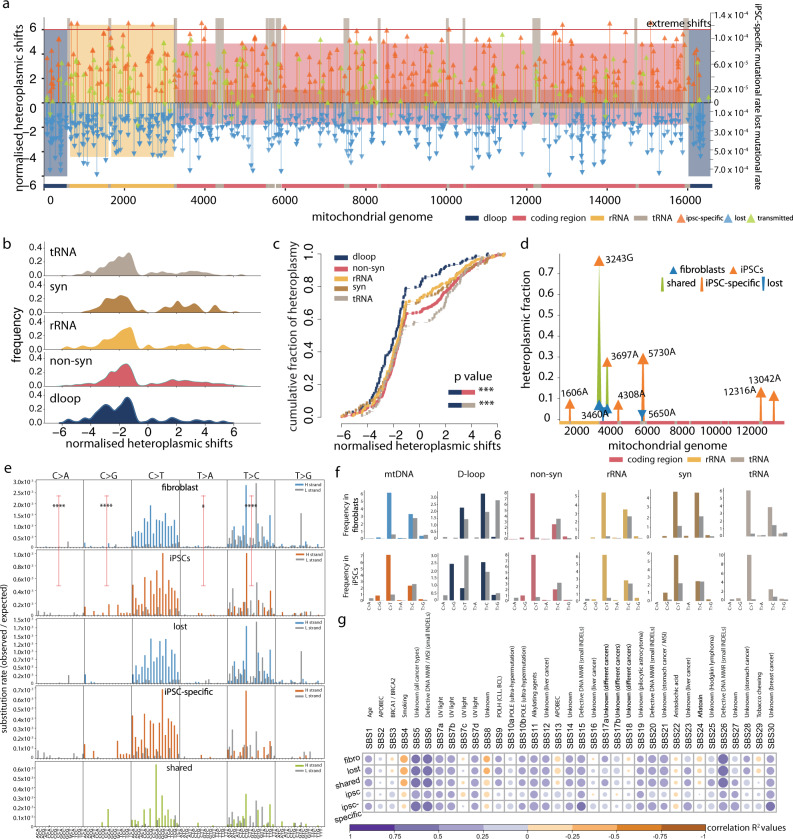
Fig. 3 The spectrum of mtDNA mutations changes during cell reprogramming. a Normalised heteroplasmic shifts (HS) estimated between 83 fibroblast cell lines and 141 derived iPSC lines. Normalised heteroplasmic shifts are shown on the left side of the y axis. mtDNA regions shown by different colours; the depth of shading represents the mutation rate of iPSC-specific variants and lost variants within each mtDNA region (shown on the right side of the y axis). Variants above the red lines were extreme shifts seen in iPSCs. Source data are provided as a Source Data file. b Distributions of the HS in different mtDNA regions. c Cumulative distributions of the HSs within each mtDNA region. P values were calculated using two-sided Fisher’s exact test. d Pathogenic mutations observed in this study. Different colours represent lost, iPSC-specific or shared mutations between fibroblast cell lines and derived iPSC lines. Blue triangles are HFs in fibroblasts and orange triangles are HFs in iPSCs. mtDNA regions shown at the bottom. e Trinucleotide mutational signature of heteroplasmic variants observed in fibroblasts, iPSCs, lost in fibroblasts, iPSC-specific and shared variants between fibroblasts and iPSCs. The bars represent the substitution rate, mutations from the H or L-strand are shown in different colours. P values were calculated using two-sided Fisher’s exact test. f Mutational signature of six categories (C > A, C > G, C > T, T > A, T > C & T > G) within each mtDNA region. The bars represent the relative frequency of each category. Mutations from the H or L-strand are shown in different colours. g Correlation between mutational signatures observed in this study with the cancer signatures. The gradients of circles correspond to correlation R2 values. The sizes of circles correspond to the p values (larger circles have smaller P values). The names of cancer signatures are shown at the top.
Fig. 3 The spectrum of mtDNA mutations changes during cell reprogramming. a Normalised heteroplasmic shifts (HS) estimated between 83 fibroblast cell lines and 141 derived iPSC lines. Normalised heteroplasmic shifts are shown on the left side of the y axis. mtDNA regions shown by different colours; the depth of shading represents the mutation rate of iPSC-specific variants and lost variants within each mtDNA region (shown on the right side of the y axis). Variants above the red lines were extreme shifts seen in iPSCs. Source data are provided as a Source Data file. b Distributions of the HS in different mtDNA regions. c Cumulative distributions of the HSs within each mtDNA region. P values were calculated using two-sided Fisher’s exact test. d Pathogenic mutations observed in this study. Different colours represent lost, iPSC-specific or shared mutations between fibroblast cell lines and derived iPSC lines. Blue triangles are HFs in fibroblasts and orange triangles are HFs in iPSCs. mtDNA regions shown at the bottom. e Trinucleotide mutational signature of heteroplasmic variants observed in fibroblasts, iPSCs, lost in fibroblasts, iPSC-specific and shared variants between fibroblasts and iPSCs. The bars represent the substitution rate, mutations from the H or L-strand are shown in different colours. P values were calculated using two-sided Fisher’s exact test. f Mutational signature of six categories (C > A, C > G, C > T, T > A, T > C & T > G) within each mtDNA region. The bars represent the relative frequency of each category. Mutations from the H or L-strand are shown in different colours. g Correlation between mutational signatures observed in this study with the cancer signatures. The gradients of circles correspond to correlation R2 values. The sizes of circles correspond to the p values (larger circles have smaller P values). The names of cancer signatures are shown at the top.CC BY · PubMed Central
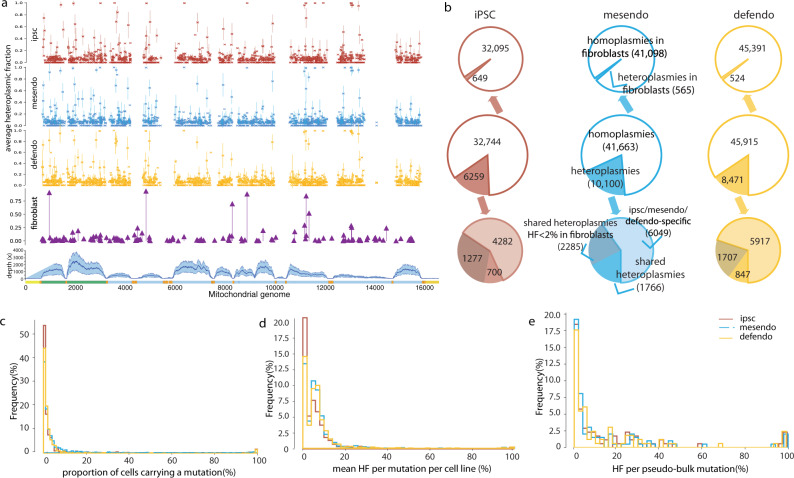
Fig. 4 Overview of mtDNA variants detected by single-cell RNA sequencing. a From top to bottom, mtDNA variants detected from single-cell RNA sequencing, cells defined as iPSC, mesendo and defendo stages are shown separately. Each dot represents the mean HF of each variant per cell line, and the error bar was 95% confidence interval; mtDNA variants observed in their fibroblast cells from bulk whole-genome sequencing (purple plot); mtDNA sequencing depth from single-cell RNA sequencing. Mean depth ± standard deviation (s.d.) is shown in the shaded area. Source data are provided as a Source Data file. b Overview of the variants detected in the single cells defined at iPSC, mesendo and defendo stages. The text labelled on mesendo stage also applies to the iPSC and defendo cell stages. c Distribution of the proportion of cells carrying the same variant from each cell line. The y axis shows the percentage of mtDNA variants. The majority of the variants were shared by a small proportion of cells from the same cell line. Cells defined as iPSCs, mesendo and defendo cells are shown in different colours. d Distribution of mean heteroplasmy fraction of each variant from each cell line. The y axis shows the percentage of mtDNA variants. The majority of the variants were low-level heteroplasmic variants (mean HF = sum HF/the number of cells carrying the same mutation). Cells defined as iPSCs, mesendo and defendo cells are shown in different colours. e Distribution of heteroplasmy fractions of pseudo-bulk variants from each cell line. The y axis shows the percentage of mtDNA variants. The majority of the variants were low-level heteroplasmic variants in pseudo-bulk heteroplasmy level (HF = sum HF / the total number of cells within each cell line). Cells defined as iPSCs, mesendo and defendo cells are shown in different colours.
Fig. 4 Overview of mtDNA variants detected by single-cell RNA sequencing. a From top to bottom, mtDNA variants detected from single-cell RNA sequencing, cells defined as iPSC, mesendo and defendo stages are shown separately. Each dot represents the mean HF of each variant per cell line, and the error bar was 95% confidence interval; mtDNA variants observed in their fibroblast cells from bulk whole-genome sequencing (purple plot); mtDNA sequencing depth from single-cell RNA sequencing. Mean depth ± standard deviation (s.d.) is shown in the shaded area. Source data are provided as a Source Data file. b Overview of the variants detected in the single cells defined at iPSC, mesendo and defendo stages. The text labelled on mesendo stage also applies to the iPSC and defendo cell stages. c Distribution of the proportion of cells carrying the same variant from each cell line. The y axis shows the percentage of mtDNA variants. The majority of the variants were shared by a small proportion of cells from the same cell line. Cells defined as iPSCs, mesendo and defendo cells are shown in different colours. d Distribution of mean heteroplasmy fraction of each variant from each cell line. The y axis shows the percentage of mtDNA variants. The majority of the variants were low-level heteroplasmic variants (mean HF = sum HF/the number of cells carrying the same mutation). Cells defined as iPSCs, mesendo and defendo cells are shown in different colours. e Distribution of heteroplasmy fractions of pseudo-bulk variants from each cell line. The y axis shows the percentage of mtDNA variants. The majority of the variants were low-level heteroplasmic variants in pseudo-bulk heteroplasmy level (HF = sum HF / the total number of cells within each cell line). Cells defined as iPSCs, mesendo and defendo cells are shown in different colours.CC BY · PubMed Central
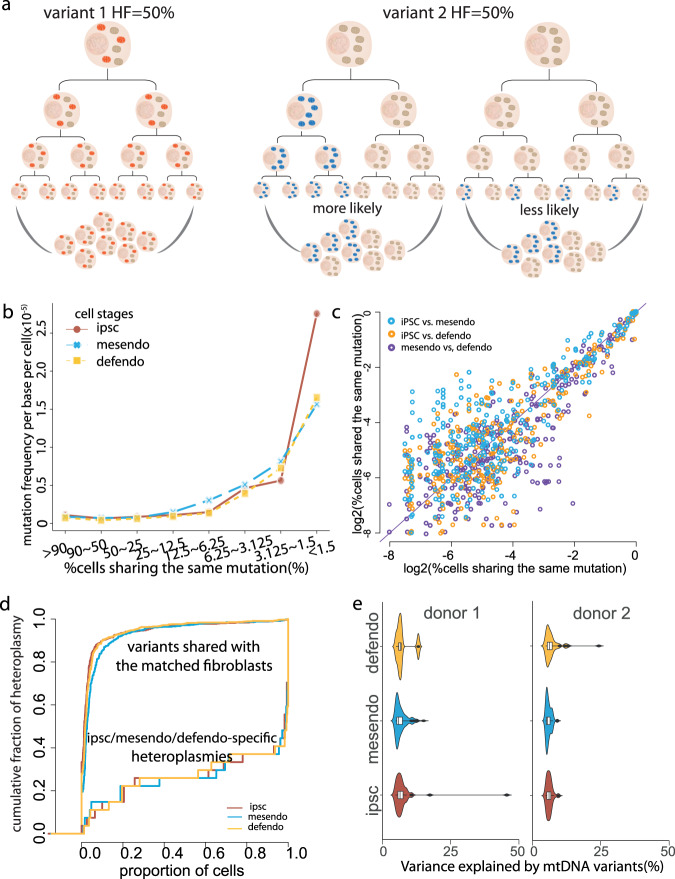
Fig. 5 Characteristics of mtDNA heteroplasmic variants detected by single-cell RNA sequencing. a Illustration of separate models explaining the variants with the same pseudo-bulk heteroplasmy level. A variant with 50% HF could be due to 100% of cells carrying ~50% HF heteroplasmic variants (left). Alternatively, a variant with 50% HF could be due to 50% of cells carrying homoplasmic variants in the population (right two graphs). In the middle, the variant was passed from the same ancestral cell. On the right, the variant mutated independently in a large proportion of cells. b The proportion of cells carrying the same variant from each cell line was grouped into different bins. Line plots show the distributions of the mutational rates estimated within each bin (where mutational rate = number of mutations within each bin from the same cell line divided by the number of cells from each cell line multiplied by 16569 (bp)). The mutational frequency profiles were consistent between the three cell stages. Cells defined as iPSCs, mesendo and defendo cells are shown in different colours. c Scatter plots of the log2 percentage of cells carrying the same variant from each cell line between any two of three cell stages. The HF for each individual mutation was highly correlated across all three cell stages. Source data are provided as a Source Data file. d Cumulative distribution of the heteroplasmic variants detected in each cell type. Variants shared with their matched fibroblast cell lines are shown in the upper left side, and iPSC/mesendo/defendo-specific variants are shown in the lower right side. e Violin and box plots show the percentage of the variance for gene expression explained by mtDNA variants from two independent cell lines. Cells defined as iPSCs, mesendo and defendo cells are shown in different colours.
Fig. 5 Characteristics of mtDNA heteroplasmic variants detected by single-cell RNA sequencing. a Illustration of separate models explaining the variants with the same pseudo-bulk heteroplasmy level. A variant with 50% HF could be due to 100% of cells carrying ~50% HF heteroplasmic variants (left). Alternatively, a variant with 50% HF could be due to 50% of cells carrying homoplasmic variants in the population (right two graphs). In the middle, the variant was passed from the same ancestral cell. On the right, the variant mutated independently in a large proportion of cells. b The proportion of cells carrying the same variant from each cell line was grouped into different bins. Line plots show the distributions of the mutational rates estimated within each bin (where mutational rate = number of mutations within each bin from the same cell line divided by the number of cells from each cell line multiplied by 16569 (bp)). The mutational frequency profiles were consistent between the three cell stages. Cells defined as iPSCs, mesendo and defendo cells are shown in different colours. c Scatter plots of the log2 percentage of cells carrying the same variant from each cell line between any two of three cell stages. The HF for each individual mutation was highly correlated across all three cell stages. Source data are provided as a Source Data file. d Cumulative distribution of the heteroplasmic variants detected in each cell type. Variants shared with their matched fibroblast cell lines are shown in the upper left side, and iPSC/mesendo/defendo-specific variants are shown in the lower right side. e Violin and box plots show the percentage of the variance for gene expression explained by mtDNA variants from two independent cell lines. Cells defined as iPSCs, mesendo and defendo cells are shown in different colours.CC BY · PubMed Central
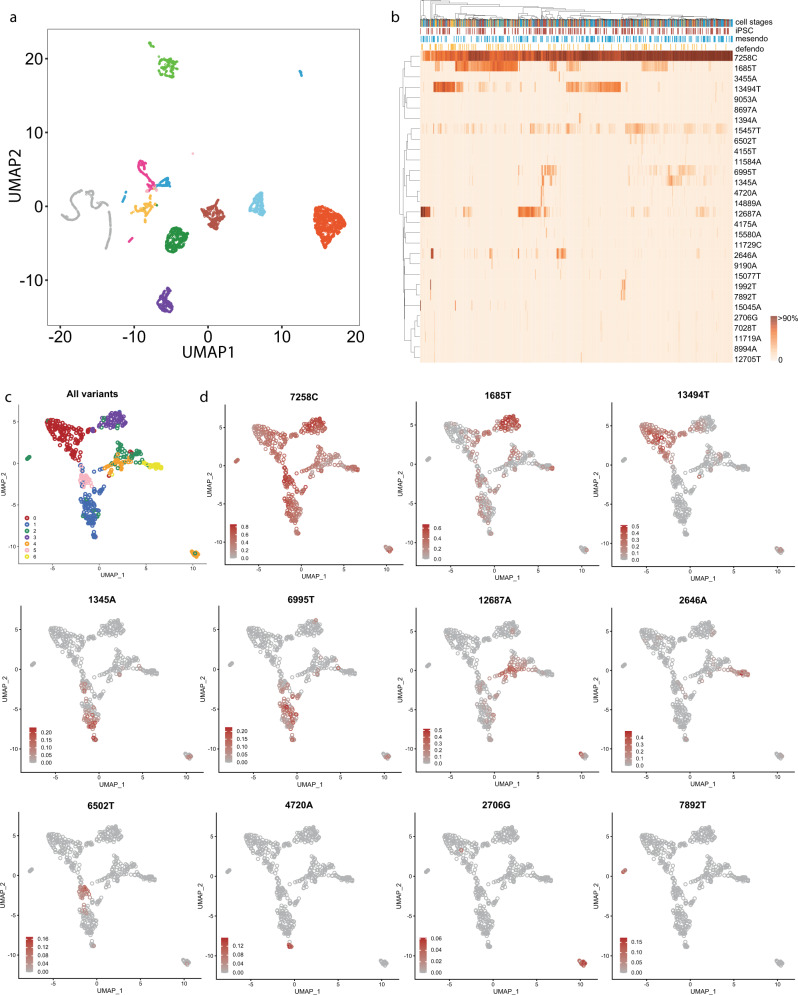
Fig. 6 Lineage tracing using mtDNA variants reveals multiple sub-clones within each cell line. a UMAP plot of mitochondrial mutation profiles, based on 11 cell lines with at least 300 cells. Single cells were separated according to their origins based solely on the mtDNA heteroplasmic variant data. Cells are coloured by each cell line of origin. b An example of hierarchical clustering by the mitochondrial genotyping (rows) for the single cells within a single-cell line. Cells are coloured by their cell stages (columns). Colour bar = heteroplasmy fraction. c, d An example of UMAP plot of mtDNA mutation profiles from a single-cell line, with cells coloured by the defined cluster (c), and heteroplasmy fractions of specific mutations observed in a cell line (d). The mutations are labelled at the top of the plots.
Fig. 6 Lineage tracing using mtDNA variants reveals multiple sub-clones within each cell line. a UMAP plot of mitochondrial mutation profiles, based on 11 cell lines with at least 300 cells. Single cells were separated according to their origins based solely on the mtDNA heteroplasmic variant data. Cells are coloured by each cell line of origin. b An example of hierarchical clustering by the mitochondrial genotyping (rows) for the single cells within a single-cell line. Cells are coloured by their cell stages (columns). Colour bar = heteroplasmy fraction. c, d An example of UMAP plot of mtDNA mutation profiles from a single-cell line, with cells coloured by the defined cluster (c), and heteroplasmy fractions of specific mutations observed in a cell line (d). The mutations are labelled at the top of the plots.CC BY · PubMed Central

Verification

Claims the paper makes

The claims and statistics of this paper haven’t been checked yet.

Run the check — free, no account needed. It reads the open-access text and checks the sources it cites.

A few free checks a day · papers already verified open instantly · results are public

Claims other papers make about this one

Each is checked against this paper’s own text: does it say what the citing paper says it does?

Self-check

Percentages, sums and reported differences re-computed from the paper’s own numbers.

The self-check needs the paper’s full text.

Citations

Cites

Research works printed but not linked: 48

  1. Carcamo-Orive, I. et al. Analysis of transcriptional variability in a large human iPSC library reveals genetic and non-genetic determinants of heterogeneity. Cell Stem Cell 20, 518–532 e519 (2017). · DOI
  2. Jerber, J. et al. Population-scale single-cell RNA-seq profiling across dopaminergic neuron differentiation. Nat. Genet. 53, 304–312 (2021). · DOI
  3. Wallace, D. C. Mitochondrial genetic medicine. Nat. Genet. 50, 1642–1649 (2018). · DOI
  4. Wei, W. et al. Germline selection shapes human mitochondrial DNA diversity. Science 364, 6442 (2019).
  5. Chen, Q. et al. Rewiring of glutamine metabolism is a bioenergetic adaptation of human cells with mitochondrial DNA mutations. Cell Metab. 27, 1007–1025 e1005 (2018). · DOI
  6. Gaude, E. et al. NADH shuttling couples cytosolic reductive carboxylation of glutamine with glycolysis in cells with mitochondrial dysfunction. Mol. Cell 69, 581–593 e587 (2018). · DOI
  7. Lechuga-Vieco, A. V. et al. Cell identity and nucleo-mitochondrial genetic context modulate OXPHOS performance and determine somatic heteroplasmy dynamics. Sci. Adv. 6, eaba5345 (2020). · DOI
  8. Latorre-Pellicer, A. et al. Mitochondrial and nuclear DNA matching shapes metabolism and healthy ageing. Nature 535, 561–565 (2016). · DOI · Paper page
  9. Prigione, A. et al. Human induced pluripotent stem cells harbor homoplasmic and heteroplasmic mitochondrial DNA mutations while maintaining human embryonic stem cell-like metabolic reprogramming. Stem Cells 29, 1338–1348 (2011). · DOI
  10. Perales-Clemente, E. et al. Natural underlying mtDNA heteroplasmy as a potential source of intra-person hiPSC variability. EMBO J. 35, 1979–1990 (2016). · DOI
  11. Kang, E. et al. Age-related accumulation of somatic mitochondrial DNA mutations in adult-derived human iPSCs. Cell Stem Cell 18, 625–636 (2016). · DOI
  12. Andrews, R. M. et al. Reanalysis and revision of the Cambridge reference sequence for human mitochondrial DNA [letter]. Nat. Genet. 23, 147 (1999). · DOI · Paper page
  13. Royrvik, E. C., Burgstaller, J. P. & Johnston, I. G. mtDNA diversity in human populations highlights the merit of haplotype matching in gene therapies. Mol. Hum. Reprod. 22, 809–817 (2016). · DOI
  14. Michikawa, Y., Mazzucchelli, F., Bresolin, N., Scarlato, G. & Attardi, G. Aging-dependent large accumulation of point mutations in the human mtDNA control region for replication. Science 286, 774–779 (1999). · DOI
  15. van den Ameele, J., Li, A. Y. Z., Ma, H. & Chinnery, P. F. Mitochondrial heteroplasmy beyond the oocyte bottleneck. Semin Cell Dev. Biol. 97, 156–166 (2020). · DOI
  16. Floros, V. I. et al. Segregation of mitochondrial DNA heteroplasmy through a developmental genetic bottleneck in human embryos. Nat. Cell Biol. 20, 144–151 (2018). · DOI
  17. Latorre-Pellicer, A. et al. Regulation of mother-to-offspring transmission of mtDNA heteroplasmy. Cell Metab. 30, 1120–1130 e1125 (2019). · DOI
  18. Ju, Y. S. et al. Origins and functional consequences of somatic mitochondrial DNA mutations in human cancer. eLife 3, e02935 (2014).
  19. Yuan, Y. et al. Comprehensive molecular characterization of mitochondrial genomes in human cancers. Nat. Genet. 52, 342–352 (2020). · DOI
  20. Stewart, J. B. et al. Simultaneous DNA and RNA mapping of somatic mitochondrial mutations across diverse human cancers. PLoS Genet. 11, e1005333 (2015). · DOI
  21. Gu, X., Kang, X. & Liu, J. Mutation signatures in germline mitochondrial genome provide insights into human mitochondrial evolution and disease. Hum. Genet. 138, 613–624 (2019). · DOI
  22. Alexandrov, L. B. et al. The repertoire of mutational signatures in human cancer. Nature 578, 94–101 (2020). · DOI · Paper page
  23. Becht, E. et al. Dimensionality reduction for visualizing single-cell data using UMAP. Nat. Biotechnol. 37, 38–44 (2018). · DOI · Paper page
  24. Zambelli, F. et al. Random mutagenesis, clonal events, and embryonic or somatic origin determine the mtDNA variant type and load in human pluripotent stem cells. Stem Cell Rep. 11, 102–114 (2018). · DOI
  25. Cree, L. M. et al. A reduction of mitochondrial DNA molecules during embryogenesis explains the rapid segregation of genotypes. Nat. Genet. 40, 249–254 (2008). · DOI
  26. Cao, L. et al. New evidence confirms that the mitochondrial bottleneck is generated without reduction of mitochondrial DNA content in early primordial germ cells of mice. PLoS Genet. 5, e1000756 (2009). · DOI
  27. Wai, T., Teoli, D. & Shoubridge, E. A. The mitochondrial DNA genetic bottleneck results from replication of a subpopulation of genomes. Nat. Genet. 40, 1484–1488 (2008). · DOI
  28. Burr, S. P., Pezet, M. & Chinnery, P. F. Mitochondrial DNA heteroplasmy and purifying selection in the mammalian female germ line. Dev. Growth Differ. 60, 21–32 (2018). · DOI
  29. Stewart, J. B. & Chinnery, P. F. The dynamics of mitochondrial DNA heteroplasmy: implications for human health and disease. Nat. Rev. Genet. 16, 530–542 (2015). · DOI
  30. Stamp, C. et al. Age-associated mitochondrial complex I deficiency is linked to increased stem cell proliferation rates in the mouse colon. Aging Cell 20, e13321 (2021). · DOI
  31. Diot, A. et al. Modulating mitochondrial quality in disease transmission: towards enabling mitochondrial DNA disease carriers to have healthy children. Biochem Soc. Trans. 44, 1091–1100 (2016). · DOI
  32. Li, H. et al. The sequence alignment/Map format and SAMtools. Bioinformatics 25, 2078–2079 (2009). · DOI · Paper page
  33. Calabrese, C. et al. MToolBox: a highly automated pipeline for heteroplasmy annotation and prioritization analysis of human mitochondrial variants in high-throughput sequencing. Bioinformatics 30, 3115–3117 (2014). · DOI
  34. Koboldt, D. C. et al. VarScan 2: somatic mutation and copy number alteration discovery in cancer by exome sequencing. Genome Res. 22, 568–576 (2012). · DOI
  35. Wei, W., Gomez-Duran, A., Hudson, G. & Chinnery, P. F. Background sequence characteristics influence the occurrence and severity of disease-causing mtDNA mutations. PLoS Genet. 13, e1007126 (2017). · DOI
  36. Weissensteiner, H. et al. HaploGrep 2: mitochondrial haplogroup classification in the era of high-throughput sequencing. Nucleic Acids Res. 44, W58–W63 (2016). · DOI
  37. Lott, M. T. et al. mtDNA variation and analysis using mitomap and mitomaster. Curr. Protoc. Bioinforma. 44, 1 23 21-26 (2013). · DOI
  38. Yarham, J. W. et al. A comparative analysis approach to determining the pathogenicity of mitochondrial tRNA mutations. Hum. Mutat. 32, 1319–1325 (2011). · DOI
  39. Ratnaike TE, Greene D, Wei W, Sanchis-Juan A, Schon KR, van den Ameele J, Raymond L, Horvath R, Turro E, Chinnery PF. MitoPhen database: a Human Phenotype Ontology-based approach to identify mitochondrial DNA diseases. Nucleic Acids Res. (2021):in press. · DOI
  40. Bar-Yaacov, D. et al. RNA-DNA differences in human mitochondria restore ancestral form of 16S ribosomal RNA. Genome Res. 23, 1789–1796 (2013). · DOI
  41. John, C. R. et al. M3C: Monte Carlo reference-based consensus clustering. Sci. Rep. 10, 1816 (2020). · DOI
  42. Anders, S. & Huber, W. Differential expression analysis for sequence count data. Genome Biol. 11, R106 (2010). · DOI · Paper page
  43. Hoffman, G. E. & Schadt, E. E. variancePartition: interpreting drivers of variation in complex gene expression studies. BMC Bioinforma. 17, 483 (2016). · DOI · Paper page
  44. Chen, E. Y. et al. Enrichr: interactive and collaborative HTML5 gene list enrichment analysis tool. BMC Bioinforma. 14, 128 (2013). · DOI · Paper page
  45. Xie, Z. et al. Gene set knowledge discovery with enrichr. Curr. Protoc. 1, e90 (2021). · DOI · Paper page
  46. Kuleshov, M. V. et al. Enrichr: a comprehensive gene set enrichment analysis web server 2016 update. Nucleic Acids Res. 44, W90–W97 (2016). · DOI · Paper page
  47. Krzywinski, M. et al. Circos: an information aesthetic for comparative genomics. Genome Res. 19, 1639–1645 (2009). · DOI
  48. Clima, R. et al. HmtDB 2016: data update, a better performing query system and human mitochondrial DNA haplogroup predictor. Nucleic Acids Res. 45, D698–D706 (2017). · DOI

Cited by

Sorted by citations

See all 47

Metadata

Authors
Wei, W., Gaffney, D. J., & Chinnery, P. F.
Venue
Nature Communications
Published
2021-09-02
Volume
12
Issue
1
ISSN
2041-1723
Cited by
47
References
5
Language
en
Funders
  • Wellcome Trust (212219/Z/18/Z)
  • RCUK | Medical Research Council (MC_UU_00015/9)
  • Leverhulme Trust (RPG-2018-408)

About these checks

Registry, retraction, Cites and statistics results are computed, not judged, with one exception: a printed reference that no index lists is read once by a model before it counts as a citation error. Claims are extracted by a model and kept only when their quote appears verbatim in the text; each cited source is then checked, with a model’s help, for whether it says what the claim relies on. Those verdicts can be wrong — read the claim’s quote and the cited source before relying on one.

Statistics and arithmetic are recomputed, not judged.

Confidence bands are shown only for fields calibrated on our annotated test set. None is calibrated yet, so no band is shown.

What counts as a claim ›How we measure confidence ›How we check this ›

Are you an author, or do you see a problem with this page? Request a review