

The DOI matches its Crossref record; 6 of the 6 references it cites were found in a registry or an index.
Robust replication initiation from coupled homeostatic mechanisms
Open accessPublished version of a preprint
Abstract
The bacterium Escherichia coli initiates replication once per cell cycle at a precise volume per origin and adds an on average constant volume between successive initiation events, independent of the initiation size. Yet, a molecular model that can explain these observations has been lacking. Experiments indicate that E. coli controls replication initiation via titration and activation of the initiator protein DnaA. Here, we study by mathematical modelling how these two mechanisms interact to generate robust replication-initiation cycles. We first show that a mechanism solely based on titration generates stable replication cycles at low growth rates, but inevitably causes premature reinitiation events at higher growth rates. In this regime, the DnaA activation switch becomes essential for stable replication initiation. Conversely, while the activation switch alone yields robust rhythms at high growth rates, titration can strongly enhance the stability of the switch at low growth rates. Our analysis thus predicts that both mechanisms together drive robust replication cycles at all growth rates. In addition, it reveals how an origin-density sensor yields adder correlations.
Overview
The claims and statistics of this paper haven’t been checked yet.
Run the check — free, no account needed. It reads the open-access text and checks the sources it cites.
Integrity signals
Registry
Cites
Statistics
Figures
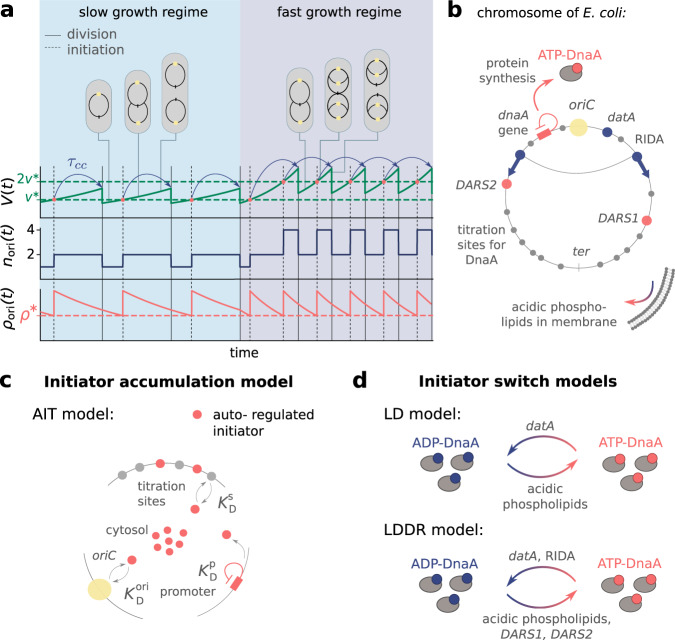
 as a function of time (in units of the doubling time of the cell τd) for τd = 2 h (a), τd = 35 min (b, c) and τd = 25 min (d), respectively. a When the number of initiator proteins per origin np(t) exceeds the number of titration sites per origin ns (yellow dashed line), the free concentration [p](t) rapidly rises to reach the threshold concentration KD^ori (blue dashed line), initiating a new round of replication. Due to the homogeneous distribution of titration sites on the chromosome of E. coli and the constant DNA replication rate, the number of titration sites then increases linearly in time. At low growth rates, new titration sites are synthesized faster than new initiator proteins and the free concentration [p](t) rapidly drops after initiation. After a fixed cycling time τcc (blue arrows) the cell divides. The initiation volume per origin v* (green dashed line) at low growth rates is constant in time. b However, in the regime of overlapping replication forks where the doubling time is smaller than the time to replicate the entire chromosome, τd < TC, new proteins are synthesized faster than new titration sites are formed. After a short period τb = 10 min (shaded red area) during which initiation at oriC is blocked via the protein SeqA, replication is reinitiated prematurely, dramatically raising the variation in the initiation volume (see Fig. 5c, green line). c, d Adding SeqA, which transiently blocks DnaA synthesis for a time τb = 10 min after replication initiation (shaded red area), prevents reinitiation events at high (d) but not at intermediate growth rates (c). (See Supplementary Table 1 for all parameters).](/paper-figures/2dfd588ee0354cc8a2c100f3b759610f/robust-replication-initiation-from-coupled-homeostatic-mechanisms-figure-2.jpg)
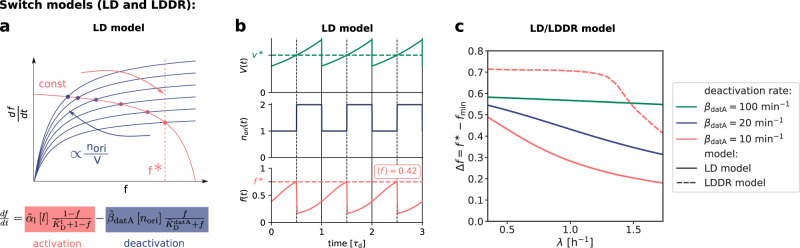
 regress to the mean on a timescale τd=ln(2)/λ set by the growth rate λ, such that an initial perturbation l0 − 〈l〉 is halved every subsequent cell cycle. The thin gray lines are time traces from N = 100 simulations starting at an initial lipid concentration perturbation δl0, while the solid line is the analytical prediction for the mean obtained by solving Eq. (4) subject to the same initial condition. The colored dots indicate the average lipid concentration perturbation δl* at the moment of initiation in generation n and the horizontal dashed line shows the average lipid concentration at steady state. c The mapping between the initiation volume v* and the normalized lipid concentration l/〈l〉 (blue line), obtained by solving Eq. (3) in steady state in the limit of high (de)activation rates (Supplementary Note 3B1 and Supplementary Fig. 11). As in a, the colored dots show the average initiation volume v* as a function of l/〈l〉 at the successive initiation events. d The average initiation volume (colored dots) relaxes on the same timescale τd as the lipid concentration, such that a perturbation v0^(*)−⟨v^(*)⟩ is halved every cell cycle, giving rise to adder correlations. In a the dark blue line shows the mean of the binned data and the error bars represent the standard error of the mean (SEM) per bin. The number of data points N and the Pearson correlation coefficient R are indicated. The model includes an eclipse period of about 10 min following replication initiation to prevent immediate reinitiation. (See Supplementary Table 2 for all parameters).](/paper-figures/16957beae1184011aeca3549b07f8dfc/robust-replication-initiation-from-coupled-homeostatic-mechanisms-figure-4.jpg)
Verification
Claims the paper makes
The claims and statistics of this paper haven’t been checked yet.
Run the check — free, no account needed. It reads the open-access text and checks the sources it cites.
Self-check
Percentages, sums and reported differences re-computed from the paper’s own numbers.
The self-check needs the paper’s full text.
Citations
Cites
Suñé, P., Suñé, J. M., & Montoro, J. B. (2013) · PLoS ONE · doi:10.1371/journal.pone.0054583 · Cited by 1,687
Interdependence of Cell Growth and Gene Expression: Origins and Consequences
Scott, M., Gunderson, C. W., Mateescu, E. M., Zhang, Z., & Hwa, T. (2010) · Science · doi:10.1126/science.1192588 · Cited by 1,470
Intrinsic noise in gene regulatory networks
Thattai, M., & van Oudenaarden, A. (2001) · Proceedings of the National Academy of Sciences · doi:10.1073/pnas.151588598 · Cited by 1,428
Growth Rate-Dependent Global Effects on Gene Expression in Bacteria
Klumpp, S., Zhang, Z., & Hwa, T. (2009) · Cell · doi:10.1016/j.cell.2009.12.001 · Cited by 703
Milo, R. (2013) · BioEssays · doi:10.1002/bies.201300066 · Cited by 614
The Synchronization of Replication and Division Cycles in Individual E. coli Cells
Wallden, M., Fange, D., Lundius, E. G., Baltekin, Ö., & Elf, J. (2016) · Cell · doi:10.1016/j.cell.2016.06.052 · Cited by 331
Research works printed but not linked: 108
- Helmstetter, C. E. & Cooper, S. DNA synthesis during the division cycle of rapidly growing Escherichia coli Br. J. Mol. Biol. 31, 507–518 (1968). · DOI
- Si, F. et al. Invariance of initiation mass and predictability of cell size in Escherichia coli. Curr. Biol. 27, 1278–1287 (2017). · DOI
- Cooper, S. & Helmstetter, C. E. Chromosome replication and the division cycle of Escherichia coli Br. J. Mol. Biol. 31, 519–540 (1968). · DOI
- Donachie, W. D. Relationship between cell size and time of initiation of DNA replication. Nature 219, 1077–1079 (1968). · DOI
- Zheng, H. et al. General quantitative relations linking cell growth and the cell cycle in Escherichia coli. Nat. Microbiol. 5, 995–1001 (2020). · DOI
- Si, F. et al. Mechanistic origin of cell-size control and homeostasis in bacteria. Curr. Biol. 29, 1760–1770.e7 (2019). · DOI
- Dewachter, L., Verstraeten, N., Fauvart, M. & Michiels, J. An integrative view of cell cycle control in Escherichia coli. FEMS Microbiol. Rev. 42, 116–136 (2018). · DOI
- Skarstad, K. & Katayama, T. Regulating DNA replication in bacteria. Cold Spring Harbor Perspect. Biol. 5, a012922 (2013). · DOI
- Willis, L. & Huang, K. C. Sizing up the bacterial cell cycle. Nat. Rev. Microbiol. 15, 606–620 (2017). · DOI
- Katayama, T., Kasho, K. & Kawakami, H. The DnaA cycle in Escherichia coli: Activation, function and inactivation of the initiator protein. Front. Microbiol. 8, 1–15 (2017). · DOI
- Riber, L., Frimodt-Møller, J., Charbon, G. & Løbner-Olesen, A. Multiple DNA binding proteins contribute to timing of chromosome replication in E. coli. Front. Mol. Biosci. 3, 1–9 (2016). · DOI
- Campos, M. et al. A constant size extension drives bacterial cell size homeostasis. Cell 159, 1433–1446 (2014). · DOI
- Taheri-Araghi, S. et al. Cell-size control and homeostasis in bacteria. Curr. Biol. 25, 385–391 (2015). · DOI
- Amir, A. Cell size regulation in bacteria. Phys. Rev. Lett. 112, 1–5 (2014). · DOI
- Ho, P.-Y. & Amir, A. Simultaneous regulation of cell size and chromosome replication in bacteria. Front. Microbiol. 6, 662 (2015). · DOI
- Witz, G., van Nimwegen, E. & Julou, T. Initiation of chromosome replication controls both division and replication cycles in E. coli through a double-adder mechanism. eLife 8, e48063 (2019). · DOI
- Le Treut, G., Si, F., Li, D. & Jun, S. Quantitative examination of five stochastic cell-cycle and cell-size control models for escherichia coli and bacillus subtilis. Front. Microbiol. 12, 3278 (2021). · DOI
- Witz, G., Julou, T. & van Nimwegen, E. Response to comment on ‘Initiation of chromosome replication controls both division and replication cycles in E. coli through a double-adder mechanism’. Preprint at https://doi.org/10.1101/2020.08.04.227694 (2020). · DOI
- Micali, G., Grilli, J., Marchi, J., Osella, M. & Cosentino Lagomarsino, M. Dissecting the control mechanisms for DNA replication and cell division in E. coli. Cell Rep. 25, 761–771.e4 (2018). · DOI
- Micali, G., Grilli, J., Osella, M. & Lagomarsino, M. C. Concurrent processes set E. coli cell division. Sci. Adv. 4, 1–8 (2018). · DOI
- Adiciptaningrum, A., Osella, M., Moolman, M. C., Cosentino Lagomarsino, M. & Tans, S. J. Stochasticity and homeostasis in the E. coli replication and division cycle. Sci. Rep. 5, 18261 (2015). · DOI
- Barber, F., Ho, P. Y., Murray, A. W. & Amir, A. Details matter: noise and model structure set the relationship between cell size and cell cycle timing. Front. Cell Dev. Biol. 5, 1–16 (2017). · DOI
- Sompayrac, L. & Maaloe, O. Autorepressor model for control of DNA replication. Nat. N. Biol. 241, 133–135 (1973). · DOI
- Hansen, F. G., Christensen, B. B. & Atlung, T. The initiator titration model: computer simulation of chromosome and minichromosome control. Res. Microbiol. 142, 161–167 (1991). · DOI
- Basan, M. et al. Inflating bacterial cells by increased protein synthesis. Mol. Syst. Biol. 11, 836 (2015). · DOI
- Hansen, F. G. & Atlung, T. The DnaA tale. Front. Microbiol. 9, 1–19 (2018). · DOI
- Schaper, S. & Messer, W. Interaction of the initiator protein DnaA of Escherichia coli with its DNA target. J. Biol. Chem. 270, 17622–17626 (1995). · DOI
- Wallden, M., Fange, D., Baltekin, Ö. & Elf, J. Fluctuations in growth rates determine the generation time and size distributions of E. coli cells. Preprint at https://arxiv.org/abs/1504.03145 (2015). · arXiv
- Kasho, K. & Katayama, T. DnaA binding locus datA promotes DnaA-ATP hydrolysis to enable cell cycle-coordinated replication initiation. Proc. Natl Acad. Sci. 110, 936–941 (2013). · DOI
- Kasho, K., Fujimitsu, K., Matoba, T., Oshima, T. & Katayama, T. Timely binding of IHF and Fis to DARS2 regulates ATP-DnaA production and replication initiation. Nucleic Acids Res. 42, 13134–13149 (2014). · DOI
- Kurokawa, K., Nishida, S., Emoto, A., Sekimizu, K. & Katayama, T. Replication cycle-coordinated change of the adenine nucleotide-bound forms of DnaA protein in Escherichia coli. EMBO J. 18, 6642–6652 (1999). · DOI
- Katayama, T., Ozaki, S., Keyamura, K. & Fujimitsu, K. Regulation of the replication cycle: Conserved and diverse regulatory systems for DnaA and oriC. Nat. Rev. Microbiol. 8, 163–170 (2010). · DOI
- Nishida, S. et al. A nucleotide switch in the Escherichia coli DnaA protein initiates chromosomal replication. J. Biol. Chem. 277, 14986–14995 (2002). · DOI
- Speck, C. & Messer, W. Mechanism of origin unwinding: sequential binding of DnaA to double- and single-stranded DNA. EMBO J. 20, 1469–1476 (2001). · DOI
- Keyamura, K., Abe, Y., Higashi, M., Ueda, T. & Katayama, T. DiaA dynamics are coupled with changes in initial origin complexes leading to helicase loading. J. Biol. Chem. 284, 25038–25050 (2009). · DOI
- Hansen, F. G. et al. Initiator (DnaA) protein concentration as a function of growth rate in Escherichia coli and Salmonella typhimurium. J. Bacteriol. 173, 5194–5199 (1991). · DOI
- Fujimitsu, K., Senriuchi, T. & Katayama, T. Specific genomic sequences of E. coli promote replicational initiation by directly reactivating ADP-DnaA. Genes Dev. 23, 1221–1233 (2009). · DOI
- Katayama, T., Fujimitsu, K. & Ogawa, T. Multiple pathways regulating DnaA function in Escherichia coli: Distinct roles for DnaA titration by the datA locus and the regulatory inactivation of DnaA. Biochimie 83, 13–17 (2001). · DOI
- Grant, M. et al. DnaA and the timing of chromosome replication in Escherichia coli as a function of growth rate. BMC Syst. Biol. 5, 201 (2011). · DOI
- Leonard, A. C. & Grimwade, J. E. Regulation of DnaA assembly and activity: taking directions from the genome. Ann. Rev. Microbiol. 65, 19–35 (2011). · DOI
- Donachie, W. D. & Blakely, G. W. Coupling the initiation of chromosome replication to cell size in Escherichia coli. Curr Opin Microbiol. 6, 146–150 (2003). · DOI
- Sekimizu, K. & Kornberg, A. Cardiolipin activation of dnaA protein, the initiation protein of replication in Escherichia coli. J. Biol. Chem. 263, 7131–7135 (1988). · DOI
- Kato, J. I. & Katayama, T. Hda, a novel DnaA-related protein, regulates the replication cycle in Escherichia coli. EMBO J. 20, 4253–4262 (2001). · DOI
- Nakamura, K. & Katayama, T. Novel essential residues of Hda for interaction with DnaA in the regulatory inactivation of DnaA: Unique roles for Hda AAA+ Box VI and VII motifs. Mol. Microbiol. 76, 302–317 (2010). · DOI
- Ogawa, T., Yamada, Y., Kuroda, T., Kishi, T. & Moriya, S. The datA locus predominantly contributes to the initiator titration mechanism in the control of replication initiation in Escherichia coli. Mol. Microbiol. 44, 1367–1375 (2002). · DOI
- Camara, J. E. et al. Hda inactivation of DnaA is the predominant mechanism preventing hyperinitiation of Escherichia coli DNA replication. EMBO Rep. 6, 736–741 (2005). · DOI
- Riber, L. et al. Hda-mediated inactivation of the DnaA protein and dnaA gene autoregulation act in concert to ensure homeostatic maintenance of the Escherichia coli chromosome. Genes Dev. 20, 2121–2134 (2006). · DOI
- Xia, W. & Dowhan, W. In vivo evidence for the involvement of anionic phospholipids in initiation of DNA replication in Escherichia coli. Proc. Natl Acad. Sci. USA 92, 783–787 (1995). · DOI
- Saxena, R., Fingland, N., Patil, D., Sharma, A. K. & Crooke, E. Crosstalk between DnaA protein, the initiator of Escherichia coli chromosomal replication, and acidic phospholipids present in bacterial membranes. Int. J. Mol. Sci. 14, 8517–8537 (2013). · DOI
- Lin, J. & Amir, A. Homeostasis of protein and mRNA concentrations in growing cells. Nat. Commun. 9, 4496 (2018). · DOI
- Roth, A. & Messer, W. High-affinity binding sites for the initiator protein DnaA on the chromosome of Escherichia coli. Mol. Microbiol. 28, 395–401 (1998). · DOI
- Campbell, J. L. & Kleckner, N. E. coli oriC and the dnaA gene promoter are sequestered from dam methyltransferase following the passage of the chromosomal replication fork. Cell 62, 967–979 (1990). · DOI
- Lu, M., Campbell, J. L., Boye, E. & Kleckner, N. SeqA: a negative modulator of replication initiation in E. coli. Cell 77, 413–426 (1994). · DOI
- Waldminghaus, T. & Skarstad, K. The Escherichia coli SeqA protein. Plasmid 61, 141–150 (2009). · DOI
- Kawakamii, H., Keyamura, K. & Katayama, T. Formation of an ATP-DnaA-specific initiation complex requires DnaA arginine 285, a conserved motif in the AAA+ protein family. J. Biol. Chem. 280, 27420–27430 (2005). · DOI
- Mallik, P., Paul, B. J., Rutherford, S. T., Gourse, R. L. & Osuna, R. DksA is required for growth phase-dependent regulation, growth rate-dependent control, and stringent control of fis expression in Escherichia coli. J. Bacteriol. 188, 5775–5782 (2006). · DOI
- Flåtten, I. & Skarstad, K. The Fis protein has a stimulating role in initiation of replication in Escherichia coli in vivo. PLoS One 8, 1–9 (2013). · DOI
- Crooke, E., Castuma, C. E. & Kornberg, A. The chromosome origin of Escherichia coli stabilizes DnaA protein during rejuvenation by phospholipids. J. Biol. Chem. 267, 16779–16782 (1992). · DOI
- Castuma, C. E., Crooke, E. & Kornberg, A. Fluid membranes with acidic domains activate DnaA, the initiator protein of replication in Escherichia coli. J. Biol. Chem. 268, 24665 – 24668 (1993). · DOI
- Aranovich, A., Gdalevsky, G. Y., Cohen-Luria, R., Fishov, I. & Parola, A. H. Membrane-catalyzed nucleotide exchange on DnaA: Effect of surface molecular crowding. J. Biol. Chem. 281, 12526–12534 (2006). · DOI
- Garner, J., Durrer, P., Kitchen, J., Brunner, J. & Crooke, E. Membrane-mediated release of nucleotide from an initiator of chromosomal replication, Escherichia coli DnaA, occurs with insertion of a distinct region of the protein into the lipid bilayer. J. Biol. Chem. 273, 5167–5173 (1998). · DOI
- Yung, B. Y. & Kornberg, A. Membrane attachment activates dnaA protein, the initiation protein of chromosome replication in Escherichia coli. Proc. Natl Acad. Sci. USA 85, 7202–7205 (1988). · DOI
- Fingland, N. et al. Depletion of acidic phospholipids influences chromosomal replication in Escherichia coli. MicrobiologyOpen 1, 450–466 (2012). · DOI
- Zheng, W., Li, Z., Skarstad, K. & Crooke, E. Mutations in DnaA protein suppress the growth arrest of acidic phospholipid-deficient Escherichia coli cells. EMBO J. 20, 1164–1172 (2001). · DOI
- Heacock, P. N. & Dowhan, W. Alteration of the phospholipid composition of Escherichia coli through genetic manipulation. J. Biol. Chem. 264, 14972–14977 (1989). · DOI
- Speck, C., Weigel, C. & Messer, W. ATP- and ADP-DnaA protein, a molecular switch in gene regulation. EMBO J. 18, 6169–6176 (1999). · DOI
- Katayama, T., Kubota, T., Kurokawa, K., Crooke, E. & Sekimizu, K. The initiator function of DnaA protein is negatively regulated by the sliding clamp of the E. coli Chromosomal replicase. Cell 94, 61–71 (1998). · DOI
- Elowitz, M. B., Levine, A. J., Siggia, E. D. & Swain, P. S. Stochastic gene expression in a single cell. Science 297, 1183 – 1186 (2002). · DOI · Paper page
- Govern, C. C. & ten Wolde, P. R. Optimal resource allocation in cellular sensing systems. Proc. Natl Acad. Sci. USA 111, 17486–17491 (2014). · DOI · Paper page
- Knöppel, A., Broström, O., Gras, K., Fange, D. & Elf, J. The coordination of replication initiation with growth rate in Escherichia coli. Preprint at https://doi.org/10.1101/2021.10.11.463968 (2022). · DOI
- D’Ario, M. et al. Cell size controlled in plants using DNA content as an internal scale. Science 372, 1176–1181 (2021). · DOI
- Rhind, N. Cell-size control. Curr. Biol. 31, R1414–R1420 (2021). · DOI
- Zwicker, D., Lubensky, D. K. & Wolde, P. R. T. Robust circadian clocks from coupled protein-modification and transcription-translation cycles. Proc. Natl Acad. Sci. 107, 22540 – 22545 (2010). · DOI
- Teng, S. W., Mukherji, S., Moffitt, J. R., de Buyl, S. & O’Shea, E. K. Robust circadian oscillations in growing cyanobacteria require transcriptional feedback. Science 340, 737–740 (2013). · DOI
- Larrondo, L. F., Olivares-Yanez, C., Baker, C. L., Loros, J. J. & Dunlap, J. C. Decoupling circadian clock protein turnover from circadian period determination. Science 347, 1257277–1257277 (2015). · DOI
- Nishiwaki-Ohkawa, T., Kitayama, Y., Ochiai, E. & Kondo, T. Exchange of ADP with ATP in the CII ATPase domain promotes autophosphorylation of cyanobacterial clock protein KaiC. Proc. Natl Acad. Sci. USA 111, 4455 – 4460 (2014). · DOI
- Paijmans, J., Lubensky, D. K. & ten Wolde, P. R. A thermodynamically consistent model of the post-translational Kai circadian clock. PLoS Comput. Biol. 13, e1005415 (2017). · DOI
- Eun, Y.-J. et al. Archaeal cells share common size control with bacteria despite noisier growth and division. Nat. Microbiol. 3, 148–154 (2018). · DOI
- Soifer, I., Robert, L. & Amir, A. Single-cell analysis of growth in budding yeast and bacteria reveals a common size regulation strategy. Curr. Biol. 26, 356–361 (2016). · DOI
- Erzberger, J. P., Mott, M. L. & Berger, J. M. Structural basis for ATP-dependent DnaA assembly and replication-origin remodeling. Nat. Struct. Mol. Biol. 13, 676–683 (2006). · DOI · Paper page
- Michelsen, O., Teixeira de Mattos, M. J., Jensen, P. R. & Hansen, F. G. Precise determinations of C and D periods by flow cytometry in Escherichia coli K-12 and B/r. Microbiology 149, 1001–1010 (2003). · DOI
- Kitagawa, R., Ozaki, T., Moriya, S. & Ogawa, T. Negative control of replication initiation by a novel chromosomal locus exhibiting exceptional affinity for Escherichia coli DnaA protein. Genes Dev. 12, 3032–3043 (1998). · DOI
- Fujimitsu, K. et al. Modes of overinitiation, dnaA gene expression, and inhibition of cell division in a novel cold-sensitive hda mutant of Escherichia coli. J. Bacteriol. 190, 5368–5381 (2008). · DOI
- Frimodt-Møller, J., Charbon, G., Krogfelt, K. A. & Løbner-Olesen, A. Control regions for chromosome replication are conserved with respect to sequence and location among Escherichia coli strains. Front. Microbiol. 6, 1–15 (2015). · DOI
- Flåtten, I., Fossum-Raunehaug, S., Taipale, R., Martinsen, S. & Skarstad, K. The DnaA protein is not the limiting factor for initiation of replication in Escherichia coli. PLoS Genet. 11, 1–22 (2015). · DOI
- Nozaki, S., Yamada, Y. & Ogawa, T. Initiator titration complex formed at datA with the aid of IHF regulates replication timing in Escherichia coli. Genes Cells 14, 329–341 (2009). · DOI
- Frimodt-Møller, J., Charbon, G., Krogfelt, K. A. & Løbner-Olesen, A. DNA replication control is linked to genomic positioning of control regions in Escherichia coli. PLoS Genet. 12, 1–27 (2016). · DOI
- Inoue, Y. et al. Chromosomal location of the DnaA-reactivating sequence DARS2 is important to regulate timely initiation of DNA replication in Escherichia coli. Genes Cells 21, 1015–1023 (2016). · DOI
- Christensen, B. B., Atlung, T. & Hansen, F. G. DnaA boxes are important elements in setting the initiation mass of Escherichia coli. J. Bacteriol. 181, 2683–2688 (1999). · DOI
- Hill, N. S., Kadoya, R., Chattoraj, D. K. & Levin, P. A. Cell size and the initiation of DNA replication in bacteria. PLoS Genet. 8, 14–16 (2012). · DOI
- Atlung, T. & Hansen, F. G. Three distinct chromosome replication states are induced by increasing concentrations of DnaA protein in Escherichia coli. J. Bacteriol. 175, 6537–6545 (1993). · DOI
- Shiba, Y. et al. Activation of the Rcs signal transduction system is responsible for the thermosensitive growth defect of an Escherichia coli mutant lacking phosphatidylglycerol and cardiolipin. J. Bacteriol. 186, 6526–6535 (2004). · DOI
- Shiba, Y. et al. Exploring the relationship between lipoprotein mislocalization and activation of the Rcs signal transduction system in Escherichia coli. Microbiology 158, 1238–1248 (2012). · DOI
- Camsund, D. et al. Time-resolved imaging-based CRISPRi screening. Nat. Methods 17, 86–92 (2020). · DOI
- Saggioro, C., Olliver, A. & Sclavi, B. Temperature-dependence of the DnaA-DNA interaction and its effect on the autoregulation of dnaA expression. Biochemical J. 449, 333–341 (2012). · DOI
- Paulsson, J. Models of stochastic gene expression. Phys. Life Rev. 2, 157–175 (2005). · DOI
- Friedman, N., Cai, L. & Xie, X. S. Linking stochastic dynamics to population distribution: an analytical framework of gene expression. Phys. Rev. Lett. 97, 1–4 (2006). · DOI · Paper page
- Shahrezaei, V. & Swain, P. S. Analytical distributions for stochastic gene expression. Proc. Natl Acad. Sci. USA 105, 17256–17261 (2008). · DOI · Paper page
- Panlilio, M. et al. Threshold accumulation of a constitutive protein explains E. coli cell-division behavior in nutrient upshifts. Proc. Natl Acad. Sci. USA 118, e2016391118 (2021). · DOI
- Brenner, N. et al. Single-cell protein dynamics reproduce universal fluctuations in cell populations. Eur. Phys. J. E 38, 102 (2015). · DOI
- Kempe, H., Schwabe, A., Crémazy, F., Verschure, P. J. & Bruggeman, F. J. The volumes and transcript counts of single cells reveal concentration homeostasis and capture biological noise. Mol. Biol. Cell 26, 797–804 (2015). · DOI
- Padovan-Merhar, O. et al. Single mammalian cells compensate for differences in cellular volume and DNA copy number through independent global transcriptional mechanisms. Mol. Cell 58, 339–352 (2015). · DOI
- Ietswaart, R., Rosa, S., Wu, Z., Dean, C. & Howard, M. Cell-size-dependent transcription of FLC and its antisense long non-coding RNA COOLAIR explain cell-to-cell expression variation. Cell Syst. 4, 622–635.e9 (2017).
- Zheng, X.-y. & O’Shea, E. K. Cyanobacteria maintain constant protein concentration despite genome copy-number variation. Cell Rep. 19, 497 – 504 (2017). · DOI
- Elf, J., Li, G.-W. & Xie, X. S. Probing transcription factor dynamics at the single-molecule level in a living cell. Science 316, 1191–1194 (2007). · DOI
- Schenk, K. et al. Rapid turnover of DnaA at replication origin regions contributes to initiation control of DNA replication. PLOS Genet. 13, 1–32 (2017). · DOI
- Paijmans, J. & Ten Wolde, P. R. Lower bound on the precision of transcriptional regulation and why facilitated diffusion can reduce noise in gene expression. Phys. Rev. E Stat. Nonlinear Soft Matter Phys. 90, 1–14 (2014). · DOI
- Moolman, M. C. et al. Slow unloading leads to DNA-bound β2-sliding clamp accumulation in live Escherichia coli cells. Nat. Commun. 5, 5820 (2014). · DOI
Metadata
- Authors
- Berger, M., & Wolde, P. R. T.
- Affiliations
- Institute for Atomic and Molecular Physics (NL)
- Venue
- Nature Communications
- Published
- 2022-11-07
- Volume
- 13
- Issue
- 1
- Pages
- 6556-6556
- ISSN
- 2041-1723 (ISSN-L)
- PMC
- PMC9640692
- OpenAlex
- W4287123557
- Cited by
- 41
- References
- 6
- Citations by year
- 2026: 8 · 2025: 7 · 2024: 6 · 2023: 19 · 2022: 1
- FWCI
- 2.69
- Type
- journal article
- Language
- en
- Open access
- gold
- doi.org
- Locations
- Nature Communications (publishedVersion, cc-by)
- bioRxiv (Cold Spring Harbor Laboratory) (acceptedVersion, cc-by)
- PubMed Central (publishedVersion, cc-by)
- PubMed (publishedVersion)
- arXiv (Cornell University) (submittedVersion)
- AMOLF Institutional Repository (AMOLF) (submittedVersion, cc-by)
- RePEc: Research Papers in Economics (submittedVersion)
- DOAJ (DOAJ: Directory of Open Access Journals) (submittedVersion, cc-by-sa)
- arXiv (Cornell University) (cc-by)
- Funders
- Nederlandse Organisatie voor Wetenschappelijk Onderzoek (024.003.019)
- Topics
- Life Sciences › Biochemistry, Genetics and Molecular Biology › Molecular Biology › Gene Regulatory Network Analysis
- Life Sciences › Biochemistry, Genetics and Molecular Biology › Genetics › Bacterial Genetics and Biotechnology
- Physical Sciences › Mathematics › Modeling and Simulation › Mathematical Biology Tumor Growth
- Keywords
- DNA replication initiation, Escherichia coli, DnaA, cell cycle, growth rate dependence, robustness, mathematical modeling, homeostatic mechanisms, reinitiation
- MeSH terms
- Bacterial Proteins, Chromosomes, Bacterial, DNA Replication, DNA-Binding Proteins, Escherichia coli, Replication Origin, Escherichia coli Proteins
About these checks
Registry, retraction, Cites and statistics results are computed, not judged, with one exception: a printed reference that no index lists is read once by a model before it counts as a citation error. Claims are extracted by a model and kept only when their quote appears verbatim in the text; each cited source is then checked, with a model’s help, for whether it says what the claim relies on. Those verdicts can be wrong — read the claim’s quote and the cited source before relying on one.
Statistics and arithmetic are recomputed, not judged.
Confidence bands are shown only for fields calibrated on our annotated test set. None is calibrated yet, so no band is shown.
What counts as a claim ›How we measure confidence ›How we check this ›
Are you an author, or do you see a problem with this page? Request a review
How to cite
Cite CoChat for the checks on this page, and the paper for its own findings.
- This page
- CoChat. (2026). Citation check: Robust replication initiation from coupled homeostatic mechanisms. https://app.cochat.ai/papers/10.1038/s41467-022-33886-6
- The paper
- Berger, M., & Wolde, P. R. T. (2022). Robust replication initiation from coupled homeostatic mechanisms. Nature Communications. https://doi.org/10.1038/s41467-022-33886-6
