

The DOI matches its Crossref record; 1 of the 1 references it cites were found in a registry or an index.
Continuous Spatiotemporal Therapy of A Full-API Nanodrug via Multi-Step Tandem Endogenous Biosynthesis
Abstract
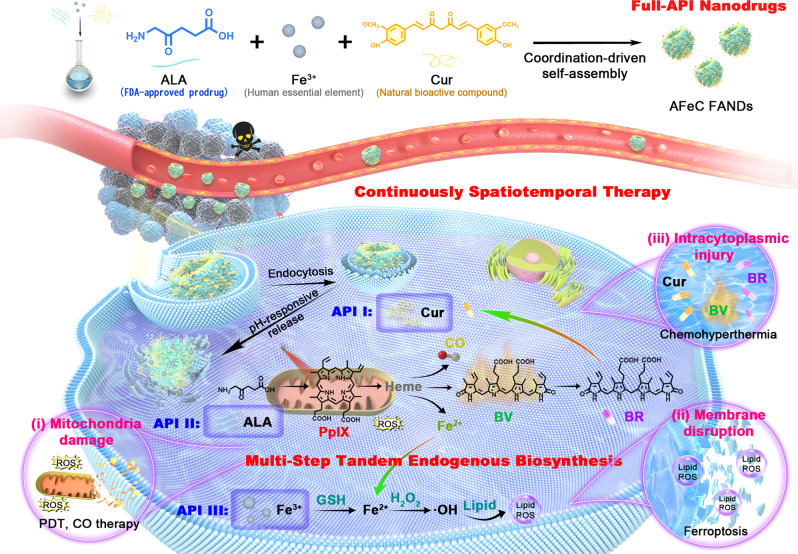
Nanomedicine holds great promise to enhance cancer therapy. However, low active pharmaceutical ingredient (API) loading content, unpredictable drug release, and potential toxicity from excipients limit their translational capability. We herein report a full-API nanodrug composed of FDA-approved 5-aminolevulinic acid (ALA), human essential element Fe 3+ , and natural bioactive compound curcumin with an ideal API content and pH-responsive release profile for continuous spatiotemporal cancer therapy achieved by multi-step tandem endogenous biosynthesis. First, ALA enzymatically converts into photosensitizer protoporphyrin IX (PpIX). Afterward, multiple downstream products including carbon monoxide (CO), Fe 2+ , biliverdin (BV), and bilirubin (BR) are individually biosynthesized through the PpIX-heme-CO/Fe 2+ /BV-BR metabolic pathway, further cooperating with released Fe 3+ and curcumin, ultimately eliciting mitochondria damage, membrane disruption, and intracytoplasmic injury. This work not only provides a paradigm for exploiting diversified metabolites for tumor suppression, but also presents a safe and efficient full-API nanodrug, facilitating the practical translation of nanodrugs.
Overview
The claims and statistics of this paper haven’t been checked yet.
Run the check — free, no account needed. It reads the open-access text and checks the sources it cites.
Integrity signals
Registry
Cites
Statistics
Figures
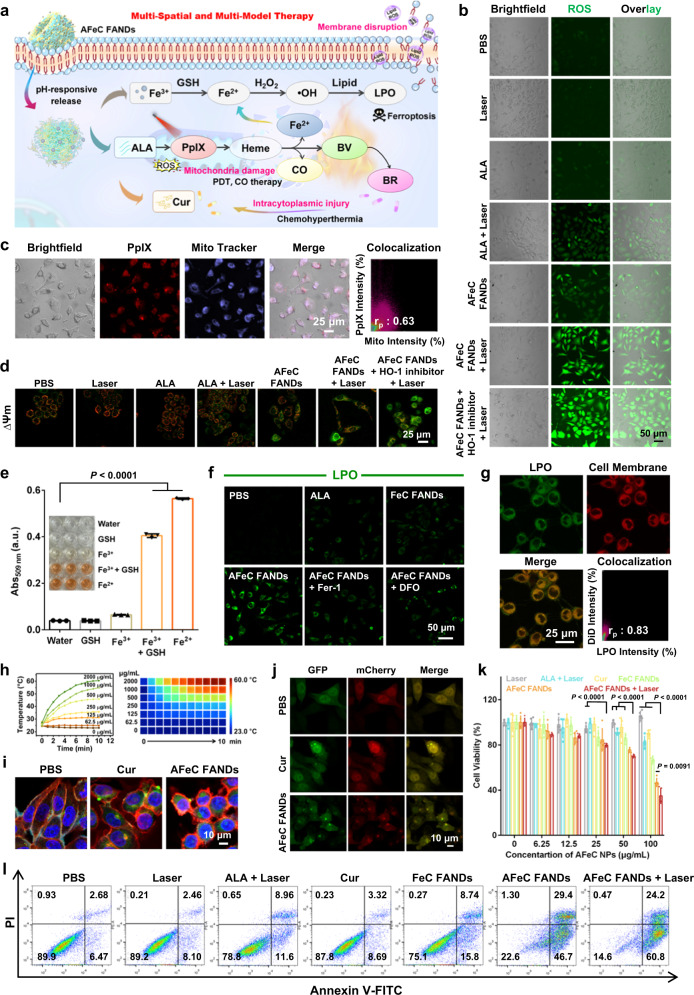
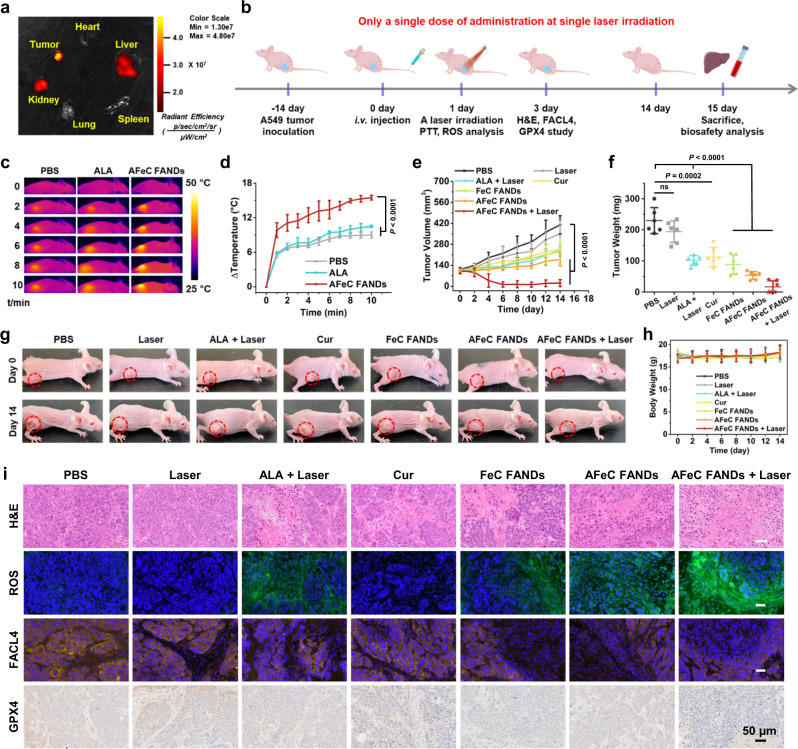
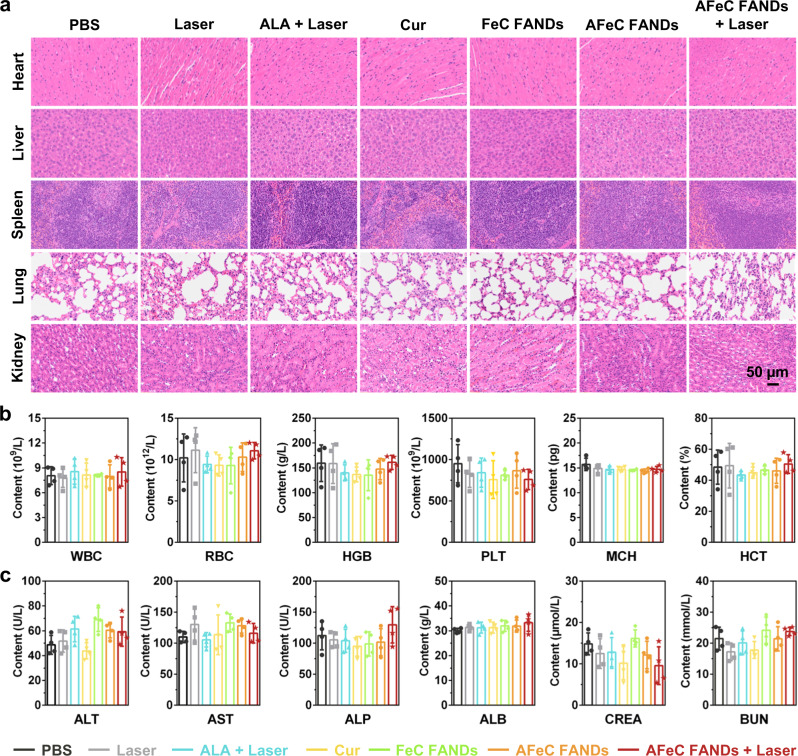
Verification
Claims the paper makes
The claims and statistics of this paper haven’t been checked yet.
Run the check — free, no account needed. It reads the open-access text and checks the sources it cites.
Claims other papers make about this one
Each is checked against this paper’s own text: does it say what the citing paper says it does?
In the citing paper
“The guiding logic mirrors “long circulation, local activation”: carriers remain stable in blood, then switch at the tumor to deepen diffusion and synchronize payload action [94].”
From Overcoming tumor microenvironment barriers: transformable and bioinspired nanomedicine strategies for deep tumor penetration (2026) · cites this paper as [94]
Self-check
Percentages, sums and reported differences re-computed from the paper’s own numbers.
The self-check needs the paper’s full text.
Citations
Cites
Wu, G., Zhang, J., Zhao, Q., Zhuang, W., Ding, J., Zhang, C., Gao, H., Pang, D., Pu, K., & Xie, H. (2020) · Angewandte Chemie International Edition · doi:10.1002/anie.201913700 · Cited by 269
Self-citation
Research works printed but not linked: 65
- Shi, J., Kantoff, P. W., Wooster, R. & Farokhzad, O. C. Cancer nanomedicine: progress, challenges and opportunities. Nat. Rev. Cancer 17, 20–37 (2017). · DOI · Paper page
- van der Meel, R. et al. Smart cancer nanomedicine. Nat. Nanotechnol. 14, 1007–1017 (2019). · DOI
- Huang, X. et al. Nanotechnology-based strategies against SARS-CoV-2 variants. Nat. Nanotechnol. 17, 1027–1037 (2022). · DOI
- Wang, Z., Cui, K., Costabel, U. & Zhang, X. Nanotechnology‐facilitated vaccine development during the coronavirus disease 2019 (COVID‐19) pandemic. Exploration 2, 20210082 (2022). · DOI
- Wang, S. et al. Nanoparticle-based medicines in clinical cancer therapy. Nano Today 45, 101512 (2022). · DOI
- Liu, B., Hu, F., Zhang, J., Wang, C. & Li, L. A Biomimetic coordination nanoplatform for controlled encapsulation and delivery of drug–gene combinations. Angew. Chem. Int. Ed. 58, 8804–8808 (2019). · DOI
- Zhao, Z. et al. Elaborately engineering a self‐Indicating dual‐drug nanoassembly for site‐specific photothermal‐potentiated thrombus penetration and thrombolysis. Adv. Sci. 9, 2104264 (2022). · DOI
- Xing, L. et al. A carrier-free anti-inflammatory platinum (II) self-delivered nanoprodrug for enhanced breast cancer therapy. J. Control. Release 331, 460–471 (2021). · DOI
- Zhang, J. et al. Self-monitoring and self-delivery of photosensitizer-doped nanoparticles for highly effective combination cancer therapy in vitro and in vivo. ACS Nano 9, 9741–9756 (2015). · DOI
- Huang, L. et al. Advances and perspectives in carrier-free nanodrugs for cancer chemo-monotherapy and combination therapy. Biomaterials 268, 120557 (2021). · DOI
- Zhu, L. et al. Carrier‐free delivery of precise drug–chemogene conjugates for synergistic treatment of drug‐resistant cancer. Angew. Chem. Int. Ed. 59, 17944–17950 (2020). · DOI
- Liu, L.-H. & Zhang, X.-Z. Carrier-free nanomedicines for cancer treatment. Prog. Mater. Sci. 125, 100919 (2022). · DOI
- Wu, Z. et al. Carrier-free trehalose-based nanomotors targeting macrophages in inflammatory plaque for treatment of atherosclerosis. ACS Nano 16, 3808–3820 (2022). · DOI
- Xiang, X. et al. Indocyanine green potentiated paclitaxel nanoprodrugs for imaging and chemotherapy. Exploration 2, 20220008 (2022). · DOI
- Wang, M. et al. Remdesivir and chloroquine effectively inhibit the recently emerged novel coronavirus (2019-nCoV) in vitro. Cell Res. 30, 269–271 (2020). · DOI
- Ng, Y. L., Salim, C. K. & Chu, J. J. H. Drug repurposing for COVID-19: Approaches, challenges and promising candidates. Pharmacol. Ther. 228, 107930 (2021). · DOI
- Beijersbergen, R. L. Old drugs with new tricks. Nat. Cancer 1, 153–155 (2020). · DOI
- Pushpakom, S. et al. Drug repurposing: progress, challenges and recommendations. Nat. Rev. Drug Discov. 18, 41–58 (2019). · DOI · Paper page
- Yang, B. & Shi, J. Developing new cancer nanomedicines by repurposing old drugs. Angew. Chem. Int. Ed. 59, 21829–21838 (2020). · DOI
- Li, S. et al. Supramolecular nanofibrils formed by coassembly of clinically approved drugs for tumor photothermal immunotherapy. Adv. Mater. 33, 2100595 (2021). · DOI
- Zuo, L. et al. Smart tumor‐cell‐derived microparticles provide on‐demand photosensitizer synthesis and hypoxia relief for photodynamic therapy. Angew. Chem. Int. Ed. 60, 25365–25371 (2021). · DOI
- Shi, J. et al. An intracellular self‐assembly‐driven uninterrupted ROS generator augments 5‐aminolevulinic‐acid‐based tumor therapy. Adv. Mater. 34, 2201049 (2022). · DOI
- Wang, X. et al. Hydrogel-based patient-friendly photodynamic therapy of oral potentially malignant disorders. Biomaterials 281, 121377 (2022). · DOI
- Cao, D. et al. An intelligent transdermal formulation of ALA‐loaded copolymer thermogel with spontaneous asymmetry by using temperature‐induced sol–gel transition and gel–sol (suspension) transition on different sides. Adv. Funct. Mater. 31, 2100349 (2021). · DOI
- Teh, D. B. L. et al. A flexi‐PEGDA upconversion implant for wireless brain photodynamic therapy. Adv. Mater. 32, 2001459 (2020). · DOI
- Zheng, D.-W. et al. A simply modified lymphocyte for systematic cancer therapy. Adv. Mater. 30, 1801622 (2018). · DOI
- Jozkowicz, A., Was, H. & Dulak, J. Heme oxygenase-1 in tumors: Is it a false friend? Antioxid. Redox Signal. 9, 2099–2118 (2007). · DOI
- Zheng, Y. et al. Enrichment-triggered prodrug activation demonstrated through mitochondria-targeted delivery of doxorubicin and carbon monoxide. Nat. Chem. 10, 787–794 (2018). · DOI
- Fan, W. et al. Generic synthesis of small-sized hollow mesoporous organosilica nanoparticles for oxygen-independent X-ray-activated synergistic therapy. Nat. Commun. 10, 1241 (2019). · DOI
- Chau, L.-Y. Heme oxygenase-1: emerging target of cancer therapy. J. Biomed. Sci. 22, 22 (2015). · DOI
- Xue, C. et al. NIR‐actuated remote activation of ferroptosis in target tumor cells through a photothermally responsive iron‐chelated biopolymer nanoplatform. Angew. Chem. Int. Ed. 60, 8938–8947 (2021). · DOI
- Chen, X., Kang, R., Kroemer, G. & Tang, D. Broadening horizons: the role of ferroptosis in cancer. Nat. Rev. Clin. Oncol. 18, 280–296 (2021). · DOI
- Xie, L. et al. Phototheranostic metal-phenolic networks with antiexosomal PD-L1 enhanced ferroptosis for synergistic immunotherapy. J. Am. Chem. Soc. 144, 787–797 (2022). · DOI
- He, Y.-J. et al. Fenton reaction-independent ferroptosis therapy via glutathione and iron redox couple sequentially triggered lipid peroxide generator. Biomaterials 241, 119911 (2020). · DOI
- Abraham, N. G. & Kappas, A. Pharmacological and clinical aspects of heme oxygenase. Pharmacol. Rev. 60, 79–127 (2008). · DOI · Paper page
- Xing, R. et al. Self‐assembling endogenous biliverdin as a versatile near‐infrared photothermal nanoagent for cancer theranostics. Adv. Mater. 31, 1900822 (2019). · DOI
- Chen, S.-X. et al. A self-activating nanovesicle with oxygen-depleting capability for efficient hypoxia-responsive chemo-thermo cancer therapy. Biomaterials 269, 120533 (2021). · DOI
- Yao, Q. et al. Bioinspired biliverdin/silk fibroin hydrogel for antiglioma photothermal therapy and wound healing. Theranostics 10, 11719–11736 (2020). · DOI
- Lee, Y. et al. Multistimuli-responsive bilirubin nanoparticles for anticancer therapy. Angew. Chem. Int. Ed. 55, 10676–10680 (2016). · DOI
- Shan, L. et al. Organosilica-based hollow mesoporous bilirubin nanoparticles for antioxidation-activated self-protection and tumor-specific deoxygenation-driven synergistic therapy. ACS Nano 13, 8903–8916 (2019). · DOI
- Pan, X. et al. MOF‐derived double‐layer hollow nanoparticles with oxygen generation ability for multimodal imaging‐guided sonodynamic therapy. Angew. Chem. Int. Ed. 59, 13557–13561 (2020). · DOI
- Fang, F. et al. Near‐infrared thermally activated delayed fluorescence nanoparticle: a metal‐free photosensitizer for two‐photon‐activated photodynamic therapy at the cell and small animal levels. Small 18, 2106215 (2022). · DOI
- Zhang, J. et al. Self-carried curcumin nanoparticles for in vitro and in vivo cancer therapy with real-time monitoring of drug release. Nanoscale 7, 13503–13510 (2015). · DOI
- Xu, J. et al. Metal‐coordinated supramolecular self‐assemblies for cancer theranostics. Adv. Sci. 8, 2101101 (2021). · DOI
- Cao, M., Xing, R., Chang, R., Wang, Y. & Yan, X. Peptide-coordination self-assembly for the precise design of theranostic nanodrugs. Coord. Chem. Rev. 397, 14–27 (2019). · DOI
- Li, S. et al. Smart peptide-based supramolecular photodynamic metallo-nanodrugs designed by multicomponent coordination self-assembly. J. Am. Chem. Soc. 140, 10794–10802 (2018). · DOI
- Liu, T. et al. Ferrous-supply-regeneration nanoengineering for cancer-cell-specific ferroptosis in combination with imaging-guided photodynamic therapy. ACS Nano 12, 12181–12192 (2018). · DOI
- Zhang, D. et al. Chemotherapeutic drug based metal-organic particles for microvesicle-mediated deep penetration and programmable pH/NIR/hypoxia activated cancer photochemotherapy. Adv. Sci. 5, 1700648 (2018). · DOI
- Li, Y. et al. Amino acid coordination driven self-assembly for enhancing both the biological stability and tumor accumulation of curcumin. Angew. Chem. Int. Ed. 57, 17084–17088 (2018). · DOI
- Li, Z. et al. Robust photodynamic therapy using 5-ALA-incorporated nanocomplexes cures metastatic melanoma through priming of CD4+ CD8+ double positive T cells. Adv. Sci. 6, 1802057 (2019). · DOI
- Wang, S.-B. et al. A versatile carbon monoxide nanogenerator for enhanced tumor therapy and anti-inflammation. ACS Nano 13, 5523–5532 (2019). · DOI
- Wu, D. et al. Mesoporous polydopamine carrying manganese carbonyl responds to tumor microenvironment for multimodal imaging‐guided cancer therapy. Adv. Funct. Mater. 29, 1900095 (2019). · DOI
- Li, Y., Dang, J., Liang, Q. & Yin, L. Carbon monoxide (CO)-strengthened cooperative bioreductive anti-tumor therapy via mitochondrial exhaustion and hypoxia induction. Biomaterials 209, 138–151 (2019). · DOI
- Chen, J. et al. An endogenous h2s-activated nanoplatform for triple synergistic therapy of colorectal cancer. Nano Lett. 22, 6156–6165 (2022). · DOI
- Wolfram, J. & Ferrari, M. Clinical cancer nanomedicine. Nano Today 25, 85–98 (2019). · DOI
- Hartshorn, C. M. et al. Nanotechnology strategies to advance outcomes in clinical cancer care. ACS Nano 12, 24–43 (2018). · DOI
- Bhatia, S. N., Chen, X., Dobrovolskaia, M. A. & Lammers, T. Cancer nanomedicine. Nat. Rev. Cancer 22, 550–556 (2022). · DOI
- Karaosmanoglu, S. et al. Carrier-free nanodrugs for safe and effective cancer treatment. J. Control. Release 329, 805–832 (2021). · DOI
- Wu, P. et al. Manipulating offense and defense signaling to fight cold tumors with carrier-free nanoassembly of fluorinated prodrug and siRNA. Adv. Mater. 34, 2203019 (2022). · DOI
- Zhang, J. et al. Degradable hollow mesoporous silicon/carbon nanoparticles for photoacoustic imaging-guided highly effective chemo-thermal tumor therapy in vitro and in vivo. Theranostics 7, 3007–3020 (2017). · DOI
- Wang, H. et al. Degradable carbon–silica nanocomposite with immunoadjuvant property for dual-modality photothermal/photodynamic therapy. ACS Nano 14, 2847–2859 (2020). · DOI
- Yang, Y. et al. Trisulfide bond–mediated doxorubicin dimeric prodrug nanoassemblies with high drug loading, high self-assembly stability, and high tumor selectivity. Sci. Adv. 6, eabc1725 (2020). · DOI
- Zhu, L. et al. Free radical as a double-edged sword in disease: Deriving strategic opportunities for nanotherapeutics. Coord. Chem. Rev. 475, 214875 (2023). · DOI
- Fang, F. et al. Thermally activated delayed fluorescence material: an emerging class of metal-free luminophores for biomedical applications. Adv. Sci. 475, 2102970 (2021). · DOI
- Stater, E. P., Sonay, A. Y., Hart, C. & Grimm, J. The ancillary effects of nanoparticles and their implications for nanomedicine. Nat. Nanotechnol. 16, 1180–1194 (2021). · DOI
Cited by
Sorted by citations
Sheng, J., Yuan, W., Zhang, M., Chen, Z., Qi, Y., Zhao, Y., & Zhang, S. (2026) · Journal of Nanobiotechnology · doi:10.1186/s12951-026-04028-7 · Cited by 35
Metadata
- Authors
- Fang, F., Wang, S., Song, Y., Sun, M., Chen, W.-C., Zhao, D., & Zhang, J.
- Venue
- Nature Communications
- Published
- 2023-03-25
- Volume
- 14
- Issue
- 1
- ISSN
- 2041-1723
- PMC
- PMC10039359
- Cited by
- 112
- References
- 1
- Language
- en
About these checks
Registry, retraction, Cites and statistics results are computed, not judged, with one exception: a printed reference that no index lists is read once by a model before it counts as a citation error. Claims are extracted by a model and kept only when their quote appears verbatim in the text; each cited source is then checked, with a model’s help, for whether it says what the claim relies on. Those verdicts can be wrong — read the claim’s quote and the cited source before relying on one.
Statistics and arithmetic are recomputed, not judged.
Confidence bands are shown only for fields calibrated on our annotated test set. None is calibrated yet, so no band is shown.
What counts as a claim ›How we measure confidence ›How we check this ›
Are you an author, or do you see a problem with this page? Request a review
