

The DOI matches its Crossref record.
Reconfigurable perovskite X-ray detector for intelligent imaging
Open accessAbstract
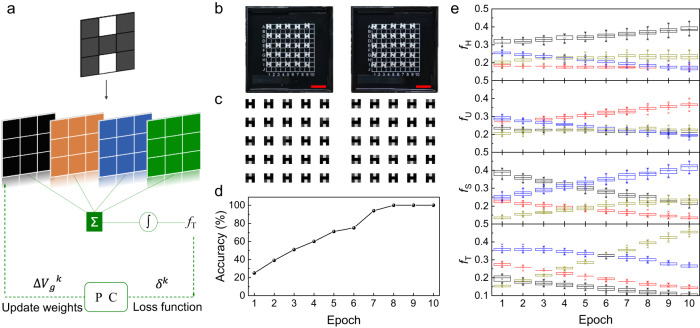
X-ray detection is widely used in various applications. However, to meet the demand for high image quality and high accuracy diagnosis, the raw data increases and imposes challenges for conventional X-ray detection hardware regarding data transmission and power consumption. To tackle these issues, we present a scheme of in-X-ray-detector computing based on CsPbBr 3 single-crystal detector with convenient polarity reconfigurability, good linear dynamic range, and robust stability. The detector features a stable trap-free device structure and achieves a high linear dynamic range of 106 dB. As a result, the detector could achieve edge extraction imaging with a data compression ratio of ~50%, and could also be programmed and trained to perform pattern recognition tasks with a high accuracy of 100%. Our research shows that in-X-ray-detector computing can be used in flexible and complex scenarios, making it a promising platform for intelligent X-ray imaging.
Overview
The claims and statistics of this paper haven’t been checked yet.
Run the check — free, no account needed. It reads the open-access text and checks the sources it cites.
Integrity signals
Registry
Cites
Statistics
Figures
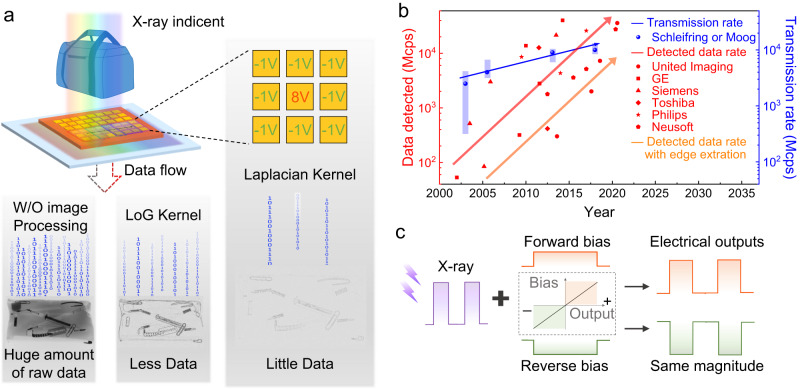
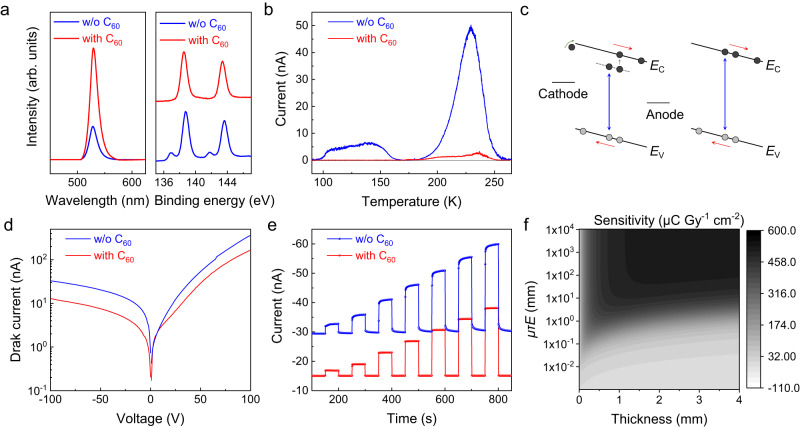
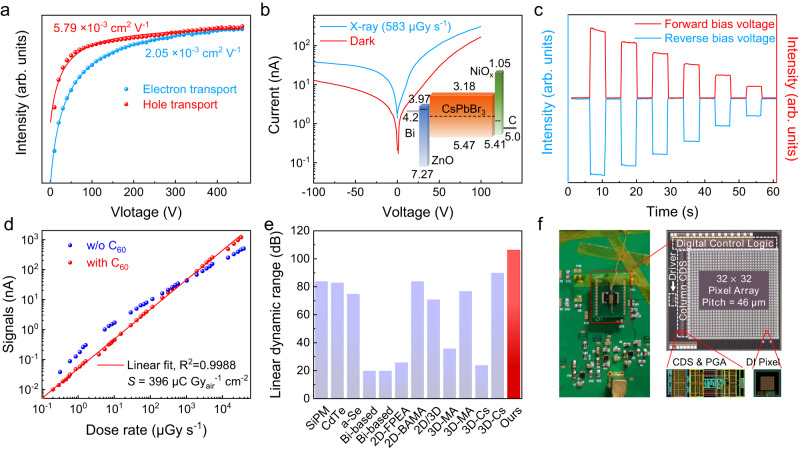
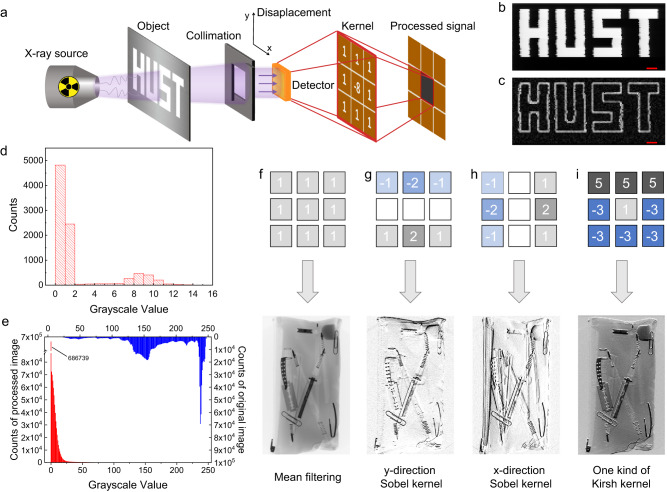
Verification
Claims the paper makes
The claims and statistics of this paper haven’t been checked yet.
Run the check — free, no account needed. It reads the open-access text and checks the sources it cites.
Claims other papers make about this one
Each is checked against this paper’s own text: does it say what the citing paper says it does?
The cited source says what the claim attributes to it.
In the citing paper
“Featuring a trap-free structure and a high dynamic range of 106 dB, the detector enables edge extraction imaging with ~50% data compression and can be trained for pattern recognition with 100% accuracy.”
From Design Strategies and Emerging Applications of Perovskite-Based Sensors (2025) · cites this paper as [230]
The cited source says what the claim attributes to it.
In the citing paper
“As shown in Figure 16B, an in-situ X-ray detector computing scheme was developed using a CsPbBr 3 singlecrystal detector with reconfigurable polarity, a wide dynamic range, and strong stability [230].”
From Design Strategies and Emerging Applications of Perovskite-Based Sensors (2025) · cites this paper as [230]
Self-check
Percentages, sums and reported differences re-computed from the paper’s own numbers.
The self-check needs the paper’s full text.
Citations
Cites
No references could be resolved yet.
Research works printed but not linked: 52
- Spahn, M. X-ray detectors in medical imaging. Nucl. Instrum. Meth. A 731, 57–63 (2013). · DOI
- Pang, J. et al. Vertical matrix perovskite X-ray detector for effective multi-energy discrimination. Light Sci. Appl. 11, 105 (2022). · DOI
- Duan, X. et al. X-ray cargo container inspection system with few-view projection imaging. Nucl. Instrum. Meth. A 598, 439–444 (2009). · DOI
- Haff, R. P. & Toyofuku, N. X-ray detection of defects and contaminants in the food industry. Sens. Instrum. Food Qual. 2, 262–273 (2008). · DOI
- Neutze, R., Wouts, R., Van der Spoel, D., Weckert, E. & Hajdu, J. Potential for biomolecular imaging with femtosecond X-ray pulses. Nature 406, 752–757 (2000). · DOI · Paper page
- Thanki, R. M. & Ashish K. Hybrid and Advanced Compression Techniques for Medical Images (Springer International Publishing, 2019) · DOI
- Patidar, G., Kumar, S. & Kumar, D. A review on medical image data compression techniques. In: 2nd Int. Conf. Data, Eng. Appl. (IDEA), 1–6 (IEEE, 2020) · DOI
- Hammer, M., Yoshii, K. & Miceli, A. Strategies for on-chip digital data compression for x-ray pixel detectors. J. Instrum. 16, P01025 (2021). · DOI
- Strempfer, S. et al. A lightweight, user-configurable detector ASIC digital architecture with on-chip data compression for MHz X-ray coherent diffraction imaging. J. Instrum. 17, P10042 (2022). · DOI
- Barman, R., Badade, S., Deshpande, S., Agarwal, S. & Kulkarni, N. Lossless data compression method using deep learning. In: Mach. Intell. Smart Syst. 145–151 (MISS, 2022) · DOI
- Pi, L. et al. Broadband convolutional processing using band-alignment-tunable heterostructures. Nat. Electron. 5, 248–254 (2022). · DOI
- Wang, C. Y. et al. Gate-tunable van der Waals heterostructure for reconfigurable neural network vision sensor. Sci. Adv. 6, eaba6173 (2020). · DOI
- Jayachandran, D. et al. A low-power biomimetic collision detector based on an in-memory molybdenum disulfide photodetector. Nat. Electron. 3, 646–655 (2020). · DOI
- Moin, A. et al. A wearable biosensing system with in-sensor adaptive machine learning for hand gesture recognition. Nat. Electron. 4, 54–63 (2021). · DOI
- Kasap, S. O., Koughia, K. V., Fogal, B., Belev, G. & Johanson, R. E. The influence of deposition conditions and alloying on the electronic properties of amorphous selenium. Semiconductors 37, 789–794 (2003). · DOI
- Owens, A. Semiconductor materials and radiation detection. J. Synchrotron Radiat. 13, 143–150 (2006). · DOI
- Zhou, Y. et al. Self-powered perovskite photon-counting detectors. Nature 616, 1–7 (2023). · DOI
- Buonanno, L., Di Vita, D., Carminati, M. & Fiorini, C. Gamma: a 16-channel spectroscopic asic for sipms readout with 84-db dynamic range. IEEE Trans. Nucl. Sci. 68, 2559–2572 (2021). · DOI
- Zhuang, R. et al. Highly sensitive X-ray detector made of layered perovskite-like (NH4)3Bi2I9 single crystal with anisotropic response. Nat. Photon. 13, 602–608 (2019). · DOI
- Zhang, Y. et al. Nucleation-controlled growth of superior lead-free perovskite Cs3Bi2I9 single-crystals for high-performance X-ray detection. Nat. Commun. 11, 2304 (2020). · DOI
- Li, H. et al. Sensitive and stable 2D perovskite single-crystal X-ray detectors enabled by a supramolecular anchor. Adv. Mater. 32, 2003790 (2020). · DOI
- Wei, H. et al. Dopant compensation in alloyed CH3NH3PbBr3-xClx perovskite single crystals for gamma-ray spectroscopy. Nat. Mater. 16, 826–833 (2017). · DOI
- Lai, P. T. et al. All-Vacuum-deposited perovskite X-ray detector with a record-high self-powered sensitivity of 1.2 C Gy-1 cm−3. ACS Appl. Mater. Interfaces 14, 19795–19805 (2022). · DOI
- Guo, F. et al. A nanocomposite ultraviolet photodetector based on interfacial trap-controlled charge injection. Nat. Nanotechnol. 7, 798–802 (2012). · DOI
- Konstantatos, G., Clifford, J., Levina, L. & Sargent, E. H. Sensitive solution-processed visible-wavelength photodetectors. Nat. Photon. 1, 531–534 (2007). · DOI
- Fang, Y., Armin, A., Meredith, P. & Huang, J. Accurate characterization of next-generation thin-film photodetectors. Nat. Photon. 13, 1–4 (2019). · DOI
- Liu, D. et al. Impact of ultrathin C60 on perovskite photovoltaic devices. ACS Nano 12, 876–883 (2018). · DOI
- Muscarella, L. et al. Trap passivation and suppressed electrochemical dynamics in perovskite solar cells with C60 interlayers. Electrochim. Acta 433, 141215 (2022). · DOI
- Wojciechowski, K. et al. C60 as an efficient n-type compact layer in perovskite solar cells. J. Phys. Chem. Lett. 6, 2399–2405 (2015). · DOI
- Liu, X. et al. Novel efficient C60-based inverted perovskite solar cells with negligible hysteresis. Electrochim. Acta 288, 115–125 (2018). · DOI
- Zhang, M. et al. Determination of defect levels in melt-grown all-inorganic perovskite CsPbBr3 crystals by thermally stimulated current spectra. J. Phys. Chem. C. 122, 10309–10315 (2018). · DOI
- He, Y. et al. High spectral resolution of gamma-rays at room temperature by perovskite CsPbBr3 single crystals. Nat. Commun. 9, 1609 (2018). · DOI
- Wang, F. et al. Precursor engineering for solution method-grown spectroscopy-grade CsPbBr3 crystals with high energy resolution. Chem. Mater. 34, 3993–4000 (2022). · DOI
- Ni, Z. et al. Resolving spatial and energetic distributions of trap states in metal halide perovskite solar cells. Science 367, 1352–1358 (2020). · DOI
- Fei, C. et al. Lead-chelating hole-transport layers for efficient and stable perovskite minimodules. Science 380, 823–829 (2023). · DOI
- Kang, J. & Wang, L. W. High defect tolerance in lead halide perovskite CsPbBr3. J. Phys. Chem. Lett. 8, 489–493 (2017). · DOI
- Di, J. et al. Reveal the humidity effect on the phase pure CsPbBr3 single crystals formation at room temperature and its application for ultrahigh sensitive X-ray detector. Adv. Sci. 9, 2103482 (2022). · DOI
- Peng, J. et al. Crystallization of CsPbBr3 single crystals in water for X-ray detection. Nat. Commun. 12, 1531 (2021). · DOI
- Zhang, P. et al. Ultrasensitive and robust 120 keV hard X-Ray imaging detector based on mixed-halide perovskite CsPbBr3-nIn single crystals. Adv. Mater. 34, 2106562 (2022). · DOI
- Panneerselvam, D. M. & Kabir, M. Z. Evaluation of organic perovskite photoconductors for direct conversion X-ray imaging detectors. J. Mater. Sci. Mater. Electron. 28, 7083–7090 (2017). · DOI
- Greiffenberg, D., Fauler, A., Zwerger, A. & Fiederle, M. Energy resolution and transport properties of CdTe-Timepix-Assemblies. J. Instrum. 6, C01058 (2011). · DOI
- Toufanian, R., Swain, S., Becla, P., Motakef, S. & Datta, A. Cesium lead bromide semiconductor radiation detectors: crystal growth, detector performance and polarization. J. Mater. Chem. C. 10, 12708–12714 (2022). · DOI
- Tsai, H. et al. A sensitive and robust thin-film x-ray detector using 2D layered perovskite diodes. Sci. Adv. 6, eaay0815 (2020). · DOI
- Xu, X. et al. Sequential growth of 2D/3D double-layer perovskite films with superior X-ray detection performance. Adv. Sci. 8, 2102730 (2021). · DOI
- Wei, W. et al. Monolithic integration of hybrid perovskite single crystals with heterogenous substrate for highly sensitive X-ray imaging. Nat. Photon. 11, 315–321 (2017). · DOI
- Pan, L. et al. Ultra-high flux X-ray detection by solution-grown perovskite CsPbBr3 single crystal semiconductor detector. Adv. Mater. 35, 2211840 (2023). · DOI
- He, Y. et al. Sensitivity and detection limit of spectroscopic-grade perovskite CsPbBr3 crystal for hard X-ray detection. Adv. Funct. Mater. 32, 2112925 (2022). · DOI
- Kim, Y. et al. Printable organometallic perovskite enables large-area, low-dose X-ray imaging. Nature 550, 87–91 (2017). · DOI
- Deumel, S. et al. High-sensitivity high-resolution X-ray imaging with soft-sintered metal halide perovskites. Nat. Electron. 4, 681–688 (2021). · DOI
- Mery, D. et al. GDXray: the database of X-ray images for nondestructive testing. J. Nondestruct. Eval. 34, 1–12 (2015). · DOI
- Gatys, L. A., Ecker, A. S. & Bethge, M. Image style transfer using convolutional neural networks. In: Proc. IEEE Conf. Comput. Vis. Pattern Recognit. 2414–2423 (IEEE, 2016) · DOI · Paper page
- Jang, H. et al. In-sensor optoelectronic computing using electrostatically doped silicon. Nat. Electron. 5, 519–525 (2022). · DOI
Cited by
Sorted by citations
Design Strategies and Emerging Applications of Perovskite-Based Sensors
Li, Y., Ding, Y., Sun, J., Tan, S., Li, Y., Wang, X., Cai, J., Bai, J., Lv, X., Guo, W., et al. (2025) · SmartMat · doi:10.1002/smm2.70022 · Cited by 41
“As shown in Figure 16B, an in ‐ situ X ‐ ray detector computing scheme was developed using a CsPbBr 3 single ‐ crystal detector with reconfigurable polarity, a wide dynamic range, and strong stability [230].”
Facet junction of two-dimensional metal halide perovskite for photocatalytic hydrogen evolution
Wang, X., Sui, X., Wang, M., Zheng, Z., Yuan, H., Yang, S., Yang, H. G., Peng, Y., & Hou, Y. (2025) · Applied Catalysis B: Environment and Energy · doi:10.1016/j.apcatb.2024.124937 · Cited by 15
Metadata
- Authors
- Pang, J., Wu, H., Li, H., Jin, T., Tang, J., & Niu, G.
- Affiliations
- Wuhan National Laboratory for Optoelectronics (CN)
- Corresponding author
- Niu, Guangda
- Venue
- Nature Communications
- Published
- 2024-02-27
- Volume
- 15
- Issue
- 1
- Pages
- 1769-1769
- ISSN
- 2041-1723 (ISSN-L)
- PMC
- PMC10899650
- OpenAlex
- W4392200309
- Cited by
- 110
- References
- 0
- Citations by year
- 2026: 35 · 2025: 50 · 2024: 25
- FWCI
- 32.57
- Type
- journal article
- Language
- en
- Open access
- gold
- doi.org
- Locations
- Nature Communications (publishedVersion, cc-by)
- PubMed Central (publishedVersion, cc-by)
- PubMed (publishedVersion)
- RePEc: Research Papers in Economics (submittedVersion)
- DOAJ (DOAJ: Directory of Open Access Journals) (submittedVersion, cc-by-sa)
- Funders
- National Natural Science Foundation of China (62134003, 12050005, 62074066)
- Fundamental Research Funds for the Central Universities
- Topics
- Physical Sciences › Physics and Astronomy › Radiation › Radiation Detection and Scintillator Technologies
- Physical Sciences › Engineering › Electrical and Electronic Engineering › Advanced Semiconductor Detectors and Materials
- Physical Sciences › Engineering › Electrical and Electronic Engineering › Perovskite Materials and Applications
- Keywords
- in-sensor computing, linear dynamic range, radiography, edge detection, data compression, pattern recognition
About these checks
Registry, retraction, Cites and statistics results are computed, not judged, with one exception: a printed reference that no index lists is read once by a model before it counts as a citation error. Claims are extracted by a model and kept only when their quote appears verbatim in the text; each cited source is then checked, with a model’s help, for whether it says what the claim relies on. Those verdicts can be wrong — read the claim’s quote and the cited source before relying on one.
Statistics and arithmetic are recomputed, not judged.
Confidence bands are shown only for fields calibrated on our annotated test set. None is calibrated yet, so no band is shown.
What counts as a claim ›How we measure confidence ›How we check this ›
Are you an author, or do you see a problem with this page? Request a review
