

The DOI matches its Crossref record; 4 of the 4 references it cites were found in a registry or an index.
Targeting Pseudomonas aeruginosa biofilm with an evolutionary trained bacteriophage cocktail exploiting phage resistance trade-offs
Open accessPublished version of a preprint
Abstract
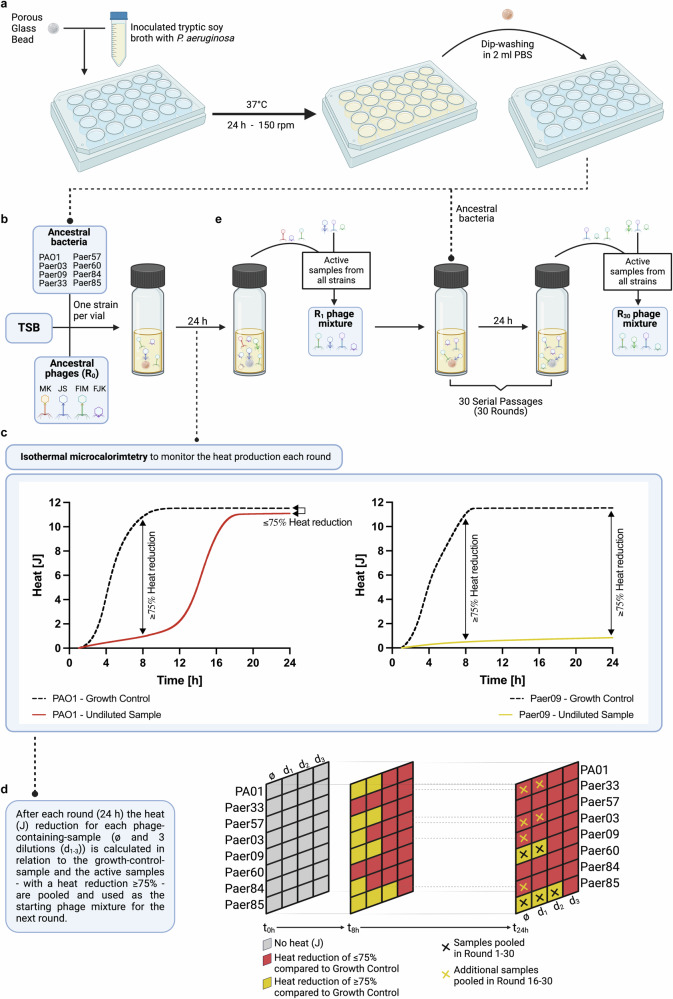
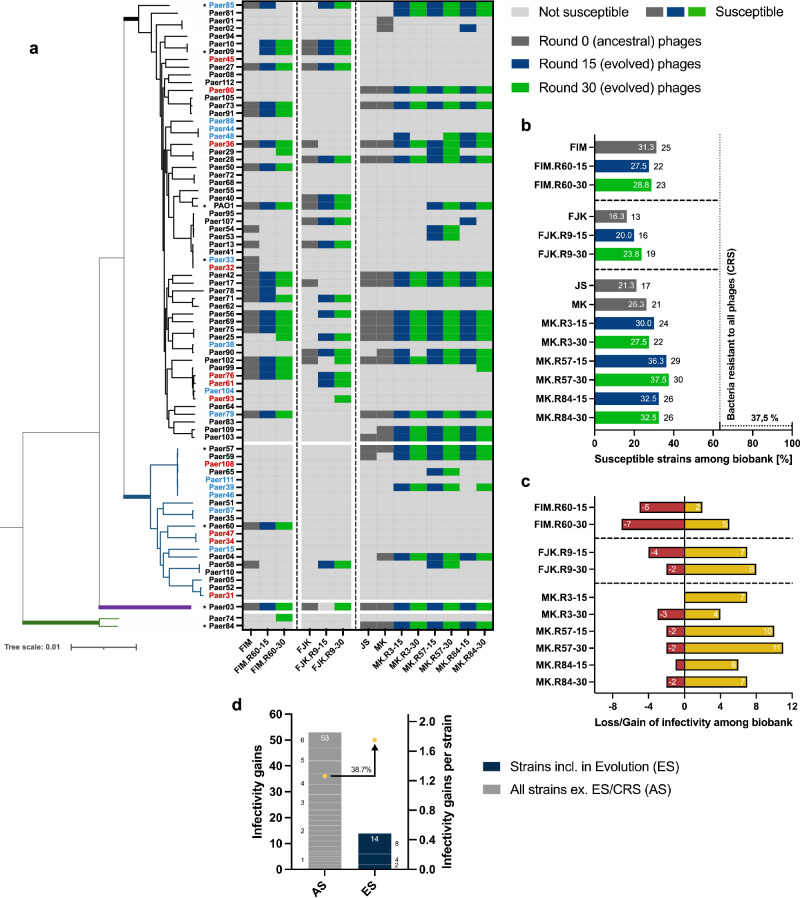
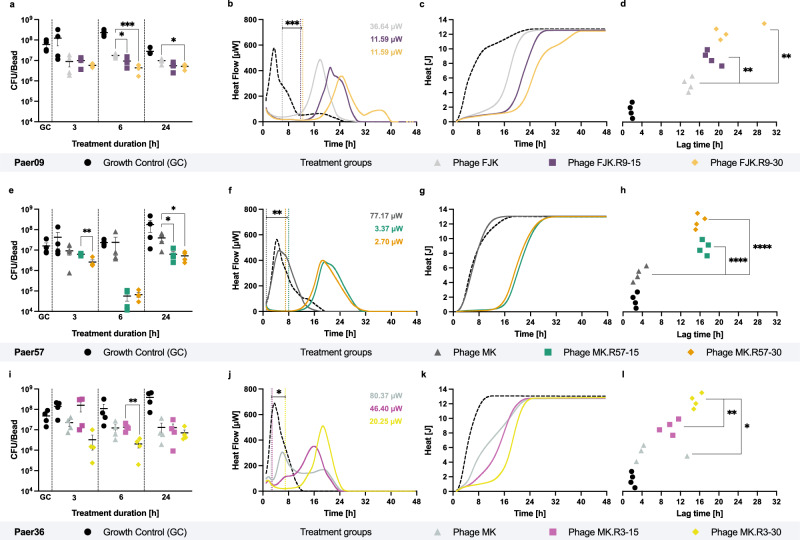
Spread of multidrug-resistant Pseudomonas aeruginosa strains threatens to render currently available antibiotics obsolete, with limited prospects for the development of new antibiotics. Lytic bacteriophages, the viruses of bacteria, represent a path to combat this threat. In vitro-directed evolution is traditionally applied to expand the bacteriophage host range or increase bacterial suppression in planktonic cultures. However, while up to 80% of human microbial infections are biofilm-associated, research towards targeted improvement of bacteriophages’ ability to combat biofilms remains scarce. This study aims at an in vitro biofilm evolution assay to improve multiple bacteriophage parameters in parallel and the optimisation of bacteriophage cocktail design by exploiting a bacterial bacteriophage resistance trade-off. The evolved bacteriophages show an expanded host spectrum, improved antimicrobial efficacy and enhanced antibiofilm performance, as assessed by isothermal microcalorimetry and quantitative polymerase chain reaction, respectively. Our two-phage cocktail reveals further improved antimicrobial efficacy without incurring dual-bacteriophage-resistance in treated bacteria. We anticipate this assay will allow a better understanding of phenotypic-genomic relationships in bacteriophages and enable the training of bacteriophages against other desired pathogens. This, in turn, will strengthen bacteriophage therapy as a treatment adjunct to improve clinical outcomes of multidrug-resistant bacterial infections.
Overview
The claims and statistics of this paper haven’t been checked yet.
Run the check — free, no account needed. It reads the open-access text and checks the sources it cites.
Integrity signals
Registry
Cites
Statistics
Figures
Verification
Claims the paper makes
The claims and statistics of this paper haven’t been checked yet.
Run the check — free, no account needed. It reads the open-access text and checks the sources it cites.
Self-check
Percentages, sums and reported differences re-computed from the paper’s own numbers.
The self-check needs the paper’s full text.
Citations
Cites
Highly accurate protein structure prediction with AlphaFold
Jumper, J., Evans, R., Pritzel, A., Green, T., Figurnov, M., Ronneberger, O., Tunyasuvunakool, K., Bates, R., Žídek, A., Potapenko, A., et al. (2021) · Nature · doi:10.1038/s41586-021-03819-2 · Cited by 43,764
ColabFold - Making protein folding accessible to all
Mirdita, M., Schütze, K., Moriwaki, Y., Heo, L., Ovchinnikov, S., & Steinegger, M. (2021) · doi:10.1101/2021.08.15.456425 · Cited by 9,391
Tacconelli, E., Carrara, E., Savoldi, A., Harbarth, S., Mendelson, M., Monnet, D. L., Pulcini, C., Kahlmeter, G., Kluytmans, J., Carmeli, Y., et al. (2018) · The Lancet Infectious Diseases · doi:10.1016/s1473-3099(17)30753-3 · Cited by 6,142
Roary: rapid large-scale prokaryote pan genome analysis
Page, A. J., Cummins, C. A., Hunt, M., Wong, V. K., Reuter, S., Holden, M. T. G., Fookes, M., Falush, D., Keane, J. A., & Parkhill, J. (2015) · Bioinformatics · doi:10.1093/bioinformatics/btv421 · Cited by 5,736
Research works printed but not linked: 105
- Centers for Disease, C., Prevention, National Center for Emerging, Z., Infectious Diseases. Division of Healthcare Quality Promotion. Antibiotic Resistance, C. & Strategy, U. Antibiotic resistance threats in the United States, 2019. https://doi.org/10.15620/cdc:82532 (2019). · DOI · Paper page
- Nathwani, D., Raman, G., Sulham, K., Gavaghan, M. & Menon, V. Clinical and economic consequences of hospital-acquired resistant and multidrug-resistant Pseudomonas aeruginosa infections: a systematic review and meta-analysis. Antimicrob. Resist. Infect. Control 3, 32 (2014). · DOI
- Pang, Z., Raudonis, R., Glick, B. R., Lin, T.-J. & Cheng, Z. Antibiotic resistance in Pseudomonas aeruginosa: mechanisms and alternative therapeutic strategies. Biotechnol. Adv. 37, 177–192 (2019). · DOI
- Langendonk, R. F., Neill, D. R. & Fothergill, J. L. The building blocks of antimicrobial resistance in Pseudomonas aeruginosa: implications for current resistance-breaking therapies. Front. Cell. Infect. Microbiol. 11 https://doi.org/10.3389/fcimb.2021.665759 (2021). · DOI
- Costerton, J. W. Cystic fibrosis pathogenesis and the role of biofilms in persistent infection. Trends Microbiol. 9, 50–52 (2001). · DOI
- Potera, C. Forging a link between biofilms and disease. Science 283, 1837–1839 (1999). · DOI
- Frølund, B., Palmgren, R., Keiding, K. & Nielsen, P. H. Extraction of extracellular polymers from activated sludge using a cation exchange resin. Water Res. 30, 1749–1758 (1996). · DOI
- Mann, E. E. & Wozniak, D. J. Pseudomonas biofilm matrix composition and niche biology. FEMS Microbiol. Rev. 36, 893–916 (2012). · DOI
- Thi, M. T. T., Wibowo, D. & Rehm, B. H. A. Pseudomonas aeruginosa biofilms. Int. J. Mol. Sci. 21, 8671 (2020). · DOI
- Rasamiravaka, T., Labtani, Q., Duez, P. & El Jaziri, M. The formation of biofilms by Pseudomonas aeruginosa: a review of the natural and synthetic compounds interfering with control mechanisms. BioMed. Res. Int. 2015, 759348 (2015). · DOI
- Flemming, H.-C. et al. Biofilms: an emergent form of bacterial life. Nat. Rev. Microbiol. 14, 563–575 (2016). · DOI · Paper page
- Mulcahy, L. R., Isabella, V. M. & Lewis, K. Pseudomonas aeruginosa biofilms in disease. Microb. Ecol. 68, 1–12 (2014). · DOI
- Fong, S. A. et al. Activity of bacteriophages in removing biofilms of Pseudomonas aeruginosa isolates from chronic rhinosinusitis patients. Front. Cell. Infect. Microbiol. 7, 418–418 (2017). · DOI
- Forti, F. et al. Design of a broad-range bacteriophage cocktail that reduces Pseudomonas aeruginosa biofilms and treats acute infections in two animal models. Antimicrob. Agents Chemother. 62, e02573–17 (2018). · DOI
- Yan, J., Mao, J. & Xie, J. Bacteriophage polysaccharide depolymerases and biomedical applications. BioDrugs 28, 265–274 (2014). · DOI
- Glonti, T., Chanishvili, N. & Taylor, P. W. Bacteriophage-derived enzyme that depolymerizes the alginic acid capsule associated with cystic fibrosis isolates of Pseudomonas aeruginosa. J. Appl. Microbiol. 108, 695–702 (2010). · DOI
- Olszak, T. et al. The O-specific polysaccharide lyase from the phage LKA1 tailspike reduces Pseudomonas virulence. Sci. Rep. 7, 16302 (2017). · DOI
- Knecht, L. E., Veljkovic, M. & Fieseler, L. Diversity and function of phage encoded depolymerases. Front. Microbiol. 10, 2949 (2019). · DOI
- Mi, L. et al. Identification of a lytic Pseudomonas aeruginosa phage depolymerase and its anti-biofilm effect and bactericidal contribution to serum. Virus Genes 55, 394–405 (2019). · DOI
- Guo, M. et al. A novel antimicrobial endolysin, LysPA26, against Pseudomonas aeruginosa. Front. Microbiol. 8, 293 (2017). · DOI
- Hanlon, G. W., Denyer, S. P., Olliff, C. J. & Ibrahim, L. J. Reduction in exopolysaccharide viscosity as an aid to bacteriophage penetration through Pseudomonas aeruginosa biofilms. Appl. Environ. Microbiol. 67, 2746–2753 (2001). · DOI
- Pires, D. P., Oliveira, H., Melo, L. D. R., Sillankorva, S. & Azeredo, J. Bacteriophage-encoded depolymerases: their diversity and biotechnological applications. Appl. Microbiol. Biotechnol. 100, 2141–2151 (2016). · DOI
- Latka, A., Maciejewska, B., Majkowska-Skrobek, G., Briers, Y. & Drulis-Kawa, Z. Bacteriophage-encoded virion-associated enzymes to overcome the carbohydrate barriers during the infection process. Appl. Microbiol. Biotechnol. 101, 3103–3119 (2017). · DOI
- Visnapuu, A., Van der Gucht, M., Wagemans, J. & Lavigne, R. Deconstructing the phage-bacterial biofilm interaction as a basis to establish new antibiofilm strategies. Viruses 14, 1057 (2022). · DOI
- Pearl, S., Gabay, C., Kishony, R., Oppenheim, A. & Balaban, N. Q. Nongenetic individuality in the host-phage interaction. PLOS Biol. 6, e120 (2008). · DOI
- Chan, B. K., Abedon, S. T. & Loc-Carrillo, C. Phage cocktails and the future of phage therapy. Future Microbiol. 8, 769–783 (2013). · DOI
- Merabishvili, M., Pirnay, J.-P. & De Vos, D. Guidelines to Compose an Ideal Bacteriophage Cocktail. Bacteriophage Therapy: From Lab to Clinical Practice, 99–110 https://doi.org/10.1007/978-1-4939-7395-8_9 (2018). · DOI
- Abedon, S. T., Danis-Wlodarczyk, K. M. & Wozniak, D. J. Phage cocktail development for bacteriophage therapy: toward improving spectrum of activity breadth and depth. Pharmaceuticals 14, 1019 (2021). · DOI
- Borin, J. M., Avrani, S., Barrick, J. E., Petrie, K. L. & Meyer, J. R. Coevolutionary phage training leads to greater bacterial suppression and delays the evolution of phage resistance. Proc. Natl Acad. Sci. 118, e2104592118 (2021). · DOI
- Betts, A., Vasse, M., Kaltz, O. & Hochberg, M. E. Back to the future: evolving bacteriophages to increase their effectiveness against the pathogen Pseudomonas aeruginosa PAO1. Evolut. Appl. 6, 1054–1063 (2013). · DOI
- Burmeister, A. R., Sullivan, R. M., Gallie, J. & Lenski, R. E. Sustained coevolution of phage Lambda and Escherichia coli involves inner- as well as outer-membrane defences and counter-defences. Microbiology 167, 001063 (2021). · DOI
- Mapes, A. C., Trautner, B. W., Liao, K. S. & Ramig, R. F. Development of expanded host range phage active on biofilms of multi-drug resistant Pseudomonas aeruginosa. Bacteriophage 6, e1096995 (2016). · DOI
- Favor, A. H., Llanos, C. D., Youngblut, M. D. & Bardales, J. A. Optimizing bacteriophage engineering through an accelerated evolution platform. Sci. Rep. 10, 13981 (2020). · DOI
- Kering, K. K., Zhang, X., Nyaruaba, R., Yu, J. & Wei, H. Application of adaptive evolution to improve the stability of bacteriophages during storage. Viruses 12, 423 (2020). · DOI
- Akusobi, C., Chan, B. K., Williams, E. S. C. P., Wertz, J. E. & Turner, P. E. Parallel evolution of host-attachment proteins in phage PP01 populations adapting to Escherichia coli O157:H7. Pharmaceuticals 11, 60 (2018). · DOI
- Swanson, N. A. et al. Cryo-EM structure of the periplasmic tunnel of T7 DNA-ejectosome at 2.7 Å resolution. Mol. Cell 81, 3145–3159.e7 (2021). · DOI
- Pyra, A. et al. Tail tubular protein A: a dual-function tail protein of Klebsiella pneumoniae bacteriophage KP32. Sci. Rep. 7, 2223 (2017). · DOI
- Schwarzer, D., Stummeyer, K., Gerardy-Schahn, R. & Mühlenhoff, M. Characterization of a novel intramolecular chaperone domain conserved in endosialidases and other bacteriophage tail spike and fiber proteins. J. Biol. Chem. 282, 2821–2831 (2007). · DOI
- Morley, T. J., Willis, L. M., Whitfield, C., Wakarchuk, W. W. & Withers, S. G. A new sialidase mechanism: bacteriophage K1F endo-sialidase is an inverting glycosidase. J. Biol. Chem. 284, 17404–17410 (2009). · DOI
- Jakobsson, E., Schwarzer, D., Jokilammi, A. & Finne, J. Endosialidases: versatile tools for the study of polysialic acid. Top. Curr. Chem. 367, 29–73 (2015). · DOI
- Haggård-Liungquist, E. et al. Bacteriophage P2: genes involved in baseplate assembly. Virology 213, 109–121 (1995). · DOI
- Gil, F. et al. The lytic cassette of mycobacteriophage Ms6 encodes an enzyme with lipolytic activity. Microbiology 154, 1364–1371 (2008). · DOI
- Poon, K. K. H., Westman, E. L., Vinogradov, E., Jin, S. & Lam, J. S. Functional characterization of MigA and WapR: putative rhamnosyltransferases involved in outer core oligosaccharide biosynthesis of Pseudomonas aeruginosa. J. Bacteriol. 190, 1857–1865 (2008). · DOI
- Rahim, R., Burrows, L. L., Monteiro, M. A., Perry, M. B. & Lam, J. S. Involvement of the RML locus in core oligosaccharide and O polysaccharide assembly in Pseudomonas aeruginosa. Microbiology 146, 2803–2814 (2000). · DOI
- Elamin, A. A. et al. Novel drug targets in cell wall biosynthesis exploited by gene disruption in Pseudomonas aeruginosa. PLoS One 12, e0186801 (2017). · DOI
- Alphey, M. S. et al. Allosteric competitive inhibitors of the glucose-1-phosphate thymidylyltransferase (RmlA) from Pseudomonas aeruginosa. ACS Chem. Biol. 8, 387–396 (2013). · DOI
- Huszczynski, S. M., Lam, J. S. & Khursigara, C. M. The role of Pseudomonas aeruginosa lipopolysaccharide in bacterial pathogenesis and physiology. Pathogens 9, 6 (2020). · DOI
- Overhage, J., Schemionek, M., Webb, J. S. & Rehm, B. H. A. Expression of the psl operon in Pseudomonas aeruginosa PAO1 biofilms: PslA performs an essential function in biofilm formation. Appl. Environ. Microbiol. 71, 4407–4413 (2005). · DOI
- Sackman, A. M. et al. Mutation-driven parallel evolution during viral adaptation. Mol. Biol. Evol. 34, 3243–3253 (2017). · DOI
- Perry, E. B., Barrick, J. E. & Bohannan, B. J. The molecular and genetic basis of repeatable coevolution between Escherichia coli and bacteriophage T3 in a laboratory microcosm. PLoS One 10, e0130639 (2015). · DOI
- Bull, J. J. et al. Exceptional convergent evolution in a virus. Genetics 147, 1497–1507 (1997). · DOI
- Esvelt, K. M., Carlson, J. C. & Liu, D. R. A system for the continuous directed evolution of biomolecules. Nature 472, 499–503 (2011). · DOI
- Wichman, H. A., Badgett, M. R., Scott, L. A., Boulianne, C. M. & Bull, J. J. Different trajectories of parallel evolution during viral adaptation. Science 285, 422–424 (1999). · DOI
- Schmerer, M., Molineux, I. J. & Bull, J. J. Synergy as a rationale for phage therapy using phage cocktails. PeerJ 2, e590 (2014). · DOI
- Niu, Y. D. et al. Efficacy of individual bacteriophages does not predict efficacy of bacteriophage cocktails for control of Escherichia coli O157. Front. Microbiol. 12, 616712 (2021). · DOI
- Sharma, S. et al. Bacteriophages and its applications: an overview. Folia Microbiol. 62, 17–55 (2017). · DOI
- Połaska, M. & Sokołowska, B. Bacteriophages—a new hope or a huge problem in the food industry. AIMS Microbiol. 5, 324–346 (2019). · DOI
- Sigg, A. P. et al. A method to determine the efficacy of a commercial phage preparation against uropathogens in urine and artificial urine determined by isothermal microcalorimetry. Microorganisms 10, 845 (2022). · DOI
- Tkhilaishvili, T. et al. Real-time assessment of bacteriophage T3-derived antimicrobial activity against planktonic and biofilm-embedded Escherichia coli by isothermal microcalorimetry. Res. Microbiol. 169, 515–521 (2018). · DOI
- Łusiak-Szelachowska, M., Weber-Dąbrowska, B. & Górski, A. Bacteriophages and lysins in biofilm control. Virol. Sin. 35, 125–133 (2020). · DOI
- Eskenazi, A. et al. Combination of pre-adapted bacteriophage therapy and antibiotics for treatment of fracture-related infection due to pandrug-resistant Klebsiella pneumoniae. Nat. Commun. 13, 302 (2022). · DOI
- Gordillo Altamirano, F. L. & Barr, J. J. Unlocking the next generation of phage therapy: the key is in the receptors. Curr. Opin. Biotechnol. 68, 115–123 (2021). · DOI
- Yang, Y. et al. Development of a bacteriophage cocktail to constrain the emergence of phage-resistant Pseudomonas aeruginosa. Front. Microbiol. 11, 327 (2020). · DOI
- Chen, B. et al. Alginate microbeads and hydrogels delivering meropenem and bacteriophages to treat Pseudomonas aeruginosa fracture-related infections. J. Control. Rel. 364, 159–173 (2023). · DOI
- Castledine, M. et al. Parallel evolution of Pseudomonas aeruginosa phage resistance and virulence loss in response to phage treatment in vivo and in vitro. eLife 11, e73679 (2022). · DOI
- Nair, A. & Khairnar, K. Genetically engineered phages for therapeutics: proceed with caution. Nat. Med. 25, 1028–1028 (2019). · DOI
- Commission for Hospital Hygiene and Infection Prevention (KRINKO). Supplement to the KRINKO recommendation ‘Hygiene measures for infections or colonisation with multi-resistant Gram-negative rods’ (2012) in connection with the new category ‘I’ defined by EUCAST in the determination of antibiotic resistance: consequences for the definition of MRGN. Epidemiol. Bull. 9, 82–83 (2019).
- Wolfensberger, A., Kuster, S. P., Marchesi, M., Zbinden, R. & Hombach, M. The effect of varying multidrug-resistence (MDR) definitions on rates of MDR Gram-negative rods. Antimicrob. Resist. Infect. Control 8, 193 (2019). · DOI
- Wang, L., Tkhilaishvili, T., Bernal Andres, B., Trampuz, A. & Gonzalez Moreno, M. Bacteriophage-antibiotic combinations against ciprofloxacin/ceftriaxone-resistant Escherichia coli in vitro and in an experimental Galleria mellonella model. Int. J. Antimicrob. Agents 56, 106200 (2020). · DOI
- Kunisch, F. & Gonzalez Moreno, M. Protocol Exchange, PROTOCOL (Version 1) available at https://doi.org/10.21203/rs.3.pex-1886/v1, (2023). · DOI
- Kunisch, F., Ponce Benavente, L. & Gonzalez Moreno, M. Protocol Exchange, PROTOCOL (Version 1) available at https://doi.org/10.21203/rs.3.pex-1953/v1, (2023). · DOI
- Kunisch, F., Wagemans, J. & Gonzalez Moreno, M. Protocol Exchange, PROTOCOL (Version 1) available at https://doi.org/10.21203/rs.3.pex-1956/v1, (2023). · DOI
- Zhang, Z., Schwartz, S., Wagner, L. & Miller, W. A greedy algorithm for aligning DNA sequences. J. Comput. Biol. 7, 203–214 (2000). · DOI
- Schneider, C. A., Rasband, W. S. & Eliceiri, K. W. NIH Image to ImageJ: 25 years of image analysis. Nat. Methods 9, 671–675 (2012). · DOI · Paper page
- Burrowes, B. H., Molineux, I. J. & Fralick, J. A. Directed in vitro evolution of therapeutic bacteriophages: the Appelmans protocol. Viruses 11, 241 (2019). · DOI
- Braissant, O. et al. Isothermal microcalorimetry accurately detects bacteria, tumorous microtissues, and parasitic worms in a label-free well-plate assay. Biotechnol. J. 10, 460–468 (2015). · DOI
- Braissant, O., Wirz, D., Göpfert, B. & Daniels, A. U. Use of isothermal microcalorimetry to monitor microbial activities. FEMS Microbiol. Lett. 303, 1–8 (2010). · DOI
- Butini, M. E. et al. Real-time antimicrobial susceptibility assay of planktonic and biofilm bacteria by isothermal microcalorimetry. Adv. Microbiol., Infect. Dis. Public Health.: Vol. 13, 61–77 (2019).
- Lood, C. et al. Genomics of an endemic cystic fibrosis Burkholderia multivorans strain reveals low within-patient evolution but high between-patient diversity. PLOS Pathog. 17, e1009418 (2021). · DOI
- Wick, R. R., Judd, L. M., Gorrie, C. L. & Holt, K. E. Unicycler: resolving bacterial genome assemblies from short and long sequencing reads. PLOS Comput. Biol. 13, e1005595 (2017). · DOI
- Wick, R. R., Schultz, M. B., Zobel, J. & Holt, K. E. Bandage: interactive visualization of de novo genome assemblies. Bioinformatics 31, 3350–3352 (2015). · DOI
- Seemann, T. Prokka: rapid prokaryotic genome annotation. Bioinformatics 30, 2068–2069 (2014). · DOI
- Stamatakis, A. RAxML version 8: a tool for phylogenetic analysis and post-analysis of large phylogenies. Bioinformatics 30, 1312–1313 (2014). · DOI · Paper page
- Letunic, I. & Bork, P. Interactive Tree Of Life (iTOL) v4: recent updates and new developments. Nucleic Acids Res. 47, W256–W259 (2019). · DOI
- Kunisch, F., Wagemans, J. & Gonzalez Moreno, M. Protocol Exchange, PROTOCOL (Version 1) available at https://doi.org/10.21203/rs.3.pex-1955/v1, (2023). · DOI
- Makalatia, K. et al. Characterization of Salmonella isolates from various geographical regions of the caucasus and their susceptibility to bacteriophages. Viruses 12, 1418 (2020). · DOI
- Bankevich, A. et al. SPAdes: a new genome assembly algorithm and its applications to single-cell sequencing. J. Comput. Biol. 19, 455–477 (2012). · DOI
- Moraru, C., Varsani, A. & Kropinski, A. M. VIRIDIC-A novel tool to calculate the intergenomic similarities of prokaryote-infecting viruses. Viruses 12, 1268 (2020). · DOI
- Tamura, K., Stecher, G. & Kumar, S. MEGA11: molecular evolutionary genetics analysis version 11. Mol. Biol. Evol. 38, 3022–3027 (2021). · DOI
- Altschul, S. F. et al. Gapped BLAST and PSI-BLAST: a new generation of protein database search programs. Nucleic Acids Res. 25, 3389–3402 (1997). · DOI · Paper page
- Söding, J., Biegert, A. & Lupas, A. N. The HHpred interactive server for protein homology detection and structure prediction. Nucleic Acids Res. 33, W244–W248 (2005). · DOI
- Remmert, M., Biegert, A., Hauser, A. & Söding, J. HHblits: lightning-fast iterative protein sequence searching by HMM-HMM alignment. Nat. Methods 9, 173–175 (2012). · DOI · Paper page
- Wheeler, T. J. & Eddy, S. R. nhmmer: DNA homology search with profile HMMs. Bioinformatics 29, 2487–2489 (2013). · DOI
- Gabler, F. et al. Protein sequence analysis using the MPI Bioinformatics Toolkit. Curr. Protoc. Bioinforma. 72, e108 (2020). · DOI · Paper page
- Rutherford, K. et al. Artemis: sequence visualization and annotation. Bioinformatics 16, 944–945 (2000). · DOI
- Sullivan, M. J., Petty, N. K. & Beatson, S. A. Easyfig: a genome comparison visualizer. Bioinformatics 27, 1009–1010 (2011). · DOI
- Holm, L. DALI and the persistence of protein shape. Protein Sci. 29, 128–140 (2020). · DOI
- DeLano, W. Use of PyMOL as a communications tool for molecular science. Abstr. Pap. Am. Chem. Soc. 228, U313–U314 (2004).
- Liu, H., Niu, Y. D., Li, J., Stanford, K. & McAllister, T. A. Rapid and accurate detection of bacteriophage activity against Escherichia coli O157:H7 by propidium monoazide real-time PCR. BioMed. Res. Int. 2014, 319351 (2014). · DOI
- Kropinski, A. M., Mazzocco, A., Waddell, T. E., Lingohr, E. & Johnson, R. P. Enumeration of bacteriophages by double agar overlay plaque assay. Methods Mol. Biol. 501, 69–76 (2009). · DOI
- Abedon, S. T. & Katsaounis, T. I. Basic phage mathematics. Methods Mol. Biol. 1681, 3–30 (2018). · DOI
- Viazis, S., Akhtar, M., Feirtag, J., Brabban, A. D. & Diez-Gonzalez, F. Isolation and characterization of lytic bacteriophages against enterohaemorrhagic Escherichia coli. J. Appl. Microbiol. 110, 1323–1331 (2011). · DOI
- Loh, J. M. S., Adenwalla, N., Wiles, S. & Proft, T. Galleria mellonella larvae as an infection model for group A streptococcus. Virulence 4, 419–428 (2013). · DOI
- Tkhilaishvili, T., Wang, L., Tavanti, A., Trampuz, A. & Di Luca, M. Antibacterial efficacy of two commercially available bacteriophage formulations, staphylococcal bacteriophage and PYO bacteriophage, against methicillin-resistant Staphylococcus aureus: prevention and eradication of biofilm formation and control of a systemic infection of Galleria mellonella larvae. Front. Microbiol. 11, 110 (2020). · DOI
- Howell, M., Wirz, D., Daniels, A. U. & Braissant, O. Application of a microcalorimetric method for determining drug susceptibility in Mycobacterium species. J. Clin. Microbiol. 50, 16–20 (2012). · DOI
Metadata
- Authors
- Kunisch, F., Campobasso, C., Wagemans, J., Yildirim, S., Chan, B. K., Schaudinn, C., Lavigne, R., Turner, P. E., Raschke, M. J., Trampuz, A., & Gonzalez Moreno, M.
- Affiliations
- University of Münster (DE)
- University of Pisa (IT)
- KU Leuven (BE)
- Yale University (US)
- Robert Koch Institute (DE)
- ORCID
- Venue
- Nature Communications
- Published
- 2024-10-03
- Volume
- 15
- Issue
- 1
- Pages
- 8572-8572
- ISSN
- 2041-1723 (ISSN-L)
- PMC
- PMC11450229
- OpenAlex
- W4403098193
- Cited by
- 101
- References
- 4
- Citations by year
- 2026: 60 · 2025: 39 · 2024: 2
- FWCI
- 27.62
- Type
- journal article
- Language
- en
- Open access
- gold
- doi.org
- Licence
- Locations
- Nature Communications (publishedVersion, cc-by-nc-nd)
- Research Square (acceptedVersion, cc-by)
- PubMed Central (publishedVersion, cc-by-nc-nd)
- PubMed (publishedVersion)
- Publication server of the Robert Koch Institute (Robert Kock Institute) (submittedVersion, cc-by)
- Lirias (KU Leuven) (submittedVersion, cc-by-nc-nd)
- RePEc: Research Papers in Economics (submittedVersion)
- DOAJ (DOAJ: Directory of Open Access Journals) (submittedVersion, cc-by-sa)
- Funders
- Bundesministerium für Bildung und Forschung (01KI1823)
- Topics
- Life Sciences › Immunology and Microbiology › Virology › Bacteriophages and microbial interactions
- Life Sciences › Biochemistry, Genetics and Molecular Biology › Molecular Biology › Bacterial biofilms and quorum sensing
- Life Sciences › Biochemistry, Genetics and Molecular Biology › Genetics › Evolution and Genetic Dynamics
- Keywords
- Pseudomonas aeruginosa, biofilm, phage therapy, multidrug resistance, host range expansion, antibiofilm activity, isothermal microcalorimetry, real-time PCR
- MeSH terms
- Phage Therapy, Anti-Bacterial Agents, Bacteriophages, Humans, Microbial Sensitivity Tests, Pseudomonas aeruginosa, Pseudomonas Infections, Pseudomonas Phages, Biofilms, Drug Resistance, Multiple, Bacterial, Host Specificity
About these checks
Registry, retraction, Cites and statistics results are computed, not judged, with one exception: a printed reference that no index lists is read once by a model before it counts as a citation error. Claims are extracted by a model and kept only when their quote appears verbatim in the text; each cited source is then checked, with a model’s help, for whether it says what the claim relies on. Those verdicts can be wrong — read the claim’s quote and the cited source before relying on one.
Statistics and arithmetic are recomputed, not judged.
Confidence bands are shown only for fields calibrated on our annotated test set. None is calibrated yet, so no band is shown.
What counts as a claim ›How we measure confidence ›How we check this ›
Are you an author, or do you see a problem with this page? Request a review
How to cite
Cite CoChat for the checks on this page, and the paper for its own findings.
- This page
- CoChat. (2026). Citation check: Targeting Pseudomonas aeruginosa biofilm with an evolutionary trained bacteriophage cocktail exploiting phage resistance trade-offs. https://app.cochat.ai/papers/10.1038/s41467-024-52595-w
- The paper
- Kunisch, F., Campobasso, C., Wagemans, J., Yildirim, S., Chan, B. K., Schaudinn, C., Lavigne, R., Turner, P. E., Raschke, M. J., Trampuz, A., & Gonzalez Moreno, M. (2024). Targeting Pseudomonas aeruginosa biofilm with an evolutionary trained bacteriophage cocktail exploiting phage resistance trade-offs. Nature Communications. https://doi.org/10.1038/s41467-024-52595-w
