Cited by 8Bacterial Genetics and BiotechnologyStreptococcal Infections and TreatmentsCancer, Lipids, and Metabolism

The DOI matches its Crossref record; 3 of the 3 references it cites were found in a registry or an index.

The double-edged role of FASII regulator FabT in Streptococcus pyogenes infection

Open access

Published version of a preprint

Abstract

Abstract In Streptococcus pyogenes , the type II fatty acid (FA) synthesis pathway FASII is feedback- controlled by the FabT repressor bound to an acyl-Acyl carrier protein. Despite FabT defects being linked to reduced virulence in animal models, spontaneous fabT mutants arise in vivo . To resolve this paradox, we characterized the conditions and mechanisms that require FabT activity, and those that promote fabT mutant emergence. The primary fabT mutant defect is energy dissipation: specific nutrients are consumed, but the mutant fails to grow on human tissue, cells, or cell filtrates where nutrients are limited. These features explain the FabT requirement during infection. Conversely, fabT mutants exhibited a marked growth advantage over the wild-type in biotopes rich in saturated FAs. fabT mutants emerge in this context, where continued FASII activity prevented environmental FA incorporation. An ex vivo muscle model demonstrated that wild-type S. pyogenes was inhibited, while fabT mutant growth was stimulated, but conditional to FASII activity. Our findings elucidate the rationale for emerging fabT mutants that improve survival in lipid-rich biotopes, but lead to a genetic impasse for infection.

Overview

The claims and statistics of this paper haven’t been checked yet.

Run the check — free, no account needed. It reads the open-access text and checks the sources it cites.

A few free checks a day · papers already verified open instantly · results are public

Integrity signals

Registry

Crossref · 10.1038/s41467-024-52637-3

Cites

3 of 3 references verified0 citation errors · 0 not checkable

Statistics

Figures

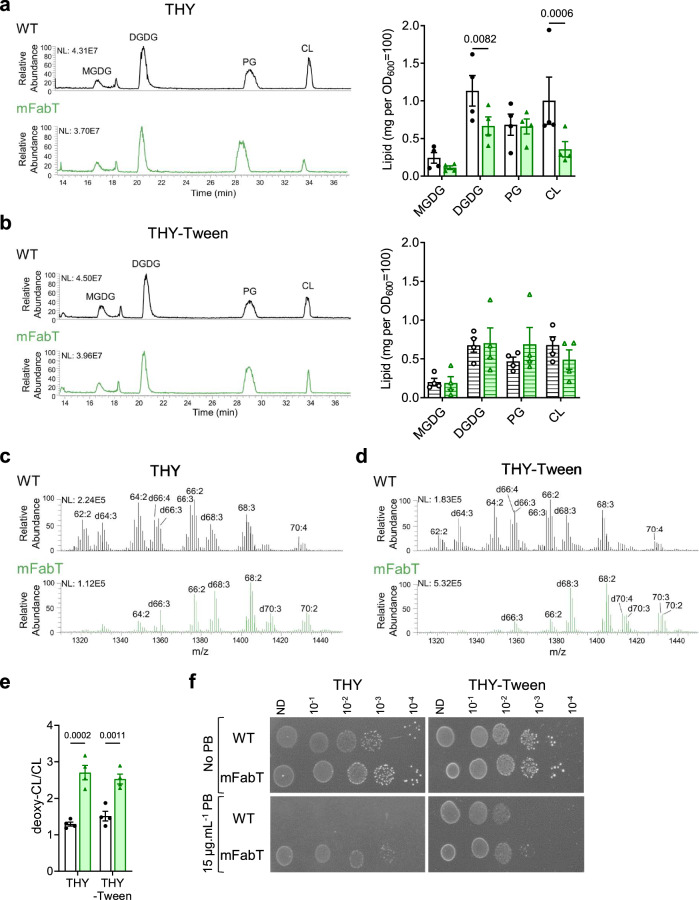
Fig. 1 FA differences in WT and mFabT strains impact lipid content and composition. a, b HPLC-MS profiles represent the main lipid classes in WT and mFabT grown in indicated media to OD600 = 0.5; lipid profiles and quantifications by class. Lipid concentrations correspond to milligrams extracted from OD600 = 100 equivalents. MGDG, monoglucosyldiacylglycerol; DGDG, diglucosyldiacylglycerol; PG, phosphatidylglycerol; CL, cardiolipin (Supplementary Table 3). c, d, e CL species in WT and mFabT, showing putative deoxidized cardiolipin species (deoxy-CL, designated by a ‘d’ preceding acyl chain features; see Supplementary Table 2); a, b, N = 4, c, d, N = 3, where N corresponds to the number of extractions from independent samples used to identify the lipid species. e Represents proportions of CL and putative deoxy CL in WT and mFabT, as presented in (c, d). a, b, e 2-way ANOVA, Bonferroni post-test. a, b, e Data are presented as mean values +/- SEM. a–d NL, normalization level. Significant p-values are shown. WT, white bars; mFabT, green bars. Hatched bars indicate that culture medium contained Tween 80. f Polymyxin B sensitivity. WT and mFabT were precultured to OD600 = 0.5 in THY or THY-Tween and dilutions were spotted on the same respective solid medium supplemented or not with polymyxin B (PB). Plates are representative of 3 independent experiments. Source data for a, b, and e, are provided as a Source Data file.
Fig. 1 FA differences in WT and mFabT strains impact lipid content and composition. a, b HPLC-MS profiles represent the main lipid classes in WT and mFabT grown in indicated media to OD600 = 0.5; lipid profiles and quantifications by class. Lipid concentrations correspond to milligrams extracted from OD600 = 100 equivalents. MGDG, monoglucosyldiacylglycerol; DGDG, diglucosyldiacylglycerol; PG, phosphatidylglycerol; CL, cardiolipin (Supplementary Table 3). c, d, e CL species in WT and mFabT, showing putative deoxidized cardiolipin species (deoxy-CL, designated by a ‘d’ preceding acyl chain features; see Supplementary Table 2); a, b, N = 4, c, d, N = 3, where N corresponds to the number of extractions from independent samples used to identify the lipid species. e Represents proportions of CL and putative deoxy CL in WT and mFabT, as presented in (c, d). a, b, e 2-way ANOVA, Bonferroni post-test. a, b, e Data are presented as mean values +/- SEM. a–d NL, normalization level. Significant p-values are shown. WT, white bars; mFabT, green bars. Hatched bars indicate that culture medium contained Tween 80. f Polymyxin B sensitivity. WT and mFabT were precultured to OD600 = 0.5 in THY or THY-Tween and dilutions were spotted on the same respective solid medium supplemented or not with polymyxin B (PB). Plates are representative of 3 independent experiments. Source data for a, b, and e, are provided as a Source Data file.CC BY-NC-ND · PubMed Central
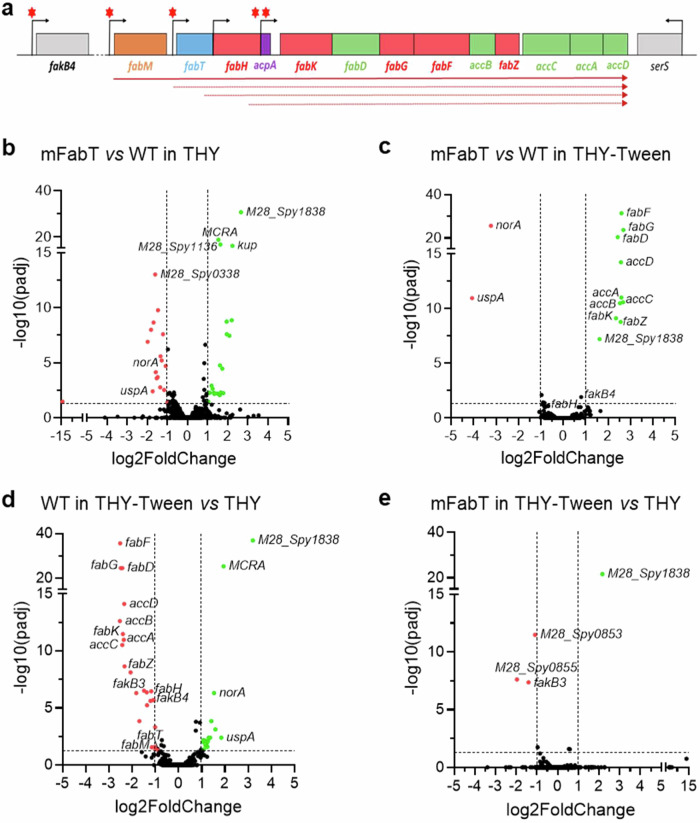
Fig. 2 FabT regulon in the presence of eFAs and genetic organization of the GAS FASII genes. a Schematic representation of the GAS FabT regulon, comprising genes of the FASII locus and fakB4. Gene positions with names below are represented. Red asterisks, putative FabT binding sites3; bent arrows, transcription start sites; solid arrow, transcript defined by RT-PCRs; dotted arrows, transcripts from previously reported start sites19. b–e Volcano plots of differentially expressed genes, compared as indicated. See Supplementary Table 4 for a complete list. Volcano plots were constructed using GraphPad Prism, by plotting the negative base 10 logarithm of the p-value on the y axis, and the log of the fold change (base 2) on the x axis. P-values for comparisons of peak intensities were calculated by two-sided T-test. Statistical significance was validated by the one-sided Wald test. Padj: calculated p-values were adjusted for multiple testing using the false discovery rate controlling procedure (see Methods section). Gene expression was considered modified in a given condition when the absolute value of log2-Foldchange (FC) was greater than or equal to 1, with an adjusted p-value ≤ 0.05. Data points with low p-values (highly significant) appear at the top of the plot. Source data for b, c, d, and e are provided as a Source Data file.
Fig. 2 FabT regulon in the presence of eFAs and genetic organization of the GAS FASII genes. a Schematic representation of the GAS FabT regulon, comprising genes of the FASII locus and fakB4. Gene positions with names below are represented. Red asterisks, putative FabT binding sites3; bent arrows, transcription start sites; solid arrow, transcript defined by RT-PCRs; dotted arrows, transcripts from previously reported start sites19. b–e Volcano plots of differentially expressed genes, compared as indicated. See Supplementary Table 4 for a complete list. Volcano plots were constructed using GraphPad Prism, by plotting the negative base 10 logarithm of the p-value on the y axis, and the log of the fold change (base 2) on the x axis. P-values for comparisons of peak intensities were calculated by two-sided T-test. Statistical significance was validated by the one-sided Wald test. Padj: calculated p-values were adjusted for multiple testing using the false discovery rate controlling procedure (see Methods section). Gene expression was considered modified in a given condition when the absolute value of log2-Foldchange (FC) was greater than or equal to 1, with an adjusted p-value ≤ 0.05. Data points with low p-values (highly significant) appear at the top of the plot. Source data for b, c, d, and e are provided as a Source Data file.CC BY-NC-ND · PubMed Central
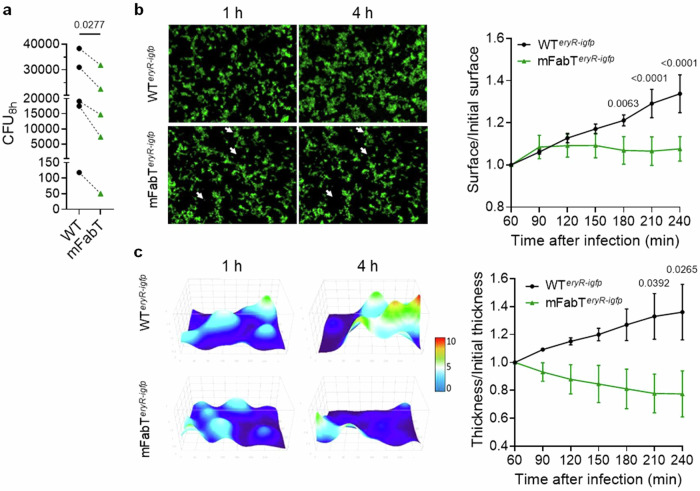
Fig. 3 The mFabT strain grows poorly on human tissue ex vivo. a Comparison of GAS WT and mFabT cfus after 8 h growth in static conditions in the presence of human decidua tissue. Bacterial multiplication at the tissue surface in flow conditions (live imaging); b left, Visualization of WTeryR-igfp and mFabTeryR-igfp multiplication in 2D. Poor mFabT growth led to nearly identical images at 1 and 4 h, with some differences highlighted by white arrowheads; right, ratios over time of areas covered by the two strains. c left, 3D-surface heat map of bacterial layer thickness at 1 and 4 h. The x, y, and z axes are scaled, color code in µm; right, ratios over time of bacterial layer mean thickness of WTeryR-igfp and mFabTeryR-igfp strains on decidual tissue. Determinations were based on N = 5 for (a), N = 3 for (b, c), where N corresponds to the number of independent biological replicates performed per condition. For b and c, representative results are shown, and data are presented as mean values +/- SEM. Statistical analyses were done for (a), by a two-sided T test; for (b) and (c), by 2-way ANOVA, Bonferroni post-test. Significant p-values are shown. WT, black symbols or lines; mFabT, green symbols or lines. Source data for (a), (b), and (c) are provided as a Source Data file.
Fig. 3 The mFabT strain grows poorly on human tissue ex vivo. a Comparison of GAS WT and mFabT cfus after 8 h growth in static conditions in the presence of human decidua tissue. Bacterial multiplication at the tissue surface in flow conditions (live imaging); b left, Visualization of WTeryR-igfp and mFabTeryR-igfp multiplication in 2D. Poor mFabT growth led to nearly identical images at 1 and 4 h, with some differences highlighted by white arrowheads; right, ratios over time of areas covered by the two strains. c left, 3D-surface heat map of bacterial layer thickness at 1 and 4 h. The x, y, and z axes are scaled, color code in µm; right, ratios over time of bacterial layer mean thickness of WTeryR-igfp and mFabTeryR-igfp strains on decidual tissue. Determinations were based on N = 5 for (a), N = 3 for (b, c), where N corresponds to the number of independent biological replicates performed per condition. For b and c, representative results are shown, and data are presented as mean values +/- SEM. Statistical analyses were done for (a), by a two-sided T test; for (b) and (c), by 2-way ANOVA, Bonferroni post-test. Significant p-values are shown. WT, black symbols or lines; mFabT, green symbols or lines. Source data for (a), (b), and (c) are provided as a Source Data file.CC BY-NC-ND · PubMed Central
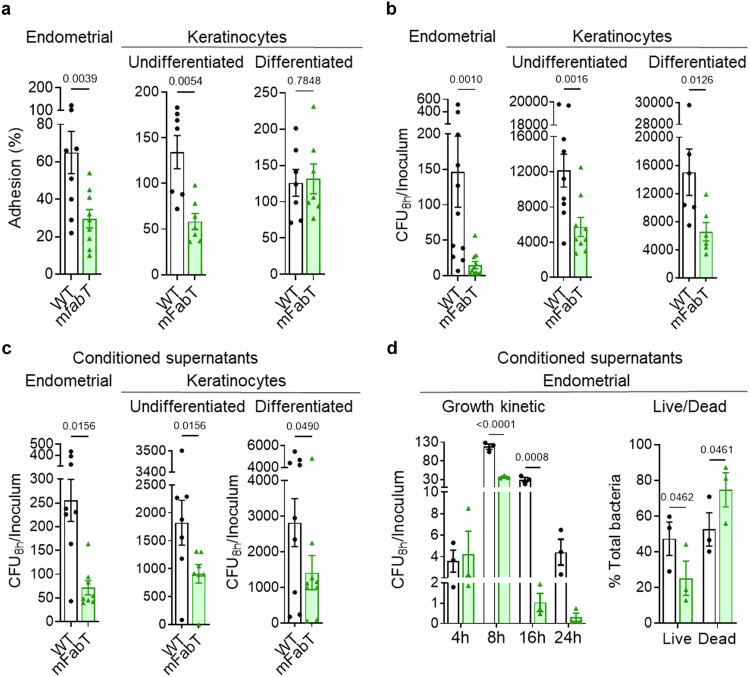
Fig. 4 The mFabT strain displays adhesion and growth defects in the presence of human cells or in conditioned cell supernatant. a–d Comparison of WT and mFabT strain adhesion and growth capacities in the presence of human cells, or conditioned supernatants. Endometrial cells, undifferentiated keratinocytes, and differentiated keratinocytes, and their respective conditioned supernatants were used as specified. a Adhesion; b, c, growth (cfu.mL−1). d, left, Bacterial growth kinetics in endometrial conditioned supernatants; right, Live/Dead bacteria assessment after 8 h growth in conditioned supernatants. Growth experiments were started with 103 bacteria per ml. Determinations were based on N = 9, 7, 7 for a (left to right), N = 11, 9, 6 for (b) (left to right), N = 8, 7, 9 for (c) (left to right), and N = 3 for (d). In each case N corresponds to the number of independent biological replicates performed per condition. Analyses were done as follows: a, b Wilcoxon test for endometrial samples, two-sided T-test for keratinocytes; c Wilcoxon test for endometrial cells and undifferentiated keratinocytes, two-sided T-test for differentiated keratinocytes; d 2-way ANOVA, Bonferroni post-test. Significant p-values are shown. a–c Outliers were searched using ROUT method (GraphPad), with Q = 1%. All graphs are presented as mean values +/- SEM. WT, white bars; mFabT, green bars. Source data for (a), (b), (c), and (d) are provided as a Source Data file.
Fig. 4 The mFabT strain displays adhesion and growth defects in the presence of human cells or in conditioned cell supernatant. a–d Comparison of WT and mFabT strain adhesion and growth capacities in the presence of human cells, or conditioned supernatants. Endometrial cells, undifferentiated keratinocytes, and differentiated keratinocytes, and their respective conditioned supernatants were used as specified. a Adhesion; b, c, growth (cfu.mL−1). d, left, Bacterial growth kinetics in endometrial conditioned supernatants; right, Live/Dead bacteria assessment after 8 h growth in conditioned supernatants. Growth experiments were started with 103 bacteria per ml. Determinations were based on N = 9, 7, 7 for a (left to right), N = 11, 9, 6 for (b) (left to right), N = 8, 7, 9 for (c) (left to right), and N = 3 for (d). In each case N corresponds to the number of independent biological replicates performed per condition. Analyses were done as follows: a, b Wilcoxon test for endometrial samples, two-sided T-test for keratinocytes; c Wilcoxon test for endometrial cells and undifferentiated keratinocytes, two-sided T-test for differentiated keratinocytes; d 2-way ANOVA, Bonferroni post-test. Significant p-values are shown. a–c Outliers were searched using ROUT method (GraphPad), with Q = 1%. All graphs are presented as mean values +/- SEM. WT, white bars; mFabT, green bars. Source data for (a), (b), (c), and (d) are provided as a Source Data file.CC BY-NC-ND · PubMed Central
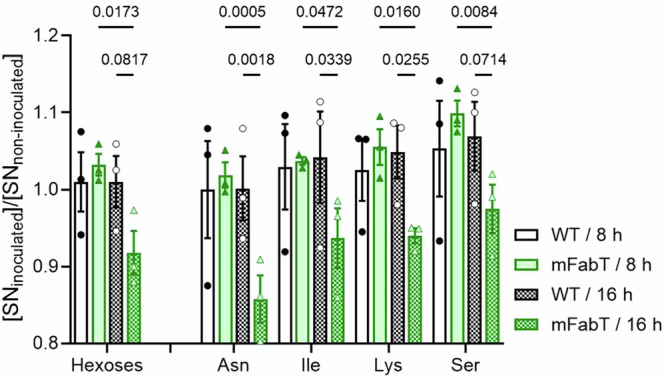
Fig. 5 The mFabT strain is more energy-consuming than the WT strain. Metabolomic analysis of conditioned supernatants inoculated with WT or mFabT after 8 or 16 h incubation. Carbohydrate and amino acid consumption by the two strains are compared (see Supplementary Fig. 5 for metabolite levels in noninfected samples, and Supplementary Table 5 for further amino acid results). N = 3, 2-way ANOVA, Bonferroni post-test; Significant p-values are shown. Strains and growth times are at right.
Fig. 5 The mFabT strain is more energy-consuming than the WT strain. Metabolomic analysis of conditioned supernatants inoculated with WT or mFabT after 8 or 16 h incubation. Carbohydrate and amino acid consumption by the two strains are compared (see Supplementary Fig. 5 for metabolite levels in noninfected samples, and Supplementary Table 5 for further amino acid results). N = 3, 2-way ANOVA, Bonferroni post-test; Significant p-values are shown. Strains and growth times are at right.CC BY-NC-ND · PubMed Central
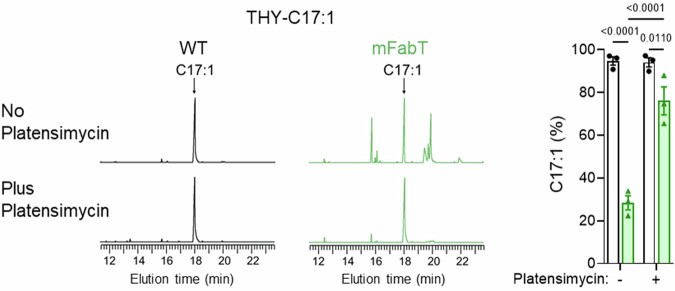
Fig. 6 Continued FASII activity in the mFabT mutant leads to lower eFA incorporation. Membrane FA profiles were compared in WT and mFabT strains grown in THY-C17:1 (100 µM), containing or not the FASII-inhibitor platensimycin (1 µg/mL−1). Left, Representative FA profiles; right, quantified proportions of major FAs. Both strains grew in C17:1 regardless of the presence of platensimycin (Supplementary Table 6). N = 3, where N corresponds to the number of independent biological replicates used in analyses. Data are presented as mean values +/- SEM; 2-way ANOVA, Bonferroni post-test was performed. Significant p-values are shown. WT (black lines, white bars) and mFabT (green lines and bars). Source data are provided as a Source Data file.
Fig. 6 Continued FASII activity in the mFabT mutant leads to lower eFA incorporation. Membrane FA profiles were compared in WT and mFabT strains grown in THY-C17:1 (100 µM), containing or not the FASII-inhibitor platensimycin (1 µg/mL−1). Left, Representative FA profiles; right, quantified proportions of major FAs. Both strains grew in C17:1 regardless of the presence of platensimycin (Supplementary Table 6). N = 3, where N corresponds to the number of independent biological replicates used in analyses. Data are presented as mean values +/- SEM; 2-way ANOVA, Bonferroni post-test was performed. Significant p-values are shown. WT (black lines, white bars) and mFabT (green lines and bars). Source data are provided as a Source Data file.CC BY-NC-ND · PubMed Central
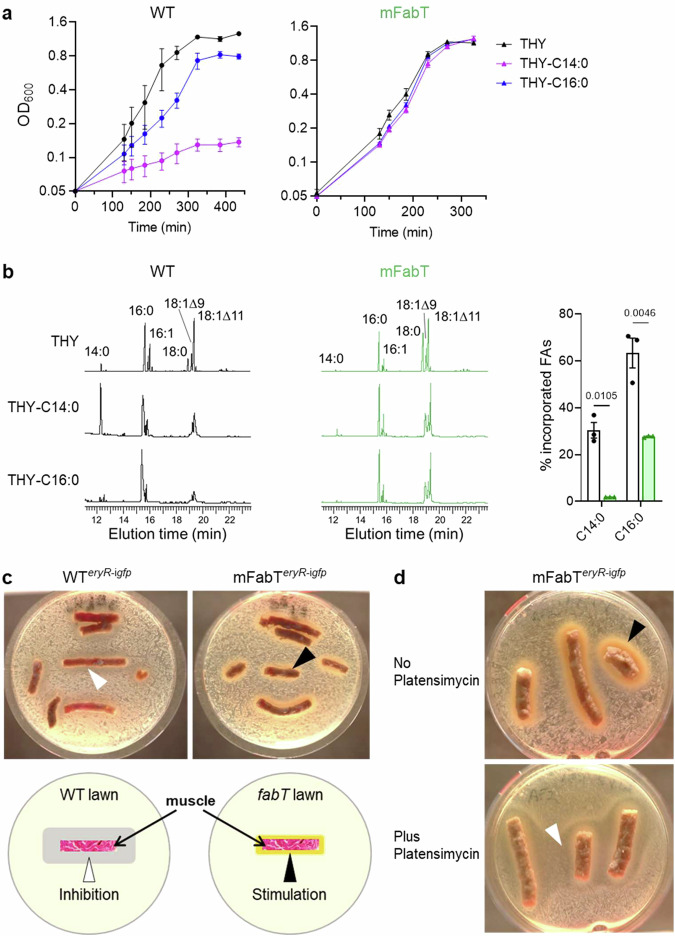
Fig. 7 The eFA incorporation defect of mFabT confers a selective advantage in saturated eFA environments, and in a simulated muscle biotope. a Growth of WT (left), and mFabT (right) in THY supplemented with 100 μM saturated FAs, C14:0 or C16:0 and BSA 0.025%. b, Left, Incorporation of exogenous C14:0 and C16:0 from cultures described in (a). Right, Percent C14:0 and C16:0 incorporation from growth experiments. In (a) and (b), data are presented as mean values +/- SEM based on 3 biological replicates; b 2-way ANOVA, Bonferroni post-test. Significant p-values are shown. WT (black lines, white bars) and mFabT (green lines and bars). c, d Strains were spread on solid BHI medium. Pellets of organic ground bovine meat (~15% fat), used as muscle source, were placed on the bacterial lawns. Plates were photographed 36 h after incubation at 37 °C. Arrowheads indicate zones of inhibition (white) or growth (black) around muscle sources. c, Upper WTeryR-igfp and mFabTeryR-igfp strains were grown in BHI Ery 5, and plated on the same solid medium. Lower, schematic representation of GAS strain growth inhibition and stimulation by muscle. d mFabTeryR-igfp was grown in BHI Ery 5 medium containing C17:1 as FA source, without or with platensimycin to turn off FASII. Cultures were then plated on respectively the same solid medium. For c and d, N = 4 and N = 2 respectively, corresponding to biologically independent experiments. Source data for (a) and (b) are provided as a Source Data file.
Fig. 7 The eFA incorporation defect of mFabT confers a selective advantage in saturated eFA environments, and in a simulated muscle biotope. a Growth of WT (left), and mFabT (right) in THY supplemented with 100 μM saturated FAs, C14:0 or C16:0 and BSA 0.025%. b, Left, Incorporation of exogenous C14:0 and C16:0 from cultures described in (a). Right, Percent C14:0 and C16:0 incorporation from growth experiments. In (a) and (b), data are presented as mean values +/- SEM based on 3 biological replicates; b 2-way ANOVA, Bonferroni post-test. Significant p-values are shown. WT (black lines, white bars) and mFabT (green lines and bars). c, d Strains were spread on solid BHI medium. Pellets of organic ground bovine meat (~15% fat), used as muscle source, were placed on the bacterial lawns. Plates were photographed 36 h after incubation at 37 °C. Arrowheads indicate zones of inhibition (white) or growth (black) around muscle sources. c, Upper WTeryR-igfp and mFabTeryR-igfp strains were grown in BHI Ery 5, and plated on the same solid medium. Lower, schematic representation of GAS strain growth inhibition and stimulation by muscle. d mFabTeryR-igfp was grown in BHI Ery 5 medium containing C17:1 as FA source, without or with platensimycin to turn off FASII. Cultures were then plated on respectively the same solid medium. For c and d, N = 4 and N = 2 respectively, corresponding to biologically independent experiments. Source data for (a) and (b) are provided as a Source Data file.CC BY-NC-ND · PubMed Central
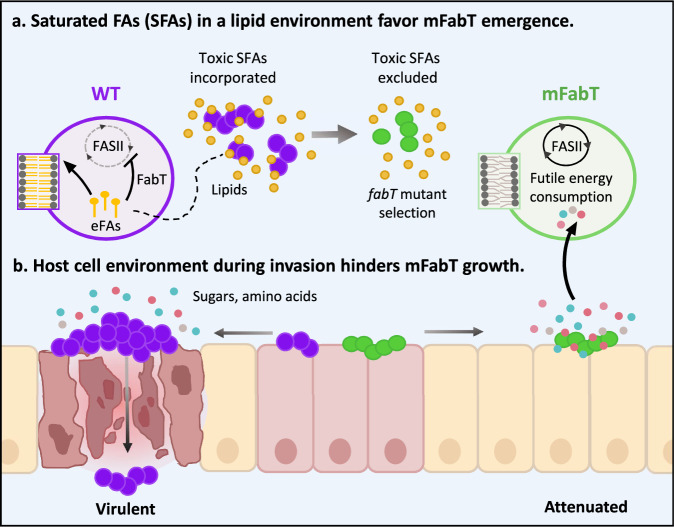
Fig. 8 Model for emergence of fabT mutants that are attenuated for virulence. a Saturated FAs (SFAs) in a lipid environment favor mFabT emergence. Toxic FAs may be present in initial GAS contacts with the host. Counter-selection would lead to emergence of FA-insensitive fabT mutants, conferring a growth advantage. In a proof of concept, we show that fabT mutants are selected in an SFA environment. b Host cell environment during invasion hinders mFabT growth. Compared to the WT, fabT mutant bacteria fail to develop and die more rapidly when exposed to human cells; they are also impaired for adhesion. Longer SFAs and continued FASII activity in fabT mutants provokes a state of futile bacterial metabolism where metabolite uptake is stimulated, but does not lead to improved growth. Thus, fabT mutants in GAS populations may confer a survival advantage at the inoculation site, but do not withstand host cell infection conditions. Mauve and green circles, WT and mFabT cocci; zoom is on phospholipids. Small yellow circles and lines, lipids and eFA hydrolysis products respectively, small red, blue, pink circles, sugars and amino acid residues.
Fig. 8 Model for emergence of fabT mutants that are attenuated for virulence. a Saturated FAs (SFAs) in a lipid environment favor mFabT emergence. Toxic FAs may be present in initial GAS contacts with the host. Counter-selection would lead to emergence of FA-insensitive fabT mutants, conferring a growth advantage. In a proof of concept, we show that fabT mutants are selected in an SFA environment. b Host cell environment during invasion hinders mFabT growth. Compared to the WT, fabT mutant bacteria fail to develop and die more rapidly when exposed to human cells; they are also impaired for adhesion. Longer SFAs and continued FASII activity in fabT mutants provokes a state of futile bacterial metabolism where metabolite uptake is stimulated, but does not lead to improved growth. Thus, fabT mutants in GAS populations may confer a survival advantage at the inoculation site, but do not withstand host cell infection conditions. Mauve and green circles, WT and mFabT cocci; zoom is on phospholipids. Small yellow circles and lines, lipids and eFA hydrolysis products respectively, small red, blue, pink circles, sugars and amino acid residues.CC BY-NC-ND · PubMed Central

Verification

Claims the paper makes

The claims and statistics of this paper haven’t been checked yet.

Run the check — free, no account needed. It reads the open-access text and checks the sources it cites.

A few free checks a day · papers already verified open instantly · results are public

Self-check

Percentages, sums and reported differences re-computed from the paper’s own numbers.

The self-check needs the paper’s full text.

Citations

Cites

Research works printed but not linked: 45

  1. Jerga, A. & Rock, C. O. Acyl-Acyl carrier protein regulates transcription of fatty acid biosynthetic genes via the FabT repressor in Streptococcus pneumoniae. J. Biol. Chem. 284, 15364–15368 (2009). · DOI
  2. Lambert, C. et al. Acyl-AcpB, a FabT corepressor in Streptococcus pyogenes. J. Bacteriol. 205, e0027423 (2023). · DOI
  3. Lambert, C., Poyart, C., Gruss, A. & Fouet, A. FabT, a bacterial transcriptional repressor that limits futile fatty acid biosynthesis. Microbiol. Mol. Biol. Rev. 86, e0002922 (2022). · DOI
  4. Zou, Q., Zhu, L. & Cronan, J. E. The Enterococcus faecalis FabT transcription factor regulates fatty acid synthesis in response to exogenous fatty acids. Front. Microbiol. 13, 877582 (2022). · DOI
  5. Eraso, J. M. et al. Genomic landscape of intrahost variation in group A Streptococcus: repeated and abundant mutational inactivation of the fabT gene encoding a regulator of fatty acid synthesis. Infect. Immun. 84, 3268–3281 (2016). · DOI
  6. Lu, Y. J. & Rock, C. O. Transcriptional regulation of fatty acid biosynthesis in Streptococcus pneumoniae. Mol. Microbiol. 59, 551–566 (2006). · DOI
  7. Eckhardt, T. H., Skotnicka, D., Kok, J. & Kuipers, O. P. Transcriptional regulation of fatty acid biosynthesis in Lactococcus lactis. J. Bacteriol. 195, 1081–1089 (2013). · DOI
  8. Faustoferri, R. C. et al. Regulation of fatty acid biosynthesis by the global regulator CcpA and the local regulator FabT in Streptococcus mutans. Mol. Oral. Microbiol 30, 128–146 (2015). · DOI
  9. Zhang, J. et al. Inactivation of transcriptional regulator FabT influences colony phase variation of Streptococcus pneumoniae. mBio 12, e0130421 (2021). · DOI
  10. Carapetis, J. R., Steer, A. C., Mulholland, E. K. & Weber, M. The global burden of group A streptococcal diseases. Lancet Infect. Dis. 5, 685–694 (2005). · DOI
  11. Tatsuno, I. et al. Relevance of spontaneous fabT mutations to a streptococcal toxic shock syndrome to non-streptococcal toxic shock syndrome transition in the novel-type Streptococcus pyogenes isolates that lost a salRK. APMIS 124, 414–424 (2016). · DOI
  12. Longo, M. et al. Complete genome sequence of Streptococcus pyogenes emm28 clinical isolate M28PF1, responsible for a puerperal fever. Genome Announc. 3, https://doi.org/10.1128/genomeA.00750-15 (2015). · DOI
  13. Lambert, C. et al. A Streptococcus pyogenes DegV protein regulates the membrane lipid content and limits the formation of extracellular vesicles. PLoS ONE 18, e0284402 (2023). · DOI
  14. Zuo, G. et al. Structural insights into repression of the Pneumococcal fatty acid synthesis pathway by repressor FabT and co-repressor acyl-ACP. FEBS Lett. 593, 2730–2741 (2019). · DOI
  15. Haines, T. H. & Dencher, N. A. Cardiolipin: a proton trap for oxidative phosphorylation. FEBS Lett. 528, 35–39 (2002). · DOI
  16. Port, G. C., Vega, L. A., Nylander, A. B. & Caparon, M. G. Streptococcus pyogenes polymyxin B-resistant mutants display enhanced ExPortal integrity. J. Bacteriol. 196, 2563–2577 (2014). · DOI
  17. Teuber, M. & Miller, I. R. Selective binding of polymyxin B to negatively charged lipid monolayers. Biochim Biophys. Acta 467, 280–289 (1977). · DOI
  18. Rosinski-Chupin, I., Sauvage, E., Fouet, A., Poyart, C. & Glaser, P. Conserved and specific features of Streptococcus pyogenes and Streptococcus agalactiae transcriptional landscapes. BMC Genomics 20, 236 (2019). · DOI
  19. Zhu, L. et al. Contribution of Secreted NADase and Streptolysin O to the Pathogenesis of Epidemic Serotype M1 Streptococcus pyogenes Infections. Am. J. Pathol. 187, 605–613 (2017). · DOI
  20. Green, N. M. et al. Genome sequence of a serotype M28 strain of group a streptococcus: potential new insights into puerperal sepsis and bacterial disease specificity. J. Infect. Dis. 192, 760–770 (2005). · DOI
  21. Plainvert, C. et al. Invasive group A streptococcal infections in adults, France (2006–2010). Clin. Microbiol Infect. 18, 702–710 (2012). · DOI
  22. Weckel, A. et al. Streptococcus pyogenes infects human endometrium by limiting the innate immune response. J. Clin. Invest. 131, https://doi.org/10.1172/JCI130746 (2021). · DOI
  23. Vadia, S. et al. Fatty acid availability sets cell envelope capacity and dictates microbial cell size. Curr. Biol. 27, 1757–1767 e1755 (2017). · DOI
  24. Wang, J. et al. Platensimycin is a selective FabF inhibitor with potent antibiotic properties. Nature 441, 358–361 (2006). · DOI
  25. Thormar, H. & Hilmarsson, H. The role of microbicidal lipids in host defense against pathogens and their potential as therapeutic agents. Chem. Phys. Lipids 150, 1–11 (2007). · DOI
  26. Ni Raghallaigh, S., Bender, K., Lacey, N., Brennan, L. & Powell, F. C. The fatty acid profile of the skin surface lipid layer in papulopustular rosacea. Br. J. Dermatol. 166, 279–287 (2012). · DOI · Paper page
  27. Tsujii, H., Matsuoka, Y., Obata, R., Hossain, M. S. & Takagi, Y. Fatty acid composition of lipids in day 7-13 blastocysts, serum and uterine fluid of rabbits. Reprod. Med. Biol. 8, 107–112 (2009). · DOI
  28. Young, H. J., Jenkins, N. T., Zhao, Q. & McCully, K. K. Measurement of intramuscular fat by muscle echo intensity. Muscle Nerve 52, 963–971 (2015). · DOI
  29. Brinster, S. et al. Type II fatty acid synthesis is not a suitable antibiotic target for Gram-positive pathogens. Nature 458, 83–86 (2009). · DOI
  30. Kenanian, G. et al. Permissive fatty acid incorporation promotes Staphylococcal adaptation to FASII antibiotics in host environments. Cell Rep. 29, 3974–3982 e3974 (2019). · DOI
  31. Hays, C. et al. Type II fatty acid synthesis pathway and cyclopropane ring formation are dispensable during Enterococcus faecalis systemic infection. J. Bacteriol. 203, e0022121 (2021). · DOI
  32. Weckel, A. et al. The N-terminal domain of the R28 protein promotes emm28 group A Streptococcus adhesion to host cells via direct binding to three integrins. J. Biol. Chem. 293, 16006–16018 (2018). · DOI
  33. Six, A. et al. Srr2, a multifaceted adhesin expressed by ST-17 hypervirulent Group B Streptococcus involved in binding to both fibrinogen and plasminogen. Mol. Microbiol 97, 1209–1222 (2015). · DOI
  34. Pettersen, E. F. et al. UCSF ChimeraX: structure visualization for researchers, educators, and developers. Protein Sci. 30, 70–82 (2021). · DOI
  35. Abreu, S., Solgadi, A. & Chaminade, P. Optimization of normal phase chromatographic conditions for lipid analysis and comparison of associated detection techniques. J. Chromatogr. A 1514, 54–71 (2017). · DOI
  36. Thedieck, K. et al. The MprF protein is required for lysinylation of phospholipids in listerial membranes and confers resistance to cationic antimicrobial peptides (CAMPs) on Listeria monocytogenes. Mol. Microbiol. 62, 1325–1339 (2006). · DOI
  37. Moulin, M. et al. Sex-specific cardiac cardiolipin remodelling after doxorubicin treatment. Biol. Sex. Differ. 6, 20 (2015). · DOI
  38. Sud, M. et al. Metabolomics Workbench: an international repository for metabolomics data and metadata, metabolite standards, protocols, tutorials and training, and analysis tools. Nucleic Acids Res. 44, D463–470 (2016). · DOI
  39. Anders, S. et al. Count-based differential expression analysis of RNA sequencing data using R and Bioconductor. Nat. Protoc. 8, 1765–1786 (2013). · DOI
  40. Varet, H., Brillet-Gueguen, L., Coppee, J. Y. & Dillies, M. A. SARTools: A DESeq2- and EdgeR-Based R pipeline for comprehensive differential analysis of RNA-Seq data. PLoS ONE 11, e0157022 (2016). · DOI
  41. Benjamini, Y. & Hochberg, Y. Controlling the false discovery rate: a practical and powerful approach to multiple testing. J. R. Stat. Soc. Ser. B 57, 289–300 (1995). · DOI · Paper page
  42. Lex, A., Gehlenborg, N., Strobelt, H., Vuillemot, R. & Pfister, H. UpSet: visualization of intersecting sets. IEEE Trans. Vis. Comput Graph 20, 1983–1992 (2014). · DOI
  43. Conway, J. R., Lex, A. & Gehlenborg, N. UpSetR: an R package for the visualization of intersecting sets and their properties. Bioinformatics 33, 2938–2940 (2017). · DOI · Paper page
  44. Plainvert, C. et al. A novel CovS variant harbored by a colonization strain reduces Streptococcus pyogenes virulence. J. Bacteriol. e0003923, https://doi.org/10.1128/jb.00039-23 (2023). · DOI
  45. Marcellin, L. et al. Immune modifications in fetal membranes overlying the cervix precede parturition in humans. J. Immunol. 198, 1345–1356 (2017). · DOI

Metadata

Authors
Lambert, C., Gaillard, M., Wongdontree, P., Bachmann, C., Hautcoeur, A., Gloux, K., Guilbert, T., Méhats, C., Prost, B., Solgadi, A., Abreu, S., Andrieu, M., Poyart, C., Gruss, A., & Fouet, A.
Affiliations
  • Centre National de la Recherche Scientifique (FR)
  • AgroParisTech (FR)
  • Université Paris-Saclay (FR)
Corresponding author
Gruss, Alexandra
Venue
Nature Communications
Published
2024-10-04
Volume
15
Issue
1
Pages
8593-8593
ISSN
2041-1723 (ISSN-L)
OpenAlex
W4403135616
Cited by
8
References
3
Citations by year
2026: 5 · 2025: 1 · 2024: 1
FWCI
1.86
Type
journal article
Language
en
Open access
Locations
  • Nature Communications (publishedVersion, cc-by-nc-nd)
  • bioRxiv (Cold Spring Harbor Laboratory) (acceptedVersion)
  • PubMed Central (publishedVersion, cc-by-nc-nd)
  • PubMed (publishedVersion)
  • HAL (submittedVersion)
  • RePEc: Research Papers in Economics (submittedVersion)
  • DOAJ (DOAJ: Directory of Open Access Journals) (submittedVersion, cc-by-sa)
Funders
  • Agence Nationale de la Recherche (ANR-22-AAMR-0007, ANR‐10_INBS‐04, ANR-10, ANR-16-CE15-0013)
  • Fondation pour la Recherche Médicale (DBF20161136769, FDT202106012831)
Topics
  • Life Sciences › Biochemistry, Genetics and Molecular Biology › Genetics › Bacterial Genetics and Biotechnology
  • Health Sciences › Medicine › Infectious Diseases › Streptococcal Infections and Treatments
  • Life Sciences › Biochemistry, Genetics and Molecular Biology › Cancer Research › Cancer, Lipids, and Metabolism
Keywords
Streptococcus pyogenes, fatty acid synthesis regulation, acyl-acyl carrier protein, bacterial virulence, saturated fatty acids, energy dissipation, bacterial fitness
MeSH terms
Animals, Bacterial Proteins, Fatty Acids, Female, Humans, Mutation, Repressor Proteins, Streptococcal Infections, Streptococcus pyogenes, Virulence, Gene Expression Regulation, Bacterial, Mice, Fatty Acid Synthase, Type II

About these checks

Registry, retraction, Cites and statistics results are computed, not judged, with one exception: a printed reference that no index lists is read once by a model before it counts as a citation error. Claims are extracted by a model and kept only when their quote appears verbatim in the text; each cited source is then checked, with a model’s help, for whether it says what the claim relies on. Those verdicts can be wrong — read the claim’s quote and the cited source before relying on one.

Statistics and arithmetic are recomputed, not judged.

Confidence bands are shown only for fields calibrated on our annotated test set. None is calibrated yet, so no band is shown.

What counts as a claim ›How we measure confidence ›How we check this ›

Are you an author, or do you see a problem with this page? Request a review