

The DOI matches its Crossref record; the references it cites are not checked yet.
Evapotranspiration saturation amplifies climate sensitivity of terrestrial water yield
Open accessPublished version of a preprint
Abstract
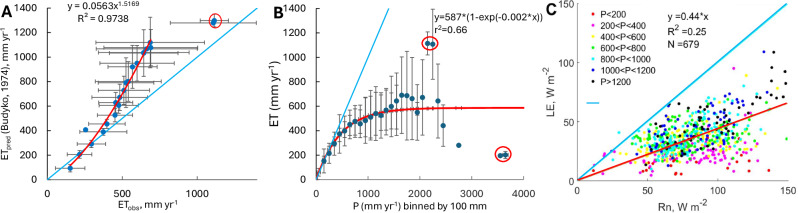
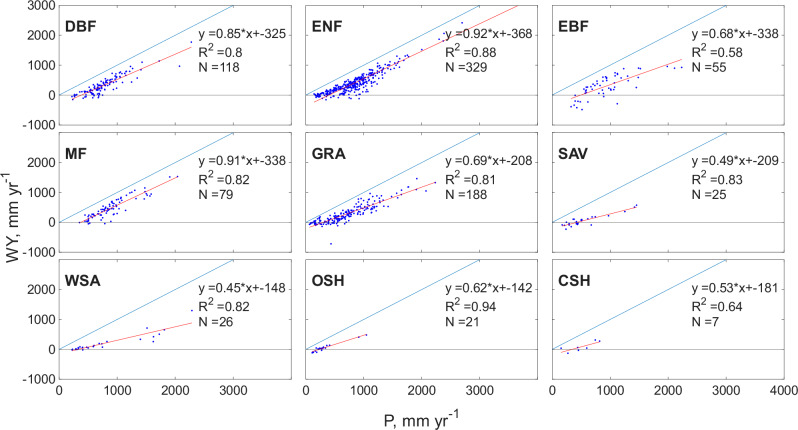
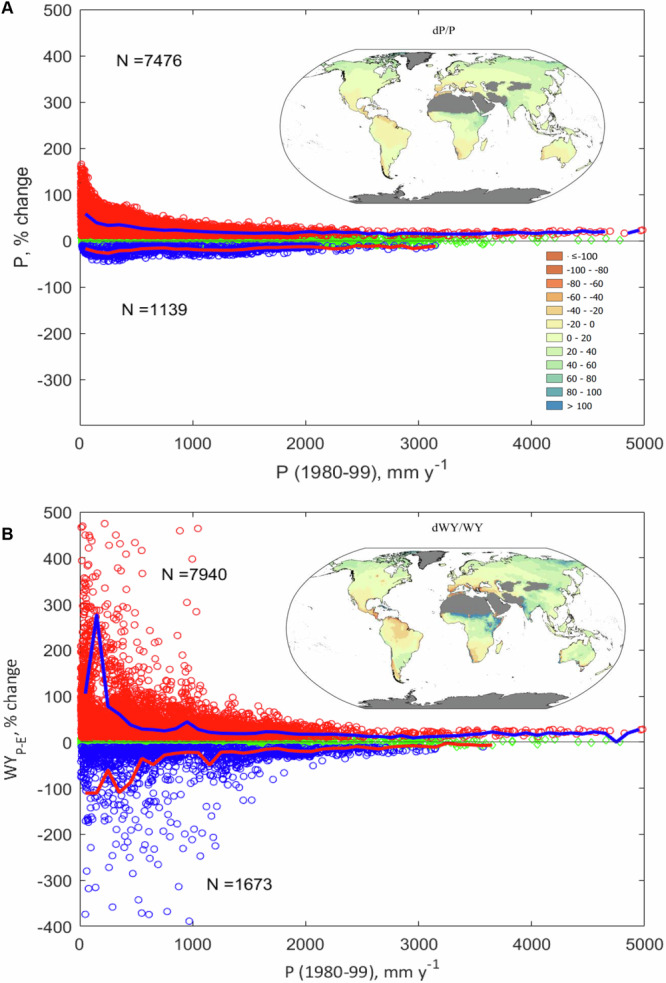
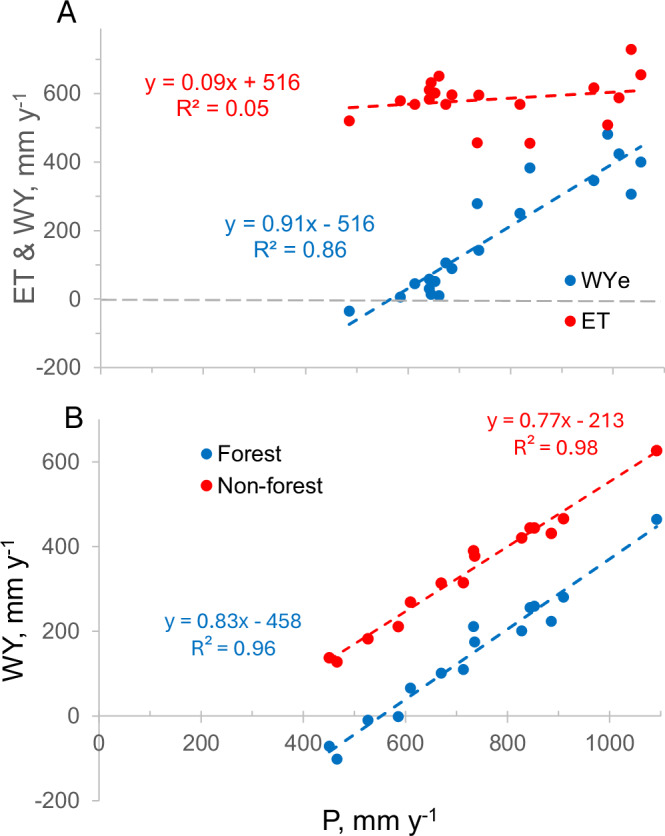
Abstract Predictions of climate change over land indicate drying trends in the form of ecological and agricultural droughts over many regions (1-6), and increased flooding in others (7). Globally, evapotranspiration (ET) from vegetated areas consumes about 63% of annual precipitation8, which is expected to increase with global warming (9,10), and can approach 100% in drylands (11) beyond which ecosystems are unsustainable. As global climate change progresses, it remains unknown what fraction of the precipitation will remain available for runoff, recharge of aquifers and consumption, or prevent ecosystems’ collapse in dry regions (7,12). Here, we show using a global dataset that evapotranspiration from ecosystems displays a conservative ‘saturation effect’ at ~460 mm across climates with a precipitation range of ~4000 mm. This implies that changes in precipitation are preferentially reflected in ecosystem water yield (WY; the residual between precipitation and evapotranspiration). Consequently, changes in WY are greatly enhanced compared with precipitation changes, both in observations and model-based future projections. In dry regions, ecosystems will reach the unsustainable state (negative WY) faster than expected based on predicted changes in precipitation alone, imposing land cover changes and impacting water availability for ecological and societal needs.
Overview
The claims and statistics of this paper haven’t been checked yet.
Run the check — free, no account needed. It reads the open-access text and checks the sources it cites.
Integrity signals
Registry
Cites
Statistics
Figures
Verification
Claims the paper makes
The claims and statistics of this paper haven’t been checked yet.
Run the check — free, no account needed. It reads the open-access text and checks the sources it cites.
Self-check
Percentages, sums and reported differences re-computed from the paper’s own numbers.
The self-check needs the paper’s full text.
Citations
The citation lists haven’t been fetched yet
References 97 · Cited by 15
Research works printed but not linked: 58
- Seneviratne, S. I. et al. Weather and Climate Extreme Events in a Changing Climate. In: Climate Change 2021: The Physical Science Basis. Contribution of Working Group I to the Sixth Assessment Report of the Intergovernmental Panel on Climate Change (ed Masson-Delmotte V., P. Zhai, A. Pirani, S. L. Connors, C. Péan, S. Berger, N. Caud, Y. Chen, L. Goldfarb, M. I. Gomis, M. Huang, K. Leitzell, E. Lonnoy, J. B. R. Matthews, T. K. Maycock, T. Waterfield, O. Yelekçi, R. Yu, and B. Zhou). Cambridge University Press (2021).
- Caretta, M. A. et al. Water. In: Climate Change 2022: Impacts, Adaptation and Vulnerability. Contribution of Working Group II to the Sixth Assessment Report of the Intergovernmental Panel on Climate Change (ed H. O. Pörtner D. C. R., M. Tignor, E. S. Poloczanska, K. Mintenbeck, A. Alegría, M. Craig, S. Langsdorf, S. Löschke, V. Möller, A. Okem, B. Rama). Cambridge University Press (2022).
- Yang, Y. T. et al. Evapotranspiration on a greening Earth. Nat. Rev. Earth Environ. 4, 626–641 (2023). · DOI
- Oki, T. & Kanae, S. Global hydrological cycles and world water resources. Science 313, 1068–1072 (2006). · DOI · Paper page
- Zhang, K. et al. A global dataset of terrestrial evapotranspiration and soil moisture dynamics from 1982 to 2020. Scientific Data 11, 445 (2024). · DOI
- Ellison, D., Futter, M. N. & Bishop, K. On the forest cover-water yield debate: from demand- to supply-side thinking. Glob. Change Biol. 18, 806–820 (2012). · DOI
- Fisher, J. B. et al. The future of evapotranspiration: Global requirements for ecosystem functioning, carbon and climate feedbacks, agricultural management, and water resources. Water Resour. Res. 53, 2618–2626 (2017). · DOI
- Bren, L., Lane, P. & McGuire, D. An empirical, comparative model of changes in annual water yield associated with pine plantations in southern Australia. Aust. Forestry 69, 275–284 (2006). · DOI
- Yang, H., Xu, H., Huntingford, C., Ciais, P. & Piao, S. Strong direct and indirect influences of climate change on water yield confirmed by the Budyko framework. Geogr. Sustainability 2, 281–287 (2021). · DOI
- Budyko, M. I. & Gerasimov, I. P. The heat and water-balance of the earths surface, the general-theory of physical-geography and the problem of the transformation of nature. Sov. Geogr. Rev. Transl. 2, 3–12 (1961).
- Zhang, L., Dawes, W. R. & Walker, G. R. Response of mean annual evapotranspiration to vegetation changes at catchment scale. Water Resour. Res. 37, 701–708 (2001). · DOI
- Bosch, J. M. & Hewlett, J. D. A review of catchment experiments to determine the effect of vegetation changes on water yield and evapo-transpiration. J. Hydrol. 55, 3–23 (1982). · DOI · Paper page
- Williams, C. A. et al. Climate and vegetation controls on the surface water balance: Synthesis of evapotranspiration measured across a global network of flux towers. Water Resources Res. 48, W06523 (2012). · DOI
- Baldocchi, D. Measuring fluxes of trace gases and energy between ecosystems and the atmosphere - the state and future of the eddy covariance method. Glob. Change Biol. 20, 3600–3609 (2014). · DOI
- Kool, D. et al. A review of approaches for evapotranspiration partitioning. Agric. Meteorol. 184, 56–70 (2014). · DOI
- Yaseef, R. az, Yakir, N., Rotenberg, D., Schiller, E. & Cohen, G. S. Ecohydrology of a semi-arid forest: partitioning among water balance components and its implications for predicted precipitation changes. Ecohydrology 3, 143–154 (2010). · DOI
- Stoy, P. C. et al. Reviews and syntheses: Turning the challenges of partitioning ecosystem evaporation and transpiration into opportunities. Biogeosciences 16, 3747–3775 (2019). · DOI
- Buckley, T. N. How do stomata respond to water status? N. Phytologist 224, 21–36 (2019). · DOI
- Grossiord, C. et al. Plant responses to rising vapor pressure deficit. N. Phytologist 226, 1550–1566 (2020). · DOI
- Massmann, A., Gentine, P. & Lin, C. J. When does vapor pressure deficit drive or reduce evapotranspiration? J. Adv. Modeling Earth Syst. 11, 3305–3320 (2019). · DOI
- Novick, K. A. et al. The increasing importance of atmospheric demand for ecosystem water and carbon fluxes. Nat. Clim. Change 6, 1023–1027 (2016). · DOI
- Tenhunen, J. D., Lange, O. L., Gebel, J., Beyschlag, W. & Weber, J. A. Changes in photosynthetic capacity, carboxylation efficiency, and co2 compensation point associated with midday stomatal closure and midday depression of net co2 exchange of leaves of quercus-suber. Planta 162, 193–203 (1984). · DOI
- Banerjee, T. et al. Turbulent transport of energy across a forest and a semiarid shrubland. Atmos. Chem. Phys. 18, 10025–10038 (2018). · DOI
- Brugger, P. et al. Contrasting turbulent transport regimes explain cooling effect in a semi-arid forest compared to surrounding shrubland. Agric. Meteorol. 269, 19–27 (2019). · DOI
- Rotenberg, E. & Yakir, D. Distinct patterns of changes in surface energy budget associated with forestation in the semiarid region. Glob. Change Biol. 17, 1536–1548 (2011). · DOI
- Muller, J. D., Rotenberg, E., Tatarinov, F., Oz, I. & Yakir, D. Evidence for efficient nonevaporative leaf-to-air heat dissipation in a pine forest under drought conditions. N. Phytologist 232, 2254–2266 (2021). · DOI
- Muller J. D. et al. Detailed in situ leaf energy budget permits the assessment of leaf aerodynamic resistance as a key to enhance non-evaporative cooling under drought. Plant Cell Environ. 46, 3128–3143 (2022). · DOI
- Dusenge, M. E., Duarte, A. G. & Way, D. A. Plant carbon metabolism and climate change: elevated CO2 and temperature impacts on photosynthesis, photorespiration and respiration. N. Phytologist 221, 32–49 (2019). · DOI
- Yang, Y. T., Roderick, M. L., Zhang, S. L., McVicar, T. R. & Donohue, R. J. Hydrologic implications of vegetation response to elevated CO2 in climate projections. Nat. Clim. Change 9, 44 (2019). · DOI
- Asner, G. P., Scurlock, J. M. O. & Hicke, J. A. Global synthesis of leaf area index observations: implications for ecological and remote sensing studies. Glob. Ecol. Biogeogr. 12, 191–205 (2003). · DOI
- Xue, B.-L. et al. Global patterns, trends, and drivers of water useefficiency from 2000 to 2013. Ecosphere 6, 10:174 (2015). · DOI
- Chen, X. & Sivapalan, M. Hydrological basis of the Budyko curve: Data-guided exploration of the mediating role of soil moisture. Water Resour. 56, 10 (2020).
- Chen, Z. F., Wang, W. G., Cescatti, A. & Forzieri, G. Climate-driven vegetation greening further reduces water availability in drylands. Glob. Change Biol. 29, 1628–1647 (2023). · DOI
- Milly, P. C. D. Climate, soil-water storage, and the average annual water-balance. Water Resour. Res. 30, 2143–2156 (1994). · DOI
- Preisler, Y. et al. Mortality versus survival in drought-affected Aleppo pine forest depends on the extent of rock cover and soil stoniness. Funct. Ecol. 33, 901–912 (2019). · DOI
- Priestley, C. H. B. & Taylor, R. J. On the Assessment of Surface Heat Flux and Evaporation Using Large-Scale Parameter. Monthly weather Rev. 100, 81–92 (1971). · DOI
- Cowan, I. R. & Farquhar, G. D. Stomatal function in relation to leaf metabolism and environment. Symposium Society of Experimental Biology 31, 471–505 (1977).
- Farquhar, G. D., Sharkey, T. D. & Ehleringer, J. R. A biochemical model of photosynthetic CO₂ assimilation in leaves of C₃ species. Planta 149, 78–90 (1980). · DOI · Paper page
- Lloyd, J. & Farquhar, G. D. The CO₂ dependence of photosynthesis, plant growth responses to elevated atmospheric CO₂ concentrations and their interaction with soil nutrient status. Funct. Plant Biol. 23, 915–925 (1996).
- Medlyn, B. E. Reconciling the optimal and empirical approaches to modelling stomatal conductance. Glob. Change Biol. 17, 2134–2144 (2011). · DOI
- Still C. J. et al. No evidence of canopy-scale leaf thermoregulation to cool leaves below air temperature across a range of forest ecosystems. Proc. Natl. Acad. Sci. USA 119, e2205682119 (202). · DOI
- Beer, C. et al. Temporal and among-site variability of inherent water use efficiency at the ecosystem level. Global Biogeochemical Cycles 23, 1–13 (2009). · DOI
- Gentine, P. et al. Coupling between the terrestrial carbon and water cycles-a review. Environ. Res. Lett. 14, 8 (2019). · DOI
- Cooley, S. S., Fisher, J. B. & Goldsmith, G. R. Convergence in water use efficiency within plant functional types across contrasting climates. Nat. plants 8, 341–345 (2022). · DOI
- Mauder, M., Foken, T. & Cuxart, J. Surface-Energy-Balance Closure over Land: A Review. Bound. -Layer. Meteorol. 177, 395–426 (2020). · DOI
- Mauder M., Jung M., Stoy P., Nelson J. & Wanner L. Energy balance closure at FLUXNET sites revisited. Agric. Forest Meteorol. 358, 110235 (2024). · DOI
- Dohn, J. et al. Tree effects on grass growth in savannas: Competition, facilitation and the stress-gradient hypothesis. J. Ecol. 101, 202–209 (2013). · DOI
- Zhang, M. F. et al. A global review on hydrological responses to forest change across multiple spatial scales: Importance of scale, climate, forest type and hydrological regime. J. Hydrol. 546, 44–59 (2017). · DOI
- Knapp, A. K., Ciais, P. & Smith, M. D. Reconciling inconsistencies in precipitation-productivity relationships: implications for climate change. N. Phytologist 214, 41–47 (2017). · DOI
- Fan, Y., Li, H. & Miguez-Macho, G. Global patterns of groundwater table depth. Science 339, 940–943 (2013). · DOI
- Eyring, V. et al. Overview of the coupled model intercomparison project phase 6 (CMIP6) experimental design and organization. Geosci Model Dev. 9, 1937–1958 (2016). · DOI · Paper page
- Lemordant, L. & Gentine, P. Vegetation response to rising CO2 impacts extreme temperatures. Geophys. Res. Lett. 46, 1383–1392 (2019). · DOI
- Zarakas, C. M. et al. Plant physiology increases the magnitude and spread of the transient climate response to CO2 in CMIP6 earth system models. J. Clim. 33, 8561–8578 (2019). · DOI
- Huxman, T. E. et al. Convergence across biomes to a common rain-use efficiency. Nature 429, 651–654 (2004). · DOI
- Vicente-Serrano, S. M. et al. Evidence of increasing drought severity caused by temperature rise in southern Europe. Environ. Res. Lett. 9, 044001 (2014). · DOI
- Qubaja, R. et al. Partitioning evapotranspiration and its long-term evolution in a dry pine forest using measurement-based estimates of soil evaporation. Agric. Forest Meteorol. 281, 107831 (2020). · DOI
- Rohatyn, S. et al. Differential impacts of land use and precipitation on ‘ecosystem water yield’. Water Resources Res. 54, 5475–5470 (2018). · DOI
- Rohatyn, S. et al. Large variations in afforestation-related climate cooling and warming effects across short distances. Commun. Earth Environ. 4, 18 (2023). · DOI
Metadata
- Authors
- Rotenberg, E., Tatarinov, F., Muller, J. D., & Yakir, D.
- Affiliations
- Weizmann Institute of Science (IL)
- Stellenbosch University (ZA)
- Corresponding author
- Rotenberg, Eyal
- Yakir, Dan
- Venue
- Nature Communications
- Published
- 2025-11-23
- Volume
- 16
- Issue
- 1
- Pages
- 11577-11577
- ISSN
- 2041-1723 (ISSN-L)
- PMC
- PMC12749472
- OpenAlex
- W4416585883
- Cited by
- 15
- References
- 97
- Citations by year
- 2026: 14 · 2025: 1
- FWCI
- 3.81
- Type
- journal article
- Language
- en
- Open access
- gold
- doi.org
- Licence
- Locations
- Nature Communications (publishedVersion, cc-by-nc-nd)
- Research Square (acceptedVersion, cc-by)
- PubMed (publishedVersion)
- PubMed Central (publishedVersion, cc-by-nc-nd)
- DOAJ (DOAJ: Directory of Open Access Journals) (submittedVersion, cc-by-sa)
- Funders
- Israel Science Foundation (2481/22)
- Keren Kayemet LeIsrael (KKL) IES-Weizmann Institute of Science
- Topics
- Physical Sciences › Environmental Science › Water Science and Technology › Hydrology and Watershed Management Studies
- Physical Sciences › Environmental Science › Global and Planetary Change › Plant Water Relations and Carbon Dynamics
- Physical Sciences › Environmental Science › Global and Planetary Change › Hydrology and Drought Analysis
- Keywords
- climate sensitivity, rainfall variability, flood risk, ecosystem sustainability
About these checks
Registry, retraction, Cites and statistics results are computed, not judged, with one exception: a printed reference that no index lists is read once by a model before it counts as a citation error. Claims are extracted by a model and kept only when their quote appears verbatim in the text; each cited source is then checked, with a model’s help, for whether it says what the claim relies on. Those verdicts can be wrong — read the claim’s quote and the cited source before relying on one.
Statistics and arithmetic are recomputed, not judged.
Confidence bands are shown only for fields calibrated on our annotated test set. None is calibrated yet, so no band is shown.
What counts as a claim ›How we measure confidence ›How we check this ›
Are you an author, or do you see a problem with this page? Request a review
How to cite
Cite CoChat for the checks on this page, and the paper for its own findings.
- This page
- CoChat. (2026). Citation check: Evapotranspiration saturation amplifies climate sensitivity of terrestrial water yield. https://app.cochat.ai/papers/10.1038/s41467-025-66570-6
- The paper
- Rotenberg, E., Tatarinov, F., Muller, J. D., & Yakir, D. (2025). Evapotranspiration saturation amplifies climate sensitivity of terrestrial water yield. Nature Communications. https://doi.org/10.1038/s41467-025-66570-6
