

The DOI matches its Crossref record; 59 of the 59 references it cites were found in a registry or an index; none of the 9 sources its claims cite is checked for support yet.
Benchmarking foundation models as feature extractors for weakly supervised computational pathology
Open accessAbstract
Numerous pathology foundation models have been developed to extract clinically relevant information. There is currently limited literature independently evaluating these foundation models on external cohorts and clinically relevant tasks to uncover adjustments for future improvements. Here we benchmark 19 histopathology foundation models on 13 patient cohorts with 6,818 patients and 9,528 slides from lung, colorectal, gastric and breast cancers. The models were evaluated on weakly supervised tasks related to biomarkers, morphological properties and prognostic outcomes. We show that a vision-language foundation model, CONCH, yielded the highest overall performance when compared with vision-only foundation models, with Virchow2 as close second, although its superior performance was less pronounced in low-data scenarios and low-prevalence tasks. The experiments reveal that foundation models trained on distinct cohorts learn complementary features to predict the same label, and can be fused to outperform the current state of the art. An ensemble combining CONCH and Virchow2 predictions outperformed individual models in 55% of tasks, leveraging their complementary strengths in classification scenarios. Moreover, our findings suggest that data diversity outweighs data volume for foundation models.
Overview
CoChat Summary
TL;DR
This study benchmarks 19 histopathology foundation models and 14 ensembles on 31 weakly supervised tasks across 13 cohorts with 6,818 patients and 9,528 slides from lung, colorectal, gastric and breast cancers. CONCH and Virchow2 show the best overall performance, and ensembling complementary models improves predictions, while data diversity appears more important than data volume.
Key findings
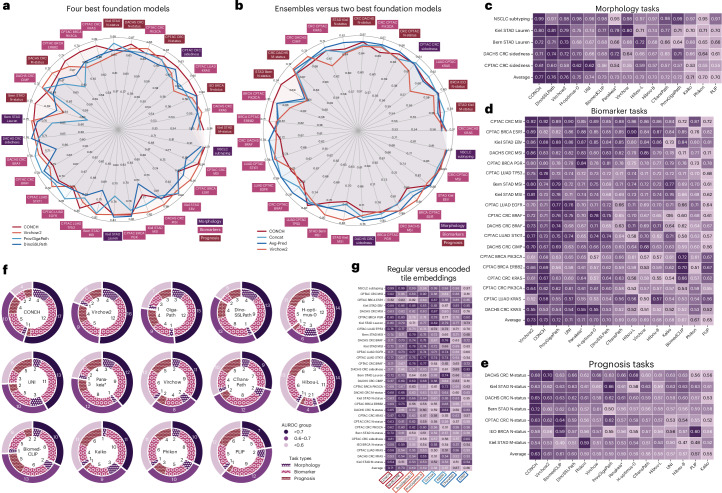
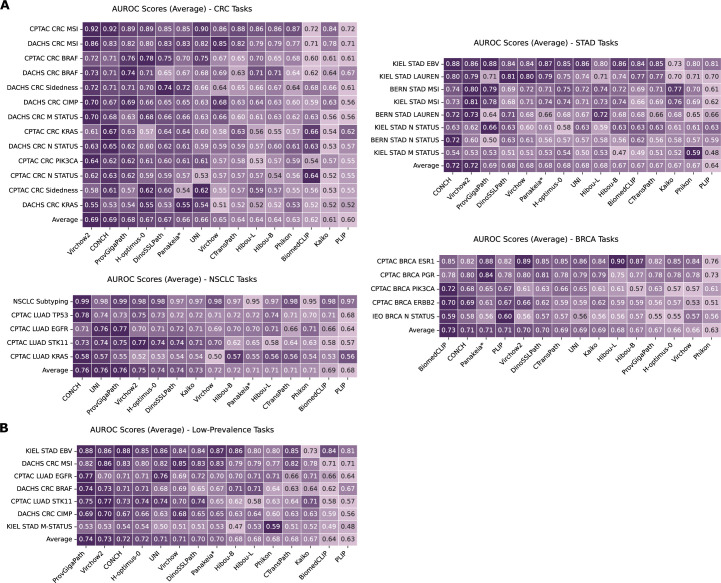
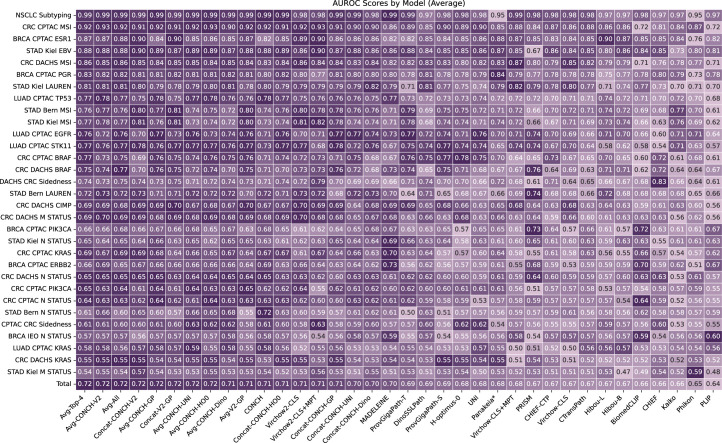
- Across all 31 tasks, CONCH and Virchow2 had the highest mean AUROCs of 0.71, followed by Prov-GigaPath and DinoSSLPath at 0.69. By task type: morphology—CONCH 0.77, Virchow2 and DinoSSLPath 0.76; biomarkers—Virchow2 and CONCH 0.73, Prov-GigaPath 0.72; prognosis—CONCH 0.63, Virchow2 and BiomedCLIP 0.61.
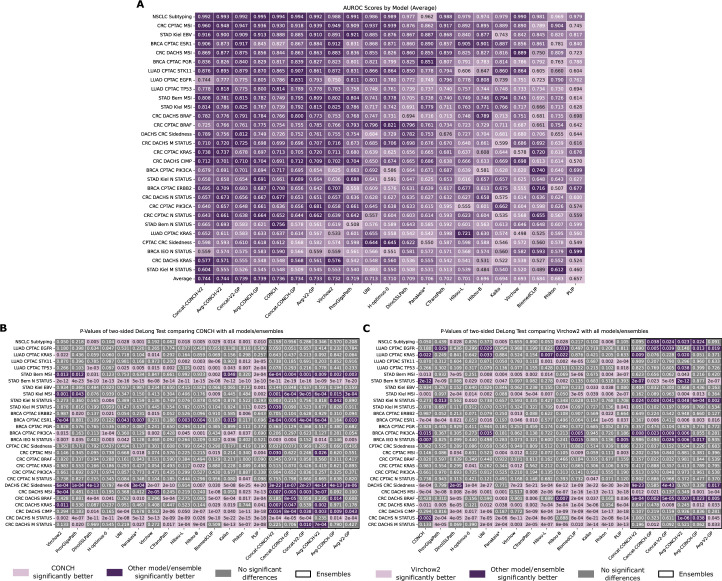
- The CONCH + Virchow2 ensemble produced a 1,792-dimensional vector with the highest AUROC of 71.9, versus 71.1 for CONCH, 70.9 for Virchow2 and 69.2 for Prov-GigaPath. Ensembling CONCH and Virchow2 outperformed individual models in 55% of tasks and reduced misclassifications versus CONCH by an average of 6.2% across five folds; the four top models ensemble achieved a mean AUROC 1.2% higher than CONCH.
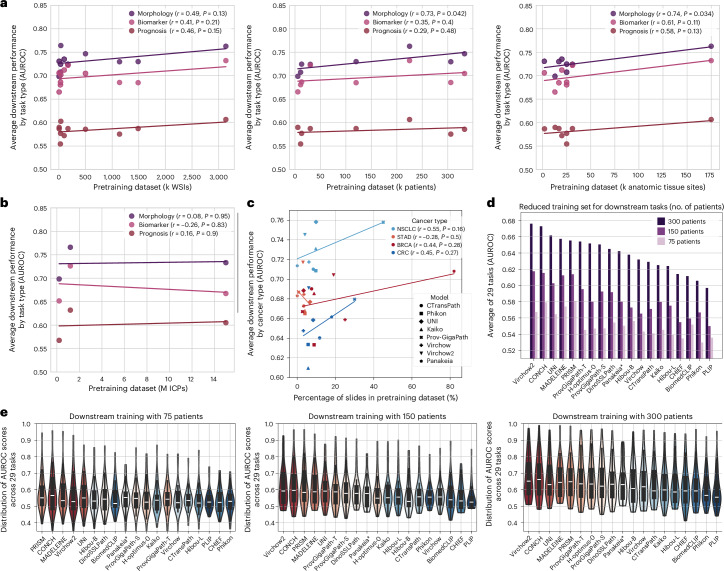
- Data diversity outweighed volume: correlations between downstream performance and pretraining dataset size/diversity ranged from r = 0.29–0.74, with significant correlations only for morphology with patient count (r = 0.73, P < 0.05) and tissue site diversity (r = 0.74, P < 0.05). CONCH outperformed BiomedCLIP despite far fewer image-caption pairs (1.1 million versus 15 million).
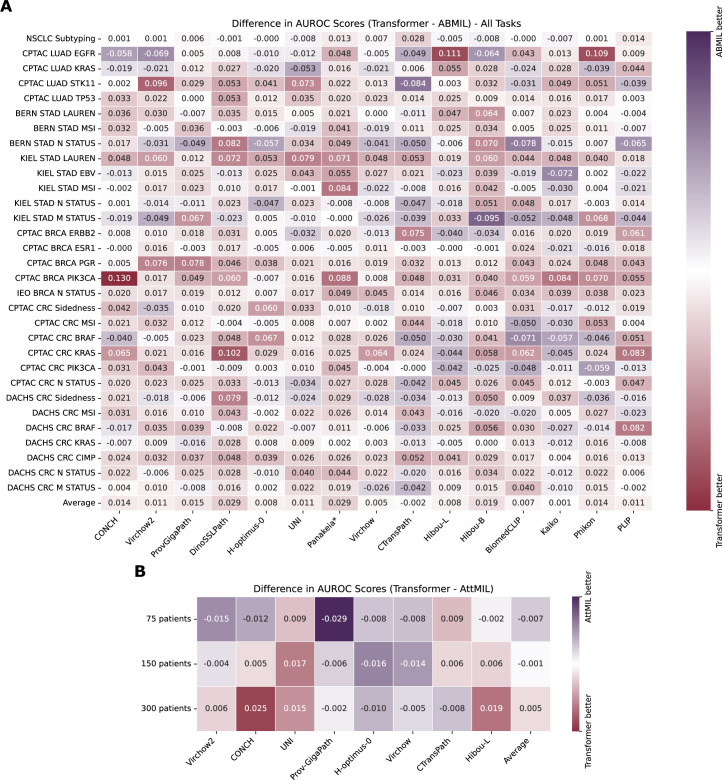
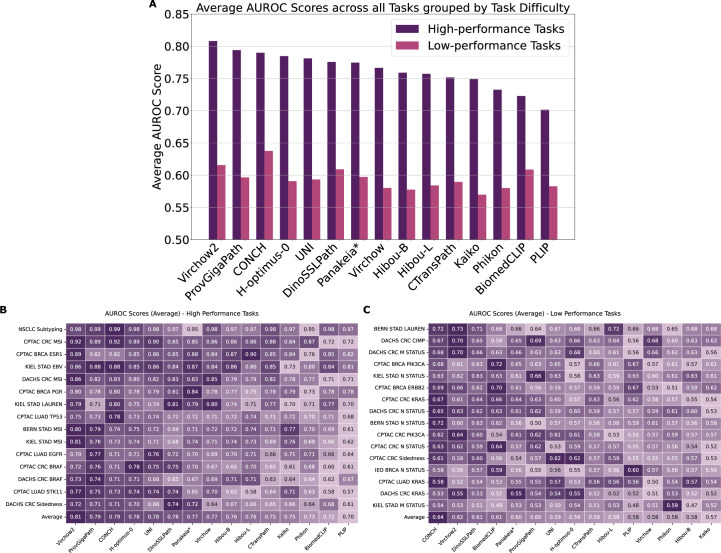
- In low-data settings, Virchow2 led 8 tasks at n = 300 patients, PRISM led 9 at n = 150, and CONCH led 5 at n = 75. In low-prevalence biomarkers, Prov-GigaPath had the highest mean AUROC of 0.74, followed by Virchow (0.73) and CONCH (0.72). Slide encoders underperformed original tile embeddings in MIL, and ABMIL averaged 0.01 AUROC lower than the transformer-based aggregator.
Methods
- Benchmark of 19 foundation models (12 vision-only, 3 vision-language, 4 slide encoders) and 14 ensembles on 31 weakly supervised tasks: 5 morphology, 19 biomarker and 7 prognostication tasks. Data included 13 cohorts, 6,818 patients and 9,528 slides from LUAD, LUSC, CRC, STAD and BRCA; TCGA was used for training, with external validation on CPTAC, DACHS, Kiel, Bern and IEO.
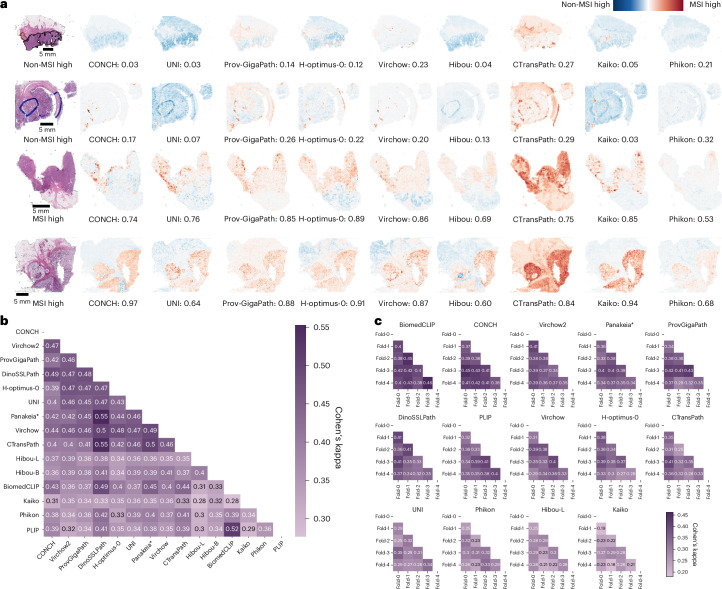
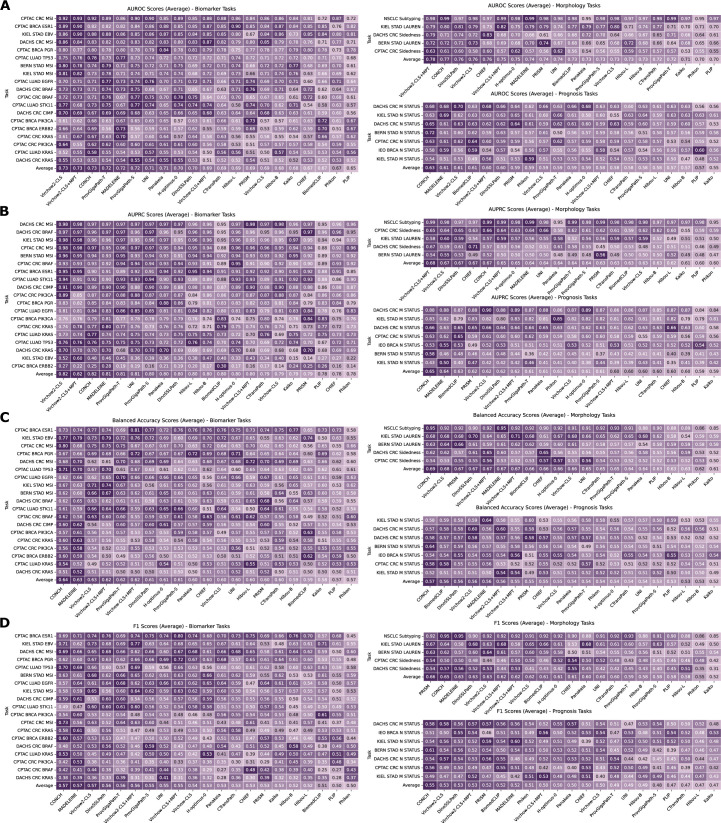
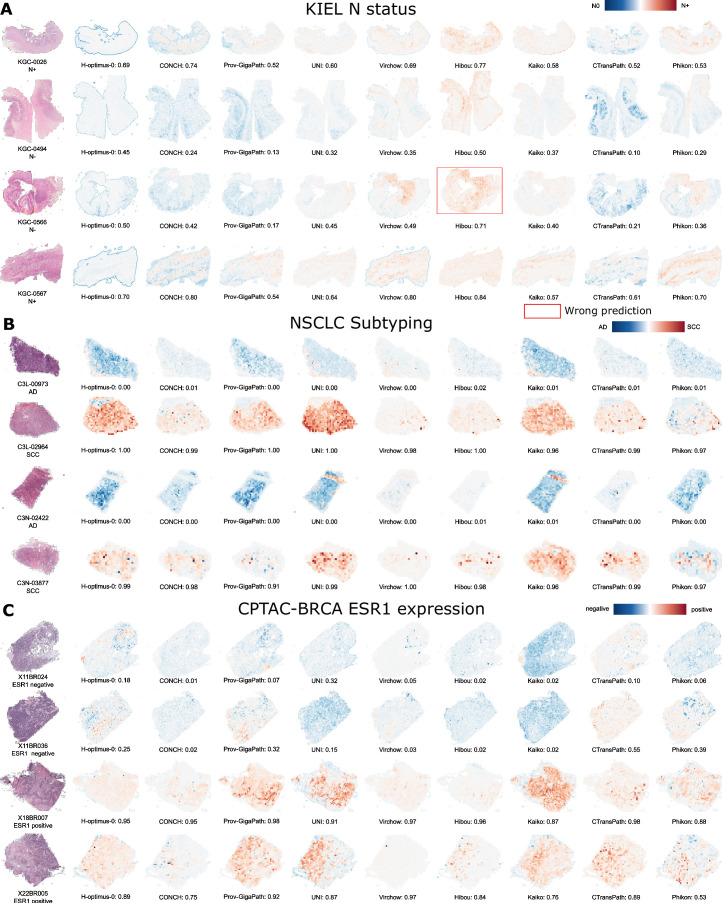
- The STAMP pipeline v1.1.1 tessellated WSIs into 224 × 224 pixel tiles, extracted features with each foundation model, and trained a transformer-based aggregator using fivefold cross-validation, yielding 2,945 models (19 models × 31 tasks × 5 folds). ABMIL was evaluated as an alternative aggregator; metrics included AUROC, AUPRC, balanced accuracy, F1, DeLong’s test and Cohen’s kappa, with Grad-CAM heatmaps for interpretability.
- Low-data experiments trained downstream models on randomly sampled cohorts of 300, 150 and 75 patients. Low-prevalence tasks included BRAF (10%), CIMP (13%) and MSI (14%) in CRC; EBV (8%) and M-status (7%) in STAD; and EGFR (11%) and STK11 (15%) in LUAD, evaluated in DACHS, Kiel and CPTAC-LUAD.
Limitations
- Stated: evaluation covers only four cancer types; the study was limited to foundation models with research-accessible licences, excluding RudolphV and PLUTO; pen-mark artefacts were present in 90% of DACHS and 22% of Bern samples but had minimal impact because they were evenly distributed across classes; fine-tuning general-purpose models such as GPT-4o was outside scope; future work should expand tumour types, biomarkers and patient cohorts.
- Stated/evident: correlation analyses made no adjustments for multiple comparisons, and most correlations between pretraining dataset characteristics and downstream performance were not statistically significant. Evident from the text: low-prevalence tasks were restricted to DACHS, Kiel and CPTAC-LUAD to avoid cancer type imbalance, so those findings may not generalize to other cohorts.
Model-written summary. Check it against the paper before relying on it.
Integrity signals
Registry
Cites
Statistics
Figures




Verification
Claims the paper makes
0 Valid · 2 Not valid · 7 Not checked · 83 Own results and interpretations
A result the paper reports from its own data — it cites no other source for it, so there is none to check. The quote shows it is in the paper.
In the paper
“In high-performance tasks (>0.75), Virchow2 demonstrated superior performance in high-performance tasks, followed by Prov-GigaPath and CONCH.”
§ Benchmarking foundation models as feature extractors for weakly supervised computational pathology > Results > Performance of foundation models in scarce data settings
boostedstates an association- Asserted: passes — The authors put it forward as true.
- Checkable: passes — It can be checked against evidence.
- Load-bearing: unclear — It is unclear whether the paper’s conclusions depend on it.
- Based: passes — The paper gives a reason why it holds.
A result the paper states — it cites no source for it, so there is none to check. The quote shows it is in the paper.
In the paper
“An ensemble combining CONCH and Virchow2 predictions outperformed individual models in 55% of tasks, leveraging their complementary strengths in classification scenarios.”
§ Benchmarking foundation models as feature extractors for weakly supervised computational pathology > Abstract
plainstates a cause- Asserted: passes — The authors put it forward as true.
- Checkable: passes — It can be checked against evidence.
- Load-bearing: passes — The paper’s conclusions depend on it.
- Based: passes — The paper gives a reason why it holds.
A result the paper reports from its own data — it cites no other source for it, so there is none to check. The quote shows it is in the paper.
In the paper
“Combining the best-performing models, CONCH and Virchow2, yielded a 1,792-dimensional vector with the highest AUROC of 71.9.”
§ Benchmarking foundation models as feature extractors for weakly supervised computational pathology > Results > Ensemble of pathology foundation models improve performance
plainstates a cause- Asserted: passes — The authors put it forward as true.
- Checkable: passes — It can be checked against evidence.
- Load-bearing: passes — The paper’s conclusions depend on it.
- Based: passes — The paper gives a reason why it holds.
A result the paper reports from its own data — it cites no other source for it, so there is none to check. The quote shows it is in the paper.
In the paper
“Across the 19 biomarker-related tasks, Virchow2 and CONCH achieved the highest mean AUROCs of 0.73, followed closely by Prov-GigaPath with a mean AUROC of 0.72 (Fig. 2d).”
§ Benchmarking foundation models as feature extractors for weakly supervised computational pathology > Results > Benchmark of pathology foundation models
plain- Asserted: passes — The authors put it forward as true.
- Checkable: passes — It can be checked against evidence.
- Load-bearing: passes — The paper’s conclusions depend on it.
- Based: passes — The paper gives a reason why it holds.
A result the paper reports from its own data — it cites no other source for it, so there is none to check. The quote shows it is in the paper.
In the paper
“We show that a vision-language foundation model, CONCH, yielded the highest overall performance when compared with vision-only foundation models, with Virchow2 as close second, although its superior performance was less pronounced in low-data scenarios and low-prevalence tasks.”
§ Benchmarking foundation models as feature extractors for weakly supervised computational pathology > Abstract
plainstates an associationn = 6,818- Asserted: passes — The authors put it forward as true.
- Checkable: passes — It can be checked against evidence.
- Load-bearing: passes — The paper’s conclusions depend on it.
- Based: passes — The paper gives a reason why it holds.
44 more claims
Create a free account to see all 92 claims and to verify the 9 references still open.
- It may state two separate claims as one. 25
- Probably not a substantial claim. 21
- The quote only partly states this claim. 1
Claims other papers make about this one
Each is checked against this paper’s own text: does it say what the citing paper says it does?
The check wasn’t confident either way, so it gives no verdict — never disputed.
In the citing paper
“Building on the success of knowledge distillation and masked image modeling86,87 for patch encoder pretraining21,22, TITAN introduces a large-scale pretraining paradigm that leverages millions of high-resolution region-of-interests (ROIs; at 8,192 × 8,192 pixels at 20× magnification) for scalable WSI encoding.”
From A multimodal whole-slide foundation model for pathology (2025) · cites this paper as [22]
Experimental — accuracy not yet measured
Self-check
Percentages, sums and reported differences re-computed from the paper’s own numbers.
Each contradiction between two passages listed here was confirmed by an independent check.
Rated minor: it would not touch a result — a value no result rests on, a p-value that stays on the same side of the significance level, or a conflict that is clerical, resolved elsewhere in the paper, or outside its own findings.
In the paper
§ Benchmarking foundation models as feature extractors for weakly supervised computational pathology > Results > Performance of foundation models in scarce data settings
“we focused on clinically relevant tasks with rare positive cases (>15%) in the TCGA training cohort.”
§ Benchmarking foundation models as feature extractors for weakly supervised computational pathology > Results > Performance of foundation models in scarce data settings
“Key low-prevalence biomarkers included BRAF mutation (10%), CpG island methylator phenotype (CIMP) status (13%) and microsatellite instability (MSI) status (14%) in CRC; Epstein–Barr virus (EBV) positivity (8%) and M-status (7%) in STAD; and EGFR mutation (11%) and STK11 mutation (15%) in lung adenocarcinoma (LUAD).”
Citations
Cites
A Coefficient of Agreement for Nominal Scales
Cohen, J. (1960) · Educational and Psychological Measurement · doi:10.1177/001316446002000104 · Cited by 42,398
A Computational Approach to Edge Detection
Canny, J. (1986) · IEEE Transactions on Pattern Analysis and Machine Intelligence · doi:10.1109/tpami.1986.4767851 · Cited by 30,004
Momentum Contrast for Unsupervised Visual Representation Learning
He, K., Fan, H., Wu, Y., Xie, S., & Girshick, R. (2020) · 2020 IEEE/CVF Conference on Computer Vision and Pattern Recognition (CVPR) · doi:10.1109/cvpr42600.2020.00975 · Cited by 13,347
Grad-CAM: Visual Explanations from Deep Networks via Gradient-Based Localization
Selvaraju, R. R., Cogswell, M., Das, A., Vedantam, R., Parikh, D., & Batra, D. (2020) · International Journal of Computer Vision · doi:10.1007/s11263-019-01228-7 · Cited by 6,909
LAURÉN, P. (1965) · Acta Pathologica Microbiologica Scandinavica · doi:10.1111/apm.1965.64.1.31 · Cited by 6,133
The 2019 WHO classification of tumours of the digestive system
Nagtegaal, I. D., Odze, R. D., Klimstra, D., Paradis, V., Rugge, M., Schirmacher, P., Washington, K. M., Carneiro, F., Cree, I. A., & the WHO Classification of Tumours Editorial Board (2020) · Histopathology · doi:10.1111/his.13975 · Cited by 4,192
Gaussian Error Linear Units (GELUs)
Hendrycks, D., & Gimpel, K. (2016) · arXiv · doi:10.48550/arxiv.1606.08415 · Cited by 3,537
Coudray, N., Ocampo, P. S., Sakellaropoulos, T., Narula, N., Snuderl, M., Fenyö, D., Moreira, A. L., Razavian, N., & Tsirigos, A. (2018) · Nature Medicine · doi:10.1038/s41591-018-0177-5 · Cited by 2,930
OncoKB: A Precision Oncology Knowledge Base
Chakravarty, D., Gao, J., Phillips, S., Kundra, R., Zhang, H., Wang, J., Rudolph, J. E., Yaeger, R., Soumerai, T., Nissan, M. H., et al. (2017) · JCO Precision Oncology · doi:10.1200/po.17.00011 · Cited by 2,589
Data-efficient and weakly supervised computational pathology on whole-slide images
Lu, M. Y., Williamson, D. F. K., Chen, T. Y., Chen, R. J., Barbieri, M., & Mahmood, F. (2021) · Nature Biomedical Engineering · doi:10.1038/s41551-020-00682-w · Cited by 2,282
Research works printed but not linked: 3
- Chen, T., Kornblith, S., Norouzi, M. & Hinton, G. A simple framework for contrastive learning of visual representations. In Proc. 37th International Conference on Machine Learning (eds Daumé, H. III & Singh, A.) Vol. 119, 1597–1607 (PMLR, 2020).
- Dosovitskiy, A. et al. An image is worth 16×16 words: transformers for image recognition at scale. In Proc. International Conference on Learning Representations (ICLR, 2021).
- Ilse, M., Tomczak, J. M. & Welling, M. Attention-based deep multiple instance learning. In Proc. 35th International Conference on Machine Learning Vol. 80, 2127–2136 (PMLR, 2018)
Cited by
A multimodal whole-slide foundation model for pathology
Ding, T., Wagner, S. J., Song, A. H., Chen, R. J., Lu, M. Y., Zhang, A., Vaidya, A. J., Jaume, G., Shaban, M., Kim, A., et al. (2025) · Nature Medicine · doi:10.1038/s41591-025-03982-3 · Cited by 171
“Building on the success of knowledge distillation and masked image modeling 86,87 for patch encoder pretraining 21,22 , TITAN introduces a large-scale pretraining paradigm that leverages millions of high-resolution region-of-interests (ROIs; at 8,192 × 8,192 pixels at 20× magnification) for…”
A clinical benchmark of public self-supervised pathology foundation models
Campanella, G., Chen, S., Singh, M., Verma, R., Muehlstedt, S., Zeng, J., Stock, A., Croken, M., Veremis, B., Elmas, A., et al. (2025) · Nature Communications · doi:10.1038/s41467-025-58796-1 · Cited by 126
Huang, Y., Zhao, W., Zhang, Z., Chen, Y., Fu, Y., Wu, F., Jiang, Y., Liang, L., Wang, S., & Yu, L. (2025) · Nature Communications · doi:10.1038/s41467-025-66300-y · Cited by 32
Knowledge-enhanced pretraining for vision-language pathology foundation model on cancer diagnosis
Zhou, X., Sun, L., He, D., Guan, W., Wang, G., Wang, R., Wang, L., Yuan, X., Sun, X., Zhang, Y., et al. (2026) · Cancer Cell · doi:10.1016/j.ccell.2026.01.019 · Cited by 50
Multimodal analysis of whole slide images in colorectal cancer
Jonnagaddala, J., Shulajkovska, M., Gradišek, A., Jue, T. R., Zhou, Q., Guo, Y., Chayeb, J. M. E., Li, R., Lipková, J., Kather, J. N., et al. (2025) · npj Digital Medicine · doi:10.1038/s41746-025-02095-y · Cited by 10
Self-citation
Metadata
- Authors
- Neidlinger, P., El Nahhas, O. S. M., Muti, H. S., Lenz, T., Hoffmeister, M., Brenner, H., van Treeck, M., Langer, R., Dislich, B., Behrens, H. M., Röcken, C., Foersch, S., Truhn, D., Marra, A., Saldanha, O. L., & Kather, J. N.
- Affiliations
- University Hospital Carl Gustav Carus (DE)
- Helmholtz-Zentrum Dresden-Rossendorf (DE)
- German Cancer Research Center (DE)
- Johannes Kepler University of Linz (AT)
- University of Bern (CH)
- University Hospital Schleswig-Holstein (DE)
- University Medical Center of the Johannes Gutenberg University Mainz (DE)
- Universitätsklinikum Aachen (DE)
- European Institute of Oncology (IT)
- Heidelberg University (DE)
- Corresponding author
- Kather, Jakob Nikolas
- ORCID
- Venue
- Nature Biomedical Engineering
- Published
- 2025-10-01
- Volume
- 10
- Issue
- 6
- Pages
- 1113-1123
- ISSN
- 2157-846X (ISSN-L)
- PMC
- PMC13279263
- OpenAlex
- W4414705991
- Cited by
- 80
- References
- 56
- Citations by year
- 2026: 69 · 2025: 11
- FWCI
- 31.97
- Type
- journal article
- Language
- en
- Open access
- hybrid
- doi.org
- Licence
- cc-by
- creativecommons.org/licenses/by/4.0 (tdm)
- creativecommons.org/licenses/by/4.0 (vor)
- Locations
- Nature Biomedical Engineering (publishedVersion, cc-by)
- PubMed (publishedVersion)
- PubMed Central (publishedVersion, cc-by)
- Archivio Istituzionale della Ricerca (Universita Degli Studi Di Milano) (submittedVersion, other-oa)
- Multimedialen Archiv und Publikationsserver der Christian-Albrechts-Universität zu Kiel (Christian-Albrechts-Universität zu Kiel) (submittedVersion, cc-by)
- Funders
- National Cancer Institute (R01CA263318)
- Topics
- Physical Sciences › Computer Science › Artificial Intelligence › AI in cancer detection
- Health Sciences › Medicine › Radiology, Nuclear Medicine and Imaging › Radiomics and Machine Learning in Medical Imaging
- Health Sciences › Medicine › Health Informatics › Artificial Intelligence in Healthcare and Education
- Keywords
- feature extraction, weakly supervised learning, computational pathology, vision-language models, conch, model benchmarking, ensemble learning, biomarker prediction, prognostic outcome, lung cancer, colorectal cancer, gastric cancer, breast cancer, data diversity
- MeSH terms
- Algorithms, Female, Humans, Neoplasms, Prognosis, Computational Biology, Benchmarking
About these checks
Registry, retraction, Cites and statistics results are computed, not judged, with one exception: a printed reference that no index lists is read once by a model before it counts as a citation error. Claims are extracted by a model and kept only when their quote appears verbatim in the text; each cited source is then checked, with a model’s help, for whether it says what the claim relies on. Those verdicts can be wrong — read the claim’s quote and the cited source before relying on one.
A language model drew the claims from the paper on 2026-10-01, under version 3 of the claim definition (model deepseek-v4.1-flash, prompt extract-v3).
A second model labelled each claim on 2026-10-01 (model jev-1.13-20260917, definition revision gold-guideline-v0.2).
Statistics and arithmetic are recomputed, not judged.
Confidence bands are shown only for fields calibrated on our annotated test set. None is calibrated yet, so no band is shown.
What counts as a claim ›How we measure confidence ›How we check this ›
Are you an author, or do you see a problem with this page? Request a review
How to cite
Cite CoChat for the checks on this page, and the paper for its own findings.
- This page
- CoChat. (2026). Citation check: Benchmarking foundation models as feature extractors for weakly supervised computational pathology. https://app.cochat.ai/papers/10.1038/s41551-025-01516-3
- The paper
- Neidlinger, P., El Nahhas, O. S. M., Muti, H. S., Lenz, T., Hoffmeister, M., Brenner, H., van Treeck, M., Langer, R., Dislich, B., Behrens, H. M., Röcken, C., Foersch, S., Truhn, D., Marra, A., Saldanha, O. L., & Kather, J. N. (2025). Benchmarking foundation models as feature extractors for weakly supervised computational pathology. Nature Biomedical Engineering. https://doi.org/10.1038/s41551-025-01516-3
Data sources
Bibliographic data: Semantic Scholar, OpenAlex, Crossref.
Contains information from the Semantic Scholar Academic Graph Datasets, made available under the ODC Attribution License (ODC-BY 1.0).
Semantic Scholar’s data is described in: Kinney, R., et al. (2023). The Semantic Scholar Open Data Platform. arXiv:2301.10140.
