Cited by 126

The DOI matches its Crossref record; 6 of the 6 references it cites were found in a registry or an index.

Nation-wide mapping of tree-level aboveground carbon stocks in Rwanda

Mugabowindekwe, Maurice, Brandt, Martin, Chave, Jérôme, Reiner, Florian, Skole, David L., Kariryaa, Ankit, Igel, Christian, Hiernaux, Pierre, Ciais, Philippe, Mertz, Ole, Tong, Xiaoye, Li, Sizhuo, Rwanyiziri, Gaspard, Dushimiyimana, Thaulin, Ndoli, Alain, Uwizeyimana, Valens, Lillesø, Jens-Peter Barnekow, Gieseke, Fabian, Tucker, Compton J., Saatchi, Sassan, Fensholt, Rasmus·2023·Nature Climate Change

Published version of a preprint

Abstract

Trees sustain livelihoods and mitigate climate change but a predominance of trees outside forests and limited resources make it difficult for many tropical countries to conduct automated nation-wide inventories. Here, we propose an approach to map the carbon stock of each individual overstory tree at the national scale of Rwanda using aerial imagery from 2008 and deep learning. We show that 72% of the mapped trees are located in farmlands and savannas and 17% in plantations, accounting for 48.6% of the national aboveground carbon stocks. Natural forests cover 11% of the total tree count and 51.4% of the national carbon stocks, with an overall carbon stock uncertainty of 16.9%. The mapping of all trees allows partitioning to any landscapes classification and is urgently needed for effective planning and monitoring of restoration activities as well as for optimization of carbon sequestration, biodiversity and economic benefits of trees.

Overview

The claims and statistics of this paper haven’t been checked yet.

Run the check — free, no account needed. It reads the open-access text and checks the sources it cites.

A few free checks a day · papers already verified open instantly · results are public

Integrity signals

Registry

Crossref · 10.1038/s41558-022-01544-w

Cites

6 of 6 references verified0 citation errors · 0 not checkable

Statistics

Figures

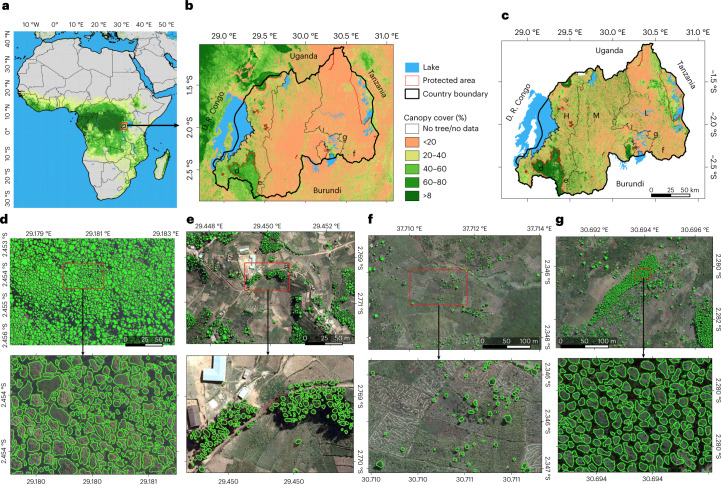
Fig. 1 Mapping of individual trees inside and outside of forests in Rwanda. a,b, Tree cover from a previously published global tree cover map using Landsat data in Africa (a) and in Rwanda (b). Global tree cover data in a and b from ref. 15. c, Country-wide tree cover estimated by deep learning from 0.25 m resolution aerial imagery from 2008 (L, lowlands; M, midlands; H, highlands). Labels d–g in a and b show location of expanded panels. d–g, Examples of individual tree crown mapping in tropical montane rainforest, note that artificial gaps were filled during a postprocessing step (Methods) (d); Eucalyptus plantations (e); farmlands (f); and Pinus plantations (g). An example of previously published manual forest area delineations is shown in Extended Data Fig. 1. Boundary shapefiles of Rwanda in b and c from https://geodata.rw/portal/home/. Panel e adapted with permission from ref. 50, Springer Nature Limited. Credit: photographs in d–g, Swedesurvey.
Fig. 1 Mapping of individual trees inside and outside of forests in Rwanda. a,b, Tree cover from a previously published global tree cover map using Landsat data in Africa (a) and in Rwanda (b). Global tree cover data in a and b from ref. 15. c, Country-wide tree cover estimated by deep learning from 0.25 m resolution aerial imagery from 2008 (L, lowlands; M, midlands; H, highlands). Labels d–g in a and b show location of expanded panels. d–g, Examples of individual tree crown mapping in tropical montane rainforest, note that artificial gaps were filled during a postprocessing step (Methods) (d); Eucalyptus plantations (e); farmlands (f); and Pinus plantations (g). An example of previously published manual forest area delineations is shown in Extended Data Fig. 1. Boundary shapefiles of Rwanda in b and c from https://geodata.rw/portal/home/. Panel e adapted with permission from ref. 50, Springer Nature Limited. Credit: photographs in d–g, Swedesurvey.CC BY · PubMed Central
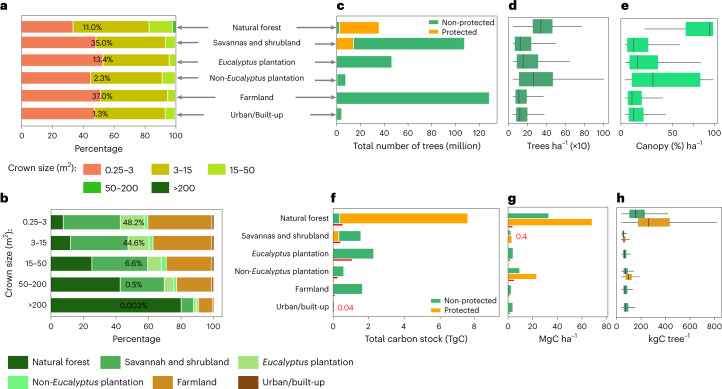
Fig. 2 Tree counts, crown areas and carbon stocks for different land cover/use types. a, Percentage covered by different crown sizes in each land cover/use type. The percentage number shows the contribution of the land cover/use type to the total area. Crown sizes >200 m2 comprise only 0.003% of the total tree count, making the class barely visible. b, Percentage covered by each land cover/use type in different crown size categories. c, Total count of trees by land cover/use. d, Boxplot showing the average number of trees per hectare by land cover/use type. e, Same as d but for canopy cover. f, Total estimated carbon stock per land cover/use type (see Methods for details on uncertainties and error propagation). g, Barplot showing the average carbon density per hectare per land cover/use. h, Boxplots showing the average carbon stock per tree per land cover/use. Number of trees = 355,268,345 (for c–h, n = 39,347,302 for natural forest; 123,381,245 for savannah and shrubland; 47,921,438 for Eucalyptus plantation; 8,296,494 for non-Eucalyptus plantation; 131,822,508 for farmland; and 4,499,358 for urban/built-up). In boxplots in d, e and h (from left to right), the start of the horizontal line represents the minimum value, vertical lines represent first quartile, median and third quartile values, respectively, and the end of the horizontal line represents the maximum value. The red lines in f and g are the error bars presented as absolute difference between the final carbon stock predictions and the NFI data (Extended Data Table 1). The overall uncertainty at national scale is 16.9% (Methods; Extended Data Table 1b).
Fig. 2 Tree counts, crown areas and carbon stocks for different land cover/use types. a, Percentage covered by different crown sizes in each land cover/use type. The percentage number shows the contribution of the land cover/use type to the total area. Crown sizes >200 m2 comprise only 0.003% of the total tree count, making the class barely visible. b, Percentage covered by each land cover/use type in different crown size categories. c, Total count of trees by land cover/use. d, Boxplot showing the average number of trees per hectare by land cover/use type. e, Same as d but for canopy cover. f, Total estimated carbon stock per land cover/use type (see Methods for details on uncertainties and error propagation). g, Barplot showing the average carbon density per hectare per land cover/use. h, Boxplots showing the average carbon stock per tree per land cover/use. Number of trees = 355,268,345 (for c–h, n = 39,347,302 for natural forest; 123,381,245 for savannah and shrubland; 47,921,438 for Eucalyptus plantation; 8,296,494 for non-Eucalyptus plantation; 131,822,508 for farmland; and 4,499,358 for urban/built-up). In boxplots in d, e and h (from left to right), the start of the horizontal line represents the minimum value, vertical lines represent first quartile, median and third quartile values, respectively, and the end of the horizontal line represents the maximum value. The red lines in f and g are the error bars presented as absolute difference between the final carbon stock predictions and the NFI data (Extended Data Table 1). The overall uncertainty at national scale is 16.9% (Methods; Extended Data Table 1b).CC BY · PubMed Central
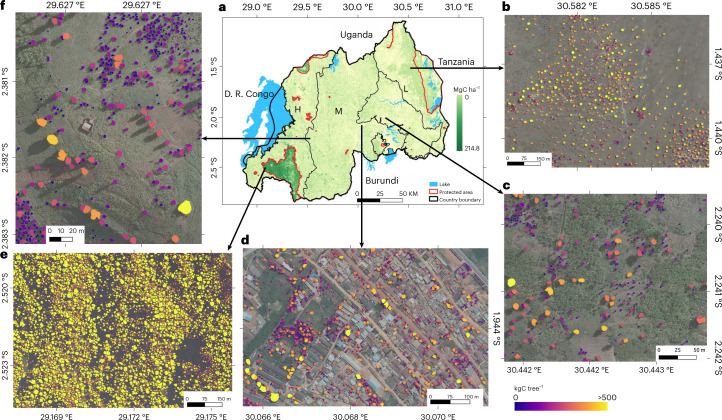
Fig. 3 Aboveground carbon stocks at tree level in Rwanda. a, Spatial distribution of the estimated carbon stock across the major landscape types. b–f, Examples of estimated carbon stock per individual tree in wooded savanna (b), farmland (c), Kigali city (d), the tropical montane rainforest in the Nyungwe National Park (e) and in tree plantations (f). Boundary shapefiles of Rwanda in a from https://geodata.rw/portal/home/. Credit: photographs in b–f, Swedesurvey.
Fig. 3 Aboveground carbon stocks at tree level in Rwanda. a, Spatial distribution of the estimated carbon stock across the major landscape types. b–f, Examples of estimated carbon stock per individual tree in wooded savanna (b), farmland (c), Kigali city (d), the tropical montane rainforest in the Nyungwe National Park (e) and in tree plantations (f). Boundary shapefiles of Rwanda in a from https://geodata.rw/portal/home/. Credit: photographs in b–f, Swedesurvey.CC BY · PubMed Central
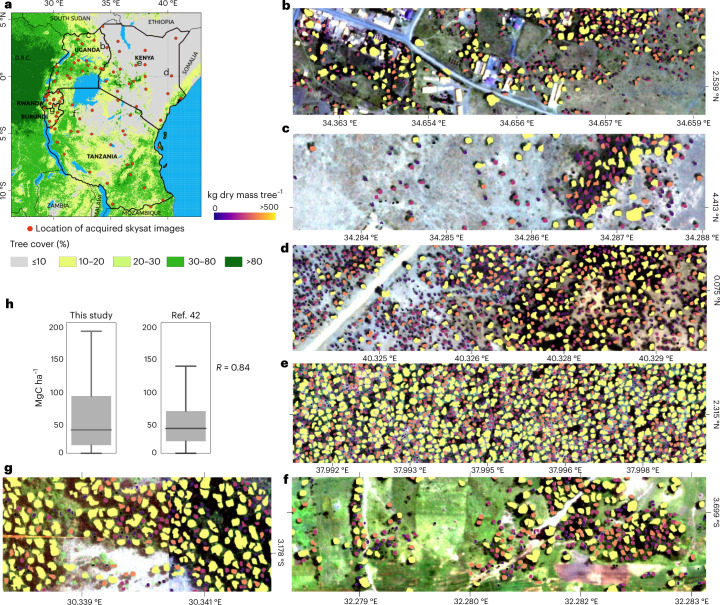
Fig. 4 Application beyond Rwanda. a, The location of the acquired 83 Skysat images across East Africa. Tree cover data from ref. 15. b–g, Examples of tree-level carbon stock predictions for Uganda (b,c), Kenya (d,e), Tanzania (f) and Burundi (g). h, A total of 150 random (n = 150) 1 × 1 km2 samples were used to aggregate the predicted tree-level carbon stocks, then compare the results to a previously published map42 using two-tailed Pearson correlation (P < 0.001). The boxplot lines from top to bottom represent the maximum, third quartile, median, first quartile and minimum values. See Extended Data Fig. 8a for more comparisons. Boundary shapefiles of East African countries in a from DIVA-GIS. Credit: photographs in b–d, Skysat.
Fig. 4 Application beyond Rwanda. a, The location of the acquired 83 Skysat images across East Africa. Tree cover data from ref. 15. b–g, Examples of tree-level carbon stock predictions for Uganda (b,c), Kenya (d,e), Tanzania (f) and Burundi (g). h, A total of 150 random (n = 150) 1 × 1 km2 samples were used to aggregate the predicted tree-level carbon stocks, then compare the results to a previously published map42 using two-tailed Pearson correlation (P < 0.001). The boxplot lines from top to bottom represent the maximum, third quartile, median, first quartile and minimum values. See Extended Data Fig. 8a for more comparisons. Boundary shapefiles of East African countries in a from DIVA-GIS. Credit: photographs in b–d, Skysat.CC BY · PubMed Central
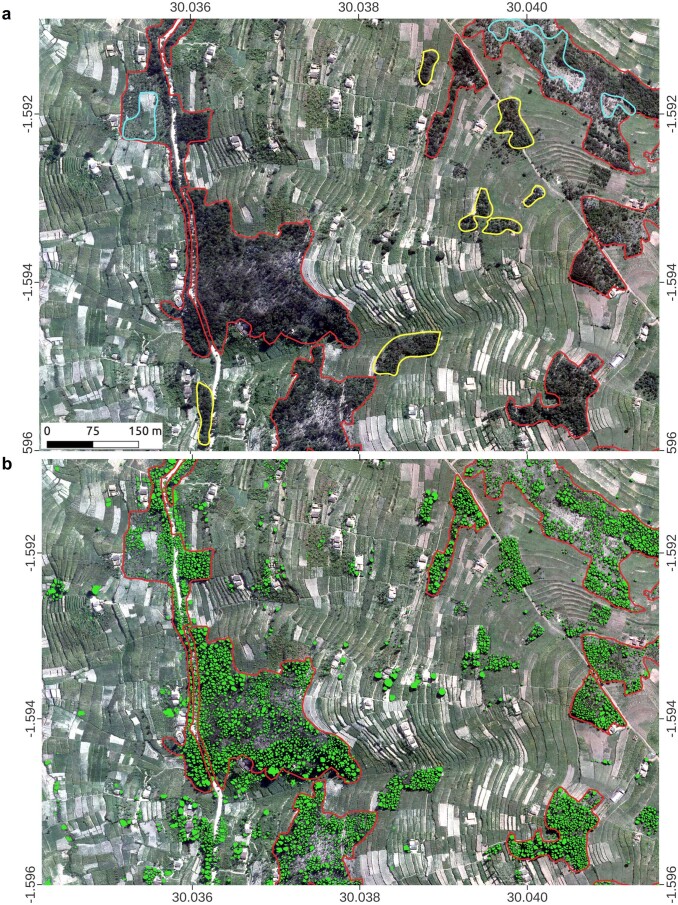
Extended Data Fig. 1 An example showing previous manual forest delineations. The red lines are manually labelled forest boundaries from the Rwanda national forest map of 2012 (ref. 35). a, Several patches which would qualify for the used forest definition were missed by the manual delineation (yellow lines). Also, some bare areas inside forest patches (cyan line) were considered as part of forests. b, Our results are shown in green, highlighting the improvements over the previous method. Shapefiles for national forest cover map from RFA. Credit: background photographs, Swedesurvey.
Extended Data Fig. 1 An example showing previous manual forest delineations. The red lines are manually labelled forest boundaries from the Rwanda national forest map of 2012 (ref. 35). a, Several patches which would qualify for the used forest definition were missed by the manual delineation (yellow lines). Also, some bare areas inside forest patches (cyan line) were considered as part of forests. b, Our results are shown in green, highlighting the improvements over the previous method. Shapefiles for national forest cover map from RFA. Credit: background photographs, Swedesurvey.CC BY · PubMed Central
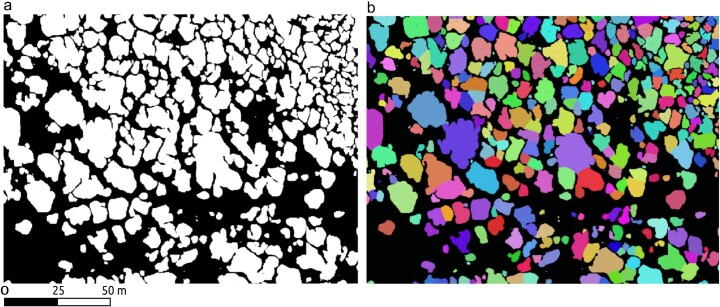
Extended Data Fig. 2 Examples from the postprocessing algorithm separating clumped trees. a, Example of predicted tree crowns in the rainforest, with many trees being predicted as clumped objects. b, Results after the postprocessing algorithm separated the clumped crowns. The algorithm first finds the object centres, and then relabels the image based on weighted distances to the identified centres. Thus, blobs containing multiple centres are divided into various instances accordingly. The algorithm adds a large penalty for not-in-sight centres, and additionally performs a majority filtering to remove the lone-pixels.
Extended Data Fig. 2 Examples from the postprocessing algorithm separating clumped trees. a, Example of predicted tree crowns in the rainforest, with many trees being predicted as clumped objects. b, Results after the postprocessing algorithm separated the clumped crowns. The algorithm first finds the object centres, and then relabels the image based on weighted distances to the identified centres. Thus, blobs containing multiple centres are divided into various instances accordingly. The algorithm adds a large penalty for not-in-sight centres, and additionally performs a majority filtering to remove the lone-pixels.CC BY · PubMed Central
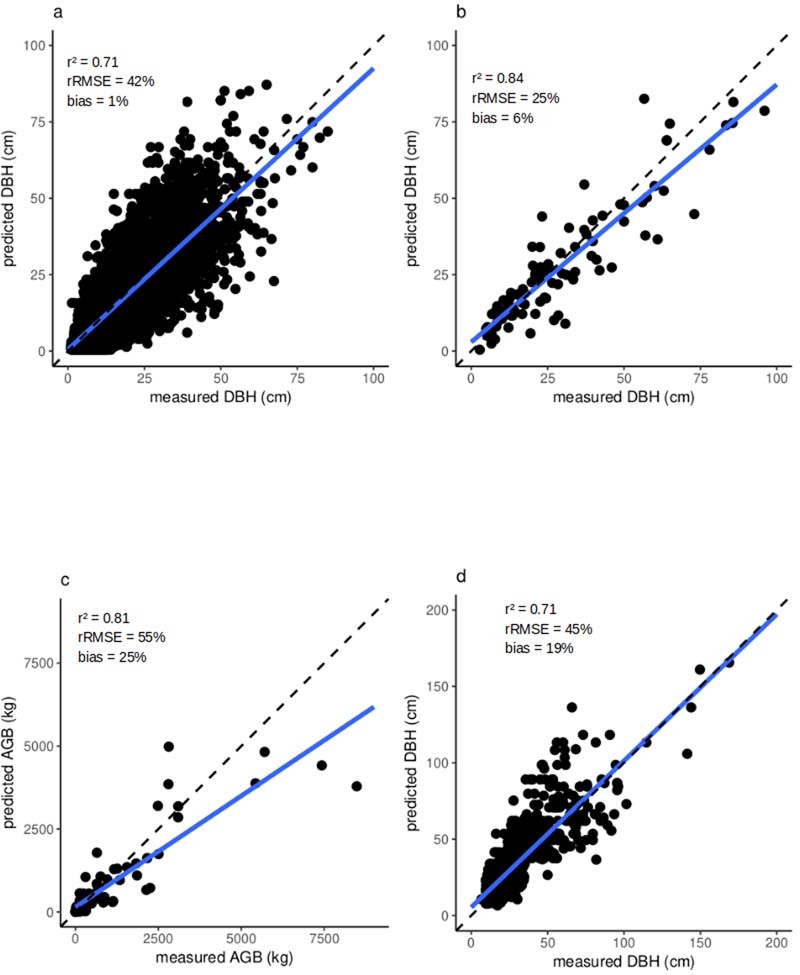
Extended Data Fig. 3 Tree crown allometry. a, DBH is predicted from CD using a total of 11,593 samples from a global database36. The plot compares the predicted against the measured DBH. b, DBH is predicted for an independent dataset of 93 trees from Kenya using the equation derived from (a). c, We used an allometric equation from literature37 to calculate AGB from the CD predicted DBH shown in (b). Predicted AGB is here compared with destructively measured AGB. d, While samples shown in a–c are all outside forests, (d) shows 793 field-measured trees from Rwanda’s natural forest. As in (a), DBH was predicted from CD. The bias was calculated following equation (1).
Extended Data Fig. 3 Tree crown allometry. a, DBH is predicted from CD using a total of 11,593 samples from a global database36. The plot compares the predicted against the measured DBH. b, DBH is predicted for an independent dataset of 93 trees from Kenya using the equation derived from (a). c, We used an allometric equation from literature37 to calculate AGB from the CD predicted DBH shown in (b). Predicted AGB is here compared with destructively measured AGB. d, While samples shown in a–c are all outside forests, (d) shows 793 field-measured trees from Rwanda’s natural forest. As in (a), DBH was predicted from CD. The bias was calculated following equation (1).CC BY · PubMed Central
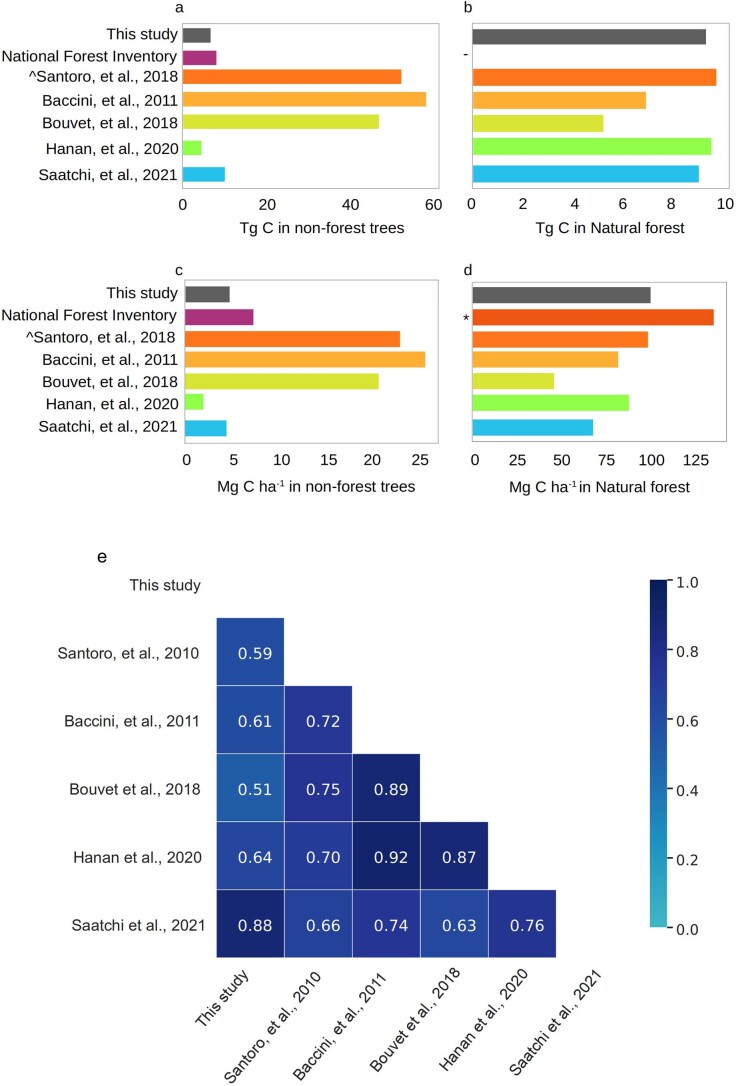
Extended Data Fig. 4 Comparison of aboveground carbon estimations at country scale. a, Comparison of predicted total aboveground carbon stocks by this study, NFI and existing global products for non-forest areas. b, Same as (a) but for natural forests. c, Comparison of predicted aboveground carbon density by this study, NFI, and existing global products for non-forest areas. d, Same as (c) but for natural forests. e, Correlation matrix showing the two-tailored Pearson correlation for 1×1 km2 grids between different biomass datasets. Note that ref. 45 does not report values above 85 Mg biomass per hectare (Supplementary Fig. 2), explaining the lower correlation values. P < 0.001 for all correlations. (^ We selected the 2010 version; - Natural forest is not considered as part of the NFI; * ref. 40 and ref. 41).
Extended Data Fig. 4 Comparison of aboveground carbon estimations at country scale. a, Comparison of predicted total aboveground carbon stocks by this study, NFI and existing global products for non-forest areas. b, Same as (a) but for natural forests. c, Comparison of predicted aboveground carbon density by this study, NFI, and existing global products for non-forest areas. d, Same as (c) but for natural forests. e, Correlation matrix showing the two-tailored Pearson correlation for 1×1 km2 grids between different biomass datasets. Note that ref. 45 does not report values above 85 Mg biomass per hectare (Supplementary Fig. 2), explaining the lower correlation values. P < 0.001 for all correlations. (^ We selected the 2010 version; - Natural forest is not considered as part of the NFI; * ref. 40 and ref. 41).CC BY · PubMed Central
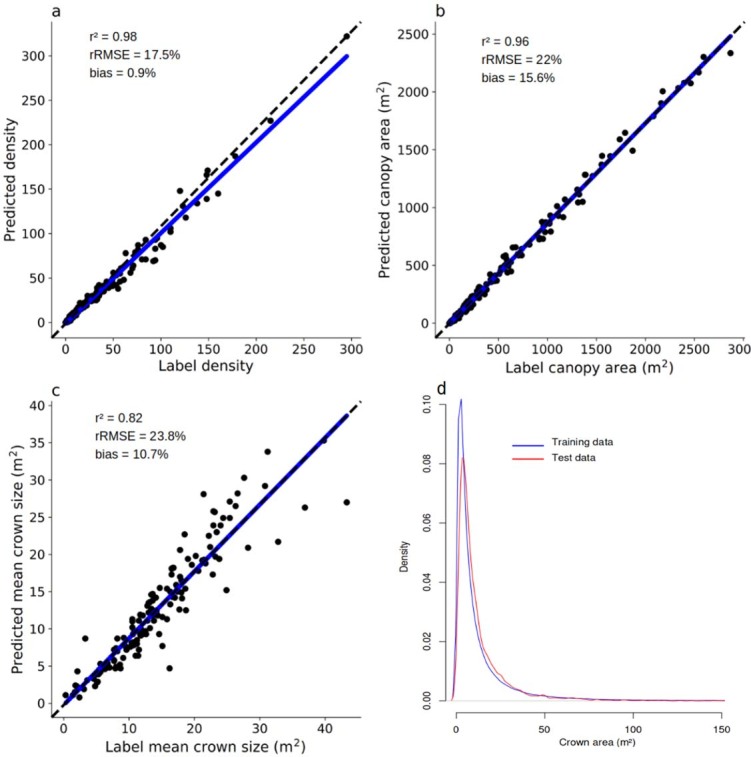
Extended Data Fig. 5 Tree crown model evaluation at plot level. We manually labelled 6,591 trees and compared predictions and labelled trees at plot level. a, Tree density, b, canopy area, c, mean crown size. Each point represents one 25×25 m grid, n = 153. The bias was calculated following equation (2). d, Density distribution of the crown areas in the training and test dataset.
Extended Data Fig. 5 Tree crown model evaluation at plot level. We manually labelled 6,591 trees and compared predictions and labelled trees at plot level. a, Tree density, b, canopy area, c, mean crown size. Each point represents one 25×25 m grid, n = 153. The bias was calculated following equation (2). d, Density distribution of the crown areas in the training and test dataset.CC BY · PubMed Central
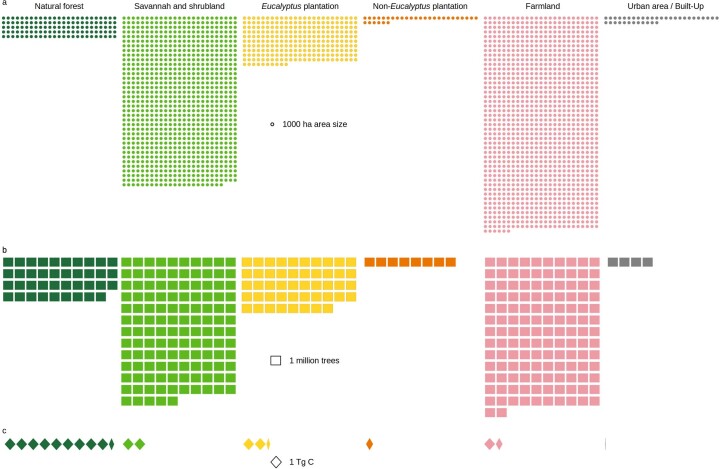
Extended Data Fig. 6 Visual illustration of tree count and carbon stock per land cover type in Rwanda. a, Area size (1000 ha) covered by different land cover types, and b, tree count per land cover type (million trees), and c, carbon stocks per land cover type (TgC). Although natural forests cover a small portion of land, they are home to a remarkable number of trees with the largest C stocks of the country.
Extended Data Fig. 6 Visual illustration of tree count and carbon stock per land cover type in Rwanda. a, Area size (1000 ha) covered by different land cover types, and b, tree count per land cover type (million trees), and c, carbon stocks per land cover type (TgC). Although natural forests cover a small portion of land, they are home to a remarkable number of trees with the largest C stocks of the country.CC BY · PubMed Central
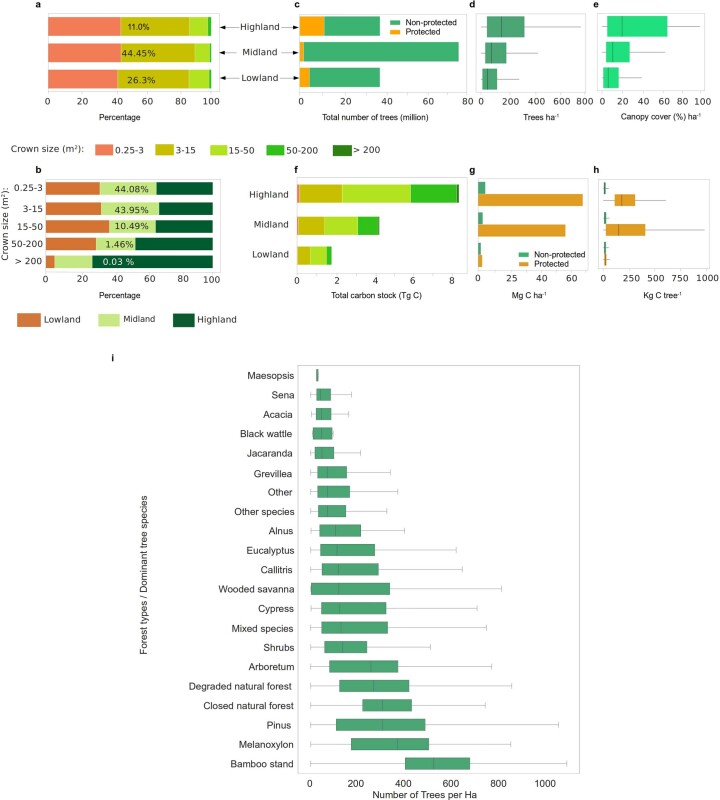
Extended Data Fig. 7 Tree properties of different landscape types. a, Percentage covered by different crown sizes in each landscape type. The percent number shows the contribution of the landscape type to the total area. b, Percentage covered by each landscape type in different crown size categories. c, Total count of trees by landscape type. d, Boxplot showing the average number of trees per ha by landscape type. e, Same as d but for tree cover. f, Total estimated carbon stock per landscape type. g, Barplots showing the distribution of average carbon stock per ha per landscape type, and h, boxplots showing the average carbon stock per tree per landscape type. i, Average tree density per tree species in Rwanda. Species data are from Rwanda national forest map of 201251. In boxplots in d, e and h (from left to right), the start of the horizontal line represents the minimum value, vertical lines represents first quartile, median and third quartile values respectively, and the end of the horizontal line represents the maximum value. In i, lines from left to right represent the minimum, first quartile, median, third quartile and maximum values. Number of trees = 355,268,345.
Extended Data Fig. 7 Tree properties of different landscape types. a, Percentage covered by different crown sizes in each landscape type. The percent number shows the contribution of the landscape type to the total area. b, Percentage covered by each landscape type in different crown size categories. c, Total count of trees by landscape type. d, Boxplot showing the average number of trees per ha by landscape type. e, Same as d but for tree cover. f, Total estimated carbon stock per landscape type. g, Barplots showing the distribution of average carbon stock per ha per landscape type, and h, boxplots showing the average carbon stock per tree per landscape type. i, Average tree density per tree species in Rwanda. Species data are from Rwanda national forest map of 201251. In boxplots in d, e and h (from left to right), the start of the horizontal line represents the minimum value, vertical lines represents first quartile, median and third quartile values respectively, and the end of the horizontal line represents the maximum value. In i, lines from left to right represent the minimum, first quartile, median, third quartile and maximum values. Number of trees = 355,268,345.CC BY · PubMed Central
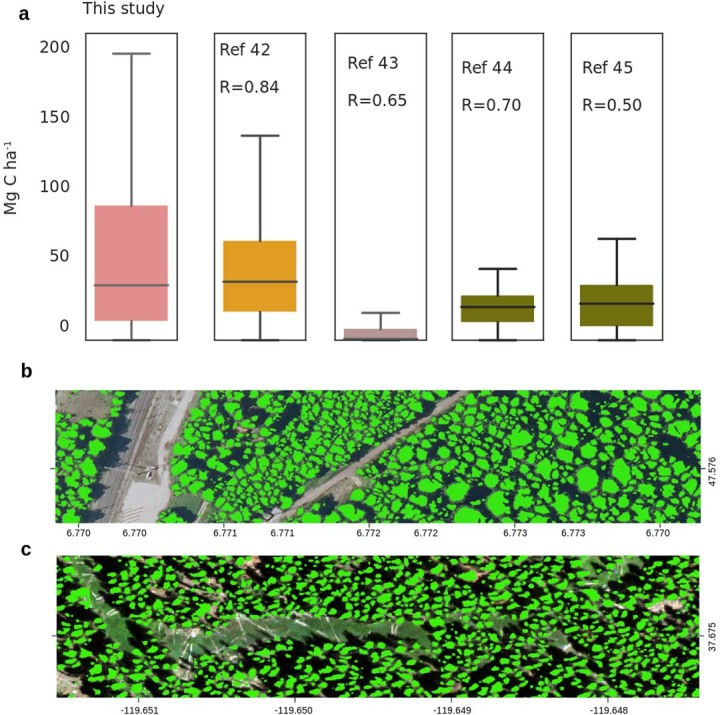
Extended Data Fig. 8 Beyond Rwanda. a, We took 150 (n = 150) random 1 × 1 km samples and aggregated the predicted tree-level carbon stocks and compared the results to previously published maps using two-tailored Pearson correlation. We did not include ref. 61 because of the coarse native resolution which did not guarantee that the same areas were compared. Note that ref. 45 does not report values above 85 Mg biomass per hectare, explaining the lower correlation values. P < 0.001 for all correlations. b, The model trained on the Rwanda aerial images was directly applied on aerial images from France (20 cm) and c, NAIP aerial images at 60 cm. In boxplots in a, lines from top to bottom represent the maximum, third quartile, median, first quartile and minimum values. Credit: photographs in b, USGS NAIP; c, IGN France.
Extended Data Fig. 8 Beyond Rwanda. a, We took 150 (n = 150) random 1 × 1 km samples and aggregated the predicted tree-level carbon stocks and compared the results to previously published maps using two-tailored Pearson correlation. We did not include ref. 61 because of the coarse native resolution which did not guarantee that the same areas were compared. Note that ref. 45 does not report values above 85 Mg biomass per hectare, explaining the lower correlation values. P < 0.001 for all correlations. b, The model trained on the Rwanda aerial images was directly applied on aerial images from France (20 cm) and c, NAIP aerial images at 60 cm. In boxplots in a, lines from top to bottom represent the maximum, third quartile, median, first quartile and minimum values. Credit: photographs in b, USGS NAIP; c, IGN France.CC BY · PubMed Central

Verification

Claims the paper makes

The claims and statistics of this paper haven’t been checked yet.

Run the check — free, no account needed. It reads the open-access text and checks the sources it cites.

A few free checks a day · papers already verified open instantly · results are public

Claims other papers make about this one

Each is checked against this paper’s own text: does it say what the citing paper says it does?

Self-check

Percentages, sums and reported differences re-computed from the paper’s own numbers.

The self-check needs the paper’s full text.

Citations

Cites

Research works printed but not linked: 46

  1. Morin, X. et al. Long-term response of forest productivity to climate change is mostly driven by change in tree species composition. Sci. Rep. 8, 5627 (2018). · DOI
  2. Tong, X. et al. Forest management in southern China generates short term extensive carbon sequestration. Nat. Commun. 11, 129 (2020). · DOI
  3. Tomppo, E. et al. (eds) National Forest Inventories Pathways for Common Reporting (Springer, 2010). · DOI
  4. Report of the Conference of the Parties on its Twenty-First Session (UNFCCC, 2016).
  5. Stanturf, J. A. et al. Implementing forest landscape restoration under the Bonn Challenge: a systematic approach. Ann. For. Sci. 76, 50 (2019). · DOI
  6. Naesset, E. et al. Mapping and estimating forest area and aboveground biomass in Miombo woodlands in Tanzania using data from airborne laser scanning, TanDEM-X, RapidEye, and global forest maps: a comparison of estimated precision. Remote Sens. Environ. 175, 282–300 (2016). · DOI
  7. Laurin, G. V. et al. Above ground biomass estimation in an African tropical forest with lidar and hyperspectral data. ISPRS J. Photogram. Remote Sens. 89, 49–58 (2014). · DOI
  8. Aleman, J. et al. Tree cover in Central Africa: determinants and sensitivity under contrasted scenarios of global change. Sci. Rep. 7, 41393 (2017). · DOI
  9. Félix, G. F. et al. Use and management of biodiversity by smallholder farmers in semi-arid West Africa. Glob. Food Sec. 18, 76–85 (2018). · DOI
  10. Rodríguez-Veiga, P. et al. Forest biomass retrieval approaches from earth observation in different biomes. Int. J. Appl. Earth Obs. Geoinf. 77, 53–68 (2019).
  11. Vancutsem, C. et al. Long-term (1990–2019) monitoring of forest cover changes in the humid tropics. Sci. Adv. 7, eabe1603 (2021). · DOI
  12. Brandt, M. et al. An unexpectedly large count of trees in the West African Sahara and Sahel. Nature 587, 78–82 (2020). · DOI · Paper page
  13. Schnell, S., Kleinn, C. & Ståhl, G. Monitoring trees outside forests: a review. Environ. Monit. Assess. 187, 600 (2015). · DOI
  14. Mertz, O. et al. Uncertainty in establishing forest reference levels and predicting future forest-based carbon stocks for REDD+. J. Land Use Sci. 13, 1–15 (2018). · DOI
  15. Rinaldi, F. & Johnson, R. Accounting for uncertainty in forest management models. For. Ecol. Manag. 468, 118186 (2020). · DOI
  16. Gross, D. et al. Uncertainties in tree cover maps of sub-Saharan Africa and their implications for measuring progress towards CBD Aichi targets. Remote Sens. Ecol. Conserv. 4, 94–112 (2018). · DOI
  17. From Reference Levels to Results Reporting: REDD+ Under the United Nations Framework Convention on Climate Change—2020 Update (FAO, 2020); https://doi.org/10.4060/cb1635en · DOI
  18. Ross, C. W. et al. Woody-biomass projections and drivers of change in sub-Saharan Africa. Nat. Clim. Change 11, 449–455 (2021). · DOI
  19. Hansen, A. J. et al. A policy-driven framework for conserving the best of Earth’s remaining moist tropical forests. Nat. Ecol. Evol. 4, 1377–1384 (2020). · DOI
  20. Aleman, J. C., Jarzyna, M. A. & Staver, A. C. Forest extent and deforestation in tropical Africa since 1900. Nat. Ecol. Evol. 2, 26–33 (2018). · DOI
  21. Benioff, R. et al. Low Emission Development Strategies: The Role of Networks and Knowledge Platforms (US Department of Energy, 2013). · DOI
  22. Mirzabaev, A. et al. Economic efficiency and targeting of the African Great Green Wall. Nat. Sustain. 5, 17–25 (2022). · DOI
  23. Niang, I. et al. in Climate Change 2014: Impacts, Adaptation, and Vulnerability (eds Barros, V.R. et al.) 1199–1265 (Cambridge Univ. Press, 2014).
  24. Nduwamungu, J. et al. Rwanda Forest Cover Mapping Using High Resolution Aerial Photographs (The Global Geospatial Conference, 2013).
  25. Jucker, T. et al. Allometric equations for integrating remote sensing imagery into forest monitoring programmes. Glob. Change Biol. 23, 177–190. · DOI · Paper page
  26. Kuyah, S. et al. Allometric equations for estimating biomass in agricultural landscapes: I. Aboveground biomass. Agric. Ecosyst. Environ. 158, 216–224 (2012). · DOI
  27. Chave, J. et al. Improved allometric models to estimate the aboveground biomass of tropical trees. Glob. Change Biol. 20, 3177–3190 (2014). · DOI · Paper page
  28. Mukuralinda, A., Kuyah, S. & Ruzibiza, M. Allometric equations, wood density and partitioning of aboveground biomass in the arboretum of Ruhande, Rwanda. Trees For. People 3, 100050 (2021). · DOI
  29. Nyirambangutse, B. et al. Carbon stocks and dynamics at different successional stages in an Afromontane tropical forest. Biogeosciences 14, 1285–1303 (2017). · DOI
  30. Cuni-Sanchez, A. et al. High aboveground carbon stock of African tropical montane forests. Nature 596, 536–542 (2021). · DOI
  31. Xu, L. et al. Changes in global terrestrial live biomass over the 21st century. Sci. Adv. 7, eabe9829 (2021).https://doi.org/10.1126/sciadv.abe9829 · DOI
  32. Santoro, M. & Cartus, O. ESA Biomass Climate Change Initiative (Biomass_cci): Global Datasets of Forest Above-Ground Biomass for the Years 2010, 2017 and 2018, V2 (CEDA, 2021); https://doi.org/10.5285/84403d09cef3485883158f4df2989b0c · DOI
  33. Bouvet, A. et al. An above-ground biomass map of African savannahs and woodlands at 25m resolution derived from ALOS PALSAR. Remote Sens. Environ. 206, 156–173 (2018). · DOI
  34. Castilla, G. & Hay, G. J. Uncertainties in land use data. Hydrol. Earth Syst. Sci. 11, 1857–1868 (2007). · DOI
  35. Bastin, J.-F. et al. The extent of forest in dryland biomes. Science 356, 635–638 (2017). · DOI
  36. Skole, D. L. et al. The contribution of trees outside of forests to landscape carbon and climate change mitigation in West Africa. Forests 12, 1652 (2021). · DOI
  37. Romijn, E. et al. Independent data for transparent monitoring of greenhouse gas emissions from the land use sector—what do stakeholders think and need. Environ. Sci. Policy 85, 101–112 (2018). · DOI
  38. Skole, D. L. et al. Trees outside of forests as natural climate solutions. Nat. Clim. Change 11, 1013–1016 (2021). · DOI
  39. Koch, T. et al. Accurate segmentation of dental panoramic radiographs with U-Nets. In Proc. IEEE International Symposium on Biomedical Imaging (ISBI) (eds Davis, L. et al.) 15–19 (IEEE Computer Society, 2019).https://doi.org/10.1109/ISBI.2019.8759563 · DOI
  40. Brown, S., Gillespie, A. J. R. & Lugo, A. E. Biomass estimation methods for tropical forests and the application to forest inventory data. For. Sci. 35, 881–902 (1989).
  41. Chave, J. et al. Tree allometry and improved estimation of carbon stocks and balance in tropical forests. Oecologia 145, 87–99 (2005). · DOI
  42. Martin, A. R., Doraisami, M. & Thomas, S. C. Global patterns in wood carbon concentration across the world’s trees and forests. Nat. Geosci. 11, 915–920 (2018). · DOI
  43. Baskerville, G. L. Use of logarithmic regression in the estimation of plant biomass. Can. J. For. Res. 2, 49–53 (1972). · DOI
  44. Djomo, A. N. & Chimi, C. D. Tree allometric equations for estimation of above, below and total biomass in a tropical moist forest: case study with application to remote sensing. For. Ecol. Manag. 381, 184–193 (2017). · DOI
  45. Hanan, N.P., Prihodko, L., Ross, C.W., Bucini, G. & Tredennick, A.T. Gridded Estimates of Woody Cover and Biomass across Sub-Saharan Africa, 2000–2004 (ORNL DAAC, 2020); https://doi.org/10.3334/ORNLDAAC/1777 · DOI
  46. Chave, J. et al. Towards a worldwide wood economics spectrum. Ecol. Lett. 12, 351–366 (2009). · DOI

Cited by

Sorted by citations

See all 126

Metadata

Authors
Mugabowindekwe, M., Brandt, M., Chave, J., Reiner, F., Skole, D. L., Kariryaa, A., Igel, C., Hiernaux, P., Ciais, P., Mertz, O., Tong, X., Li, S., Rwanyiziri, G., Dushimiyimana, T., Ndoli, A., Uwizeyimana, V., Lillesø, J.-P. B., Gieseke, F., Tucker, C. J., Saatchi, S., & Fensholt, R.
Venue
Nature Climate Change
Published
2022-12-22
Volume
13
Issue
1
Pages
91-97
ISSN
  • 1758-678X
  • 1758-6798
Cited by
126
References
6
Language
en

About these checks

Registry, retraction, Cites and statistics results are computed, not judged, with one exception: a printed reference that no index lists is read once by a model before it counts as a citation error. Claims are extracted by a model and kept only when their quote appears verbatim in the text; each cited source is then checked, with a model’s help, for whether it says what the claim relies on. Those verdicts can be wrong — read the claim’s quote and the cited source before relying on one.

Statistics and arithmetic are recomputed, not judged.

Confidence bands are shown only for fields calibrated on our annotated test set. None is calibrated yet, so no band is shown.

What counts as a claim ›How we measure confidence ›How we check this ›

Are you an author, or do you see a problem with this page? Request a review