Student or educator? Sign up with your school email and get 6 months of Pro free.
CoChat

The DOI matches its Crossref record; the references it cites are not checked yet.

Vision–language foundation model for echocardiogram interpretation

Open access
Christensen, Matthew, Vukadinovic, Milos, Yuan, Neal, Ouyang, David · 2024 · Nature Medicine

Abstract

The development of robust artificial intelligence models for echocardiography has been limited by the availability of annotated clinical data. Here, to address this challenge and improve the performance of cardiac imaging models, we developed EchoCLIP, a vision–language foundation model for echocardiography, that learns the relationship between cardiac ultrasound images and the interpretations of expert cardiologists across a wide range of patients and indications for imaging. After training on 1,032,975 cardiac ultrasound videos and corresponding expert text, EchoCLIP performs well on a diverse range of benchmarks for cardiac image interpretation, despite not having been explicitly trained for individual interpretation tasks. EchoCLIP can assess cardiac function (mean absolute error of 7.1% when predicting left ventricular ejection fraction in an external validation dataset) and identify implanted intracardiac devices (area under the curve (AUC) of 0.84, 0.92 and 0.97 for pacemakers, percutaneous mitral valve repair and artificial aortic valves, respectively). We also developed a long-context variant (EchoCLIP-R) using a custom tokenizer based on common echocardiography concepts. EchoCLIP-R accurately identified unique patients across multiple videos (AUC of 0.86), identified clinical transitions such as heart transplants (AUC of 0.79) and cardiac surgery (AUC 0.77) and enabled robust image-to-text search (mean cross-modal retrieval rank in the top 1% of candidate text reports). These capabilities represent a substantial step toward understanding and applying foundation models in cardiovascular imaging for preliminary interpretation of echocardiographic findings.

Overview

The claims and statistics of this paper haven’t been checked yet.

Free: it reads the open-access text and checks the first 5 claims that cite a source we can check. Create a free account to check every claim.

A few free checks a day · papers already verified open instantly · results are public

Integrity signals

Registry

Crossref · 10.1038/s41591-024-02959-y

Cites

Statistics

Figures

Fig. 1 EchoCLIP workflow. a, EchoCLIP is a foundation model trained on more than 1 million echocardiogram videos across 11 years. It is composed of an image encoder for processing echocardiogram video frames and a text encoder for processing the corresponding physician interpretations. These two encoders project the images and interpretations onto a joint embedding space. b, Scatter-plot of zero-shot prediction versus label of left ventricular ejection fraction (LVEF) in held-out test dataset from Cedars-Sinai Medical Center (CSMC; blue, n = 100,994) and Stanford Healthcare (SHC; red, n = 5,000). c, AUC performance for various implanted intracardiac devices, including MitraClip, TAVR valves and implanted pacemaker/defibrillator on held-out test dataset from Cedars-Sinai Medical Center. FPR, false positive rate; TPR, true positive rate.
Fig. 1 EchoCLIP workflow. a, EchoCLIP is a foundation model trained on more than 1 million echocardiogram videos across 11 years. It is composed of an image encoder for processing echocardiogram video frames and a text encoder for processing the corresponding physician interpretations. These two encoders project the images and interpretations onto a joint embedding space. b, Scatter-plot of zero-shot prediction versus label of left ventricular ejection fraction (LVEF) in held-out test dataset from Cedars-Sinai Medical Center (CSMC; blue, n = 100,994) and Stanford Healthcare (SHC; red, n = 5,000). c, AUC performance for various implanted intracardiac devices, including MitraClip, TAVR valves and implanted pacemaker/defibrillator on held-out test dataset from Cedars-Sinai Medical Center. FPR, false positive rate; TPR, true positive rate.CC BY · PubMed Central
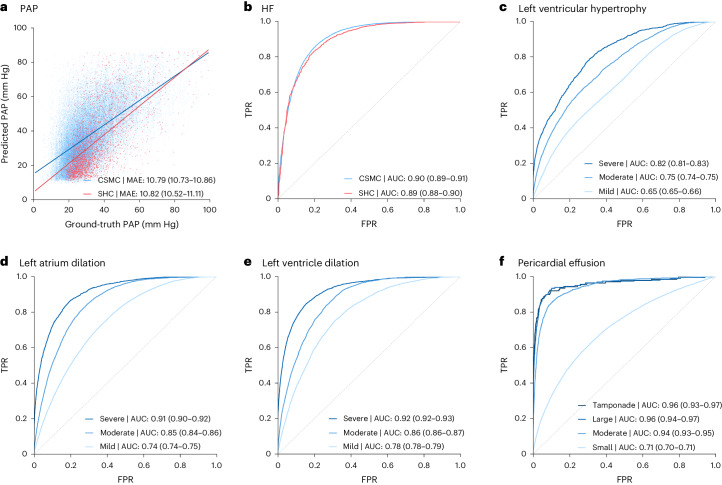
Fig. 2 Zero-shot model performance on held-out test apical-four-chamber videos. a, Estimation of pulmonary artery pressure (PAP). b, Heart failure (HF) with reduced ejection fraction. c, Assessment of left ventricular hypertrophy at various degrees of severity (mild, moderate and severe). d, Left atrial dilation at various degrees of severity (mild, moderate and severe). e, Left ventricular dilation at various degrees of severity (mild, moderate and severe). f, Assessment of pericardial effusion size (small, moderate and large) as well as presence of tamponade physiology. Data are from the Cedars-Sinai Medical Center (CSMC; blue, n = 100,994) and Stanford Healthcare (SHC; red, n = 5,000). FPR, false positive rate; TPR, true positive rate.
Fig. 2 Zero-shot model performance on held-out test apical-four-chamber videos. a, Estimation of pulmonary artery pressure (PAP). b, Heart failure (HF) with reduced ejection fraction. c, Assessment of left ventricular hypertrophy at various degrees of severity (mild, moderate and severe). d, Left atrial dilation at various degrees of severity (mild, moderate and severe). e, Left ventricular dilation at various degrees of severity (mild, moderate and severe). f, Assessment of pericardial effusion size (small, moderate and large) as well as presence of tamponade physiology. Data are from the Cedars-Sinai Medical Center (CSMC; blue, n = 100,994) and Stanford Healthcare (SHC; red, n = 5,000). FPR, false positive rate; TPR, true positive rate.CC BY · PubMed Central
Fig. 3 Assessment of clinical similarity. a, Average cosine similarity between embeddings from different patients, same patients at different times and same patients at the same time point. Center lines indicate the median, boxes span from the first to the third quartile and whiskers stretch 1.5 × the interquartile range (n = 100,994). b, AUC for predicting whether the images come from the same patient when compared to another image (n = 100,994). c,d, Trajectory of individual patients by cosine similarity (n = 2,959). Each line represents an individual patient with time from major clinical event on the x axis and cosine similarity versus first study on the y axis. Patients either had major cardiac surgery (c) or heart transplant (d), with cosine similarity calculated at the study level and pairwise compared for all videos in each study. Data are from the Cedars-Sinai Medical Center. FPR, false positive rate; TPR, true positive rate.
Fig. 3 Assessment of clinical similarity. a, Average cosine similarity between embeddings from different patients, same patients at different times and same patients at the same time point. Center lines indicate the median, boxes span from the first to the third quartile and whiskers stretch 1.5 × the interquartile range (n = 100,994). b, AUC for predicting whether the images come from the same patient when compared to another image (n = 100,994). c,d, Trajectory of individual patients by cosine similarity (n = 2,959). Each line represents an individual patient with time from major clinical event on the x axis and cosine similarity versus first study on the y axis. Patients either had major cardiac surgery (c) or heart transplant (d), with cosine similarity calculated at the study level and pairwise compared for all videos in each study. Data are from the Cedars-Sinai Medical Center. FPR, false positive rate; TPR, true positive rate.CC BY · PubMed Central
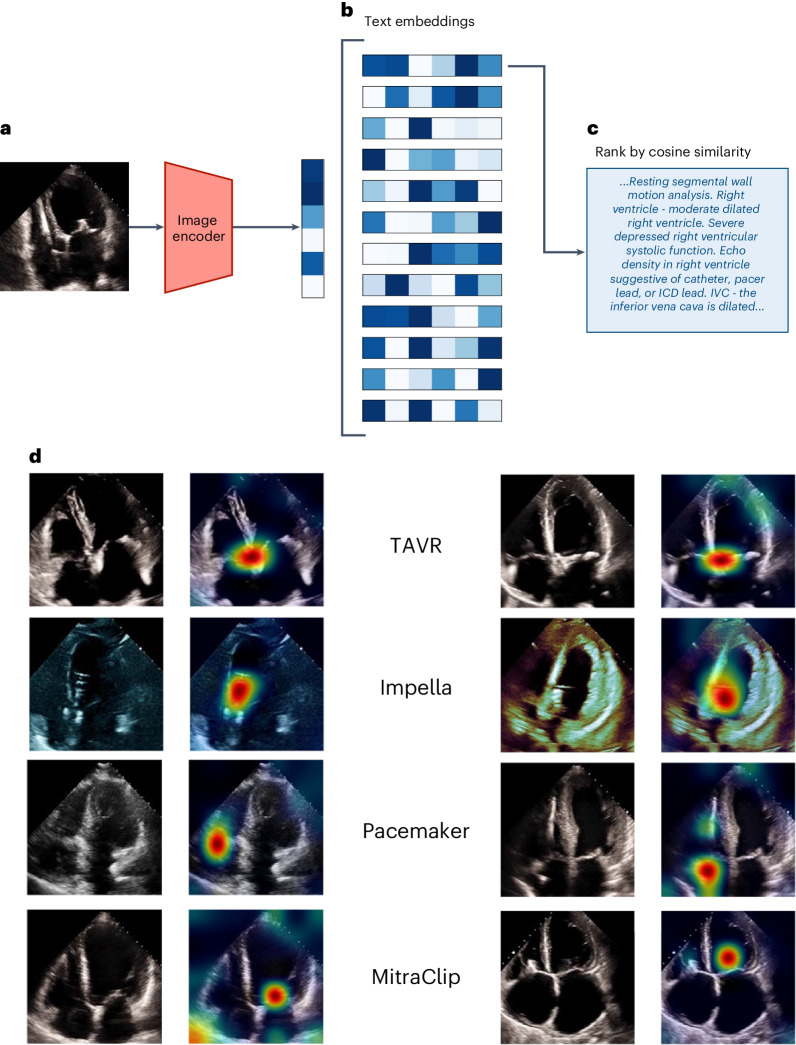
Fig. 4 Image-to-text semantic search. a, The query image is first embedded using EchoCLIP-R’s image encoder. b, Then, the similarities between this query embedding and the embeddings of all 21,484 unique text reports in the test set are computed. c, The reports are ranked by their similarity to the query image embedding and the report with the highest similarity is retrieved. d, Corresponding pairs of input frames and PromptCAM visualization of the indicated intracardiac devices in the text report label (color intensity ranging from red for most important to green for less important and no color for not important).
Fig. 4 Image-to-text semantic search. a, The query image is first embedded using EchoCLIP-R’s image encoder. b, Then, the similarities between this query embedding and the embeddings of all 21,484 unique text reports in the test set are computed. c, The reports are ranked by their similarity to the query image embedding and the report with the highest similarity is retrieved. d, Corresponding pairs of input frames and PromptCAM visualization of the indicated intracardiac devices in the text report label (color intensity ranging from red for most important to green for less important and no color for not important).CC BY · PubMed Central
Extended Data Fig. 1 Frame level ensembling. (a) Distribution of EchoCLIP left ventricular ejection fraction (LVEF) from individual frames of an echocardiogram video, which are averaged to (b) a video-level distribution of LVEF prediction. (c) Scatter-plot of subset of test dataset (n = 1,000 predictions from 100 videos and 10 frames per video) representing predicted vs. ground-truth LVEF. Each point represents the final predicted values and whiskers represent the range of frame level predictions for that video.
Extended Data Fig. 1 Frame level ensembling. (a) Distribution of EchoCLIP left ventricular ejection fraction (LVEF) from individual frames of an echocardiogram video, which are averaged to (b) a video-level distribution of LVEF prediction. (c) Scatter-plot of subset of test dataset (n = 1,000 predictions from 100 videos and 10 frames per video) representing predicted vs. ground-truth LVEF. Each point represents the final predicted values and whiskers represent the range of frame level predictions for that video.CC BY · PubMed Central

Verification

Claims the paper makes

The claims and statistics of this paper haven’t been checked yet.

Free: it reads the open-access text and checks the first 5 claims that cite a source we can check. Create a free account to check every claim.

A few free checks a day · papers already verified open instantly · results are public

Self-check

Percentages, sums and reported differences re-computed from the paper’s own numbers.

The self-check needs the paper’s full text.

Citations

The citation lists are queued

They are fetched later and appear here then.

References 37 · Cited by 231

Research works printed but not linked: 2

  1. Radford, A. et al. Learning transferable visual models from natural language supervision. in Proc. 38th International Conference on Machine Learning Vol. 139 (PMLR, 2021).
  2. Larochelle, H., Erhan, D. & Bengio, Y. Zero-data learning of new tasks. in Proc. 23rd AAAI Conference on Artificial Intelligence (AAAI, 2008).

Metadata

Authors
Christensen, M., Vukadinovic, M., Yuan, N., & Ouyang, D.
Affiliations
  • Cedars-Sinai Medical Center (US)
  • San Francisco VA Medical Center (US)
Corresponding author
Ouyang, David
Venue
Nature Medicine
Published
2024-04-30
Volume
30
Issue
5
Pages
1481-1488
ISSN
  • 1078-8956 (ISSN-L)
  • 1546-170X
OpenAlex
W4396494945
Cited by
231
References
37
Citations by year
2026: 102 · 2025: 115 · 2024: 14
FWCI
32.18
Type
journal article
Language
en
Open access
Licence
Locations
  • Nature Medicine (publishedVersion, cc-by)
  • PubMed Central (publishedVersion, cc-by)
  • PubMed (publishedVersion)
  • eScholarship (California Digital Library) (submittedVersion, cc-by)
Funders
U.S. Department of Health & Human Services | NIH | National Heart, Lung, and Blood Institute (4R00HL157421-03)
Topics
  • Physical Sciences › Computer Science › Computer Vision and Pattern Recognition › Multimodal Machine Learning Applications
  • Health Sciences › Medicine › Health Informatics › Artificial Intelligence in Healthcare and Education
  • Health Sciences › Health Professions › Health Information Management › Artificial Intelligence in Healthcare
Keywords
vision-language foundation models, echocardiography, cardiac pacemaker, transcatheter mitral valve repair, image-to-text retrieval, cardiac function assessment, cardiovascular imaging
MeSH terms
Artificial Intelligence, Echocardiography, Humans, Image Interpretation, Computer-Assisted

About these checks

Registry, retraction, Cites and statistics results are computed, not judged, with one exception: a printed reference that no index lists is read once by a model before it counts as a citation error. Claims are extracted by a model and kept only when their quote appears verbatim in the text; each cited source is then checked, with a model’s help, for whether it says what the claim relies on. Those verdicts can be wrong — read the claim’s quote and the cited source before relying on one.

Statistics and arithmetic are recomputed, not judged.

Confidence bands are shown only for fields calibrated on our annotated test set. None is calibrated yet, so no band is shown.

What counts as a claim ›How we measure confidence ›How we check this ›

Are you an author, or do you see a problem with this page? Request a review

How to cite

Cite CoChat for the checks on this page, and the paper for its own findings.

This page
CoChat. (2026). Citation check: Vision–language foundation model for echocardiogram interpretation. https://app.cochat.ai/papers/10.1038/s41591-024-02959-y
The paper
Christensen, M., Vukadinovic, M., Yuan, N., & Ouyang, D. (2024). Vision–language foundation model for echocardiogram interpretation. Nature Medicine. https://doi.org/10.1038/s41591-024-02959-y

Data sources

Bibliographic data: Semantic Scholar, OpenAlex, Crossref.

Contains information from the Semantic Scholar Academic Graph Datasets, made available under the ODC Attribution License (ODC-BY 1.0).

Semantic Scholar’s data is described in: Kinney, R., et al. (2023). The Semantic Scholar Open Data Platform. arXiv:2301.10140.