

The DOI matches its Crossref record; 65 of the 65 references it cites were found in a registry or an index; none of the 16 sources its claims cite is checked for support yet.
The Connection of the Genetic, Cultural and Geographic Landscapes of Transoxiana
Open accessAbstract
We have analyzed Y-chromosomal variation in populations from Transoxiana, a historical region covering the southwestern part of Central Asia. We studied 780 samples from 10 regional populations of Kazakhs, Uzbeks, Turkmens, Dungans, and Karakalpaks using 35 SNP and 17 STR markers. Analysis of haplogroup frequencies using multidimensional scaling and principal component plots, supported by an analysis of molecular variance, showed that the geographic landscape of Transoxiana, despite its distinctiveness and diversity (deserts, fertile river basins, foothills and plains) had no strong influence on the genetic landscape. The main factor structuring the gene pool was the mode of subsistence: settled agriculture or nomadic pastoralism. Investigation of STR-based clusters of haplotypes and their ages revealed that cultural and demic expansions of Transoxiana were not closely connected with each other. The Arab cultural expansion introduced Islam to the region but did not leave a significant mark on the pool of paternal lineages. The Mongol expansion, in contrast, had enormous demic success, but did not impact cultural elements like language and religion. The genealogy of Muslim missionaries within the settled agricultural communities of Transoxiana was based on spiritual succession passed from teacher to disciple. However, among Transoxianan nomads, spiritual and biological succession became merged.
Overview
CoChat Summary
Written by AI from the paper’s full text.
TL;DR
Y-chromosomal analysis of 780 individuals from 10 Transoxianan populations found that mode of subsistence—settled agriculture versus nomadic pastoralism—structured paternal genetic variation more than geography. Arab cultural expansion left little paternal mark, whereas Mongol expansion had strong demic effects without replacing local language or religion.
Key findings
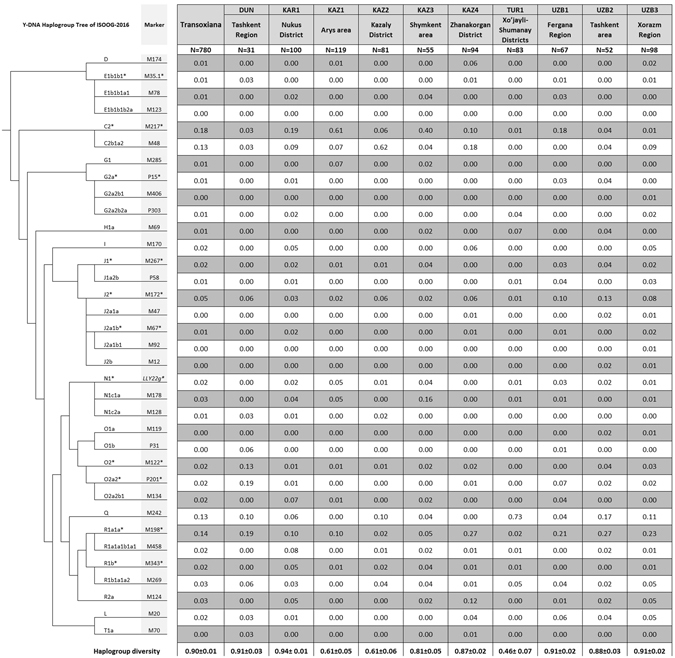
- Among 780 samples typed for 35 SNPs and 17 STRs, 58% of Y-chromosomes belonged to three haplogroups: C2-M217 (31%), R1a1a-M198 (16%), and Q-M242 (13%).
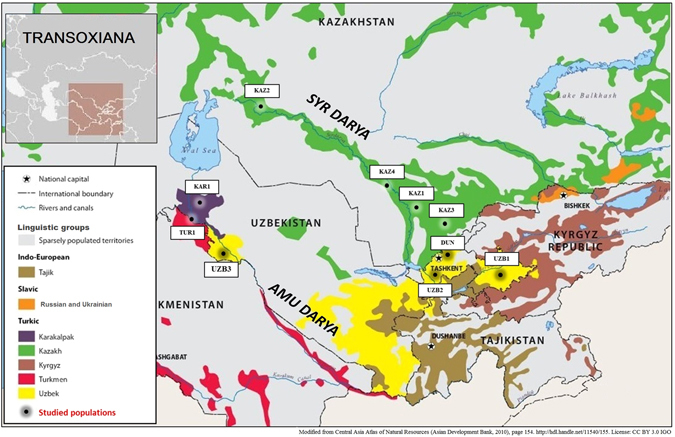
- Geography had little influence: AMOVA among-group variation was −0.22% for Amu Darya/Syr Darya basins and 1.05% for foothills/plain, while mode of subsistence explained 2.85% of variation; a Mantel test found no correlation between genetic and geographic distances (Yr = −0.006, p = 0.44).
- Mongol-related expansions were demic: three of four modal-haplotype clusters were linked to Mongol populations, with ages such as 600 ± 200, 800 ± 200, 1100 ± 400, and 1100 ± 300 years, but present-day Transoxianan populations mostly speak Turkic languages and practice Islam.
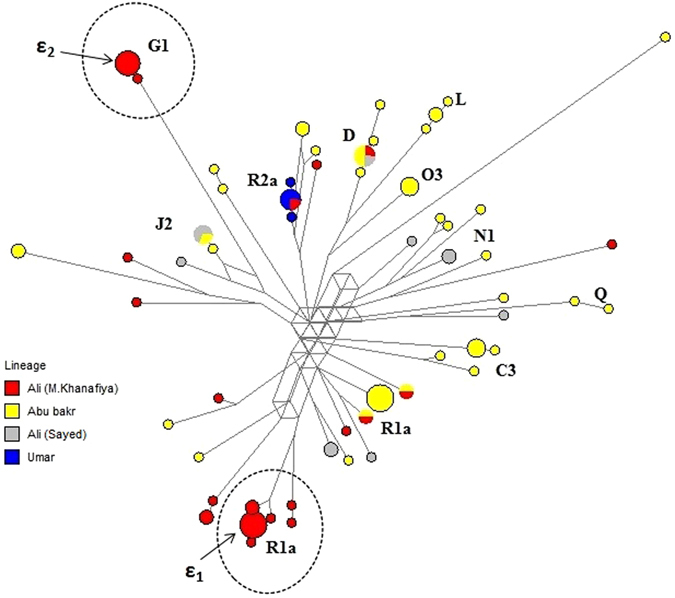
- The Kozha-Sunak clergy group was highly heterogeneous (HD = 0.86; pairwise differences 8–9 versus 1–7 in other Transoxianan subclans), lacked J1-M267, and showed no single Arab paternal founder, suggesting spiritual succession rather than biological descent among settled communities.
Methods
- Blood samples were collected in 2009–2012 from 780 unrelated individuals in 10 regional populations of Kazakhs, Uzbeks, Turkmens, Dungans, and Karakalpaks, with ancestry requirements and written informed consent.
- Genotyping used 35 Y-chromosomal SNP markers and 17 Y-STR loci; haplogroups were classified according to ISOGG-2016.
- Analyses included MDS with 5,998 samples from 79 populations, PCA with 1,944 samples from 33 Central Asian populations, AMOVA, Mantel tests, median-joining/Reduced-Median networks, and cluster dating by rho and ASD with a 2.1 × 10⁻³ STR mutation rate and 30-year generation time.
Limitations
- The paper does not include an explicit limitations section.
- Evident from the text: the AMOVA among-group result for mode of subsistence was p = 0.096, not below the conventional 0.05 threshold, despite being described as a significant impact.
- Evident from the text: the study is based only on paternal Y-chromosome markers, some populations are represented by a single regional sample (KAR1, TUR1, DUN), and cluster ages depend on mutation-rate, generation-time, and <5-mutational-step clustering assumptions.
Model-written summary. Check it against the paper before relying on it.
Integrity signals
Registry
Cites
Statistics
Figures
Verification
Claims the paper makes
36 Own result · 25 Own interpretation · 6 No full text of the sources · 2 Check pending · 1 Sources not found · 1 Not checked yet · 1 Own method
A result the paper reports from its own data — it cites no other source for it, so there is none to check. The quote shows it is in the paper.
In the paper
“Cluster γ is prevalent among Mongolian-speaking Kalmyks and in Mongolia itself.”
§ The Connection of the Genetic, Cultural and Geographic Landscapes of Transoxiana > Results and Discussion > Arab and Mongol expansions: migration of cultures or populations?
plainstates an association- Asserted: passes — The authors put it forward as true.
- Checkable: passes — It can be checked against evidence.
- Load-bearing: passes — The paper’s conclusions depend on it.
- Based: passes — The paper gives a reason why it holds.
A result the paper reports from its own data — it cites no other source for it, so there is none to check. The quote shows it is in the paper.
In the paper
“Subcluster λ, aged 400 ± 100 years old, is specific for Hazara from various countries and can be distinguished within the cluster.”
§ The Connection of the Genetic, Cultural and Geographic Landscapes of Transoxiana > Results and Discussion > Arab and Mongol expansions: migration of cultures or populations?
plainstates an association- Asserted: passes — The authors put it forward as true.
- Checkable: passes — It can be checked against evidence.
- Load-bearing: unclear — It is unclear whether the paper’s conclusions depend on it.
- Based: passes — The paper gives a reason why it holds.
A result the paper reports from its own data — it cites no other source for it, so there is none to check. The quote shows it is in the paper.
In the paper
“More than half of the Transoxianan Y-chromosomes (58%) falls into three haplogroups (Fig. 2): C2-М217 (31%), R1a1a-M198 (16%), and Q-M242 (13%), although the distribution of these haplogroups in Transoxiana is uneven.”
§ The Connection of the Genetic, Cultural and Geographic Landscapes of Transoxiana > Results and Discussion > Genetic portraits of populations and tribal/clan groups of Transoxiana
plainn = 780- Asserted: passes — The authors put it forward as true.
- Checkable: passes — It can be checked against evidence.
- Load-bearing: unclear — It is unclear whether the paper’s conclusions depend on it.
- Based: passes — The paper gives a reason why it holds.
A result the paper states — it cites no source for it, so there is none to check. The quote shows it is in the paper.
In the paper
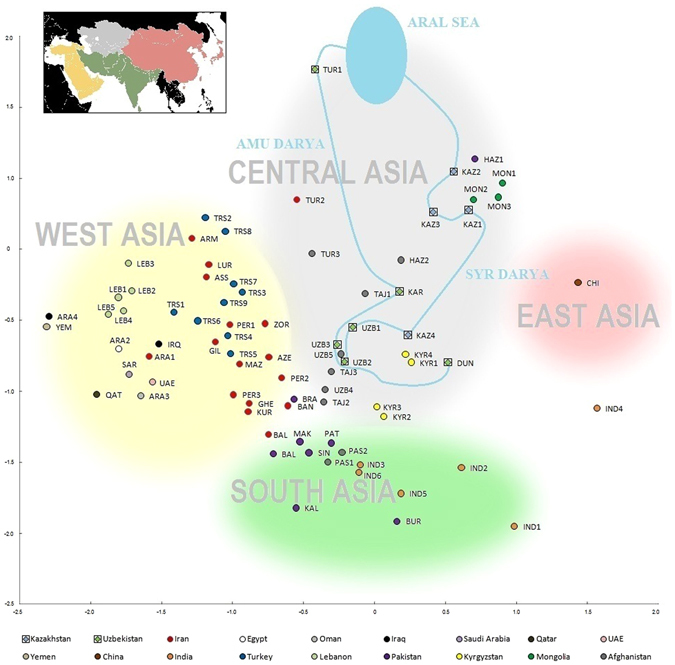
“Third, Dungan populations of Uzbekistan (DUN) are genetically closer to the populations of China (genetic distance d = 0.178) and northeastern India (d = 0.152) than to their neighboring Uzbek populations (d = 0.228; d = 0.410; d = 0.425).”
§ The Connection of the Genetic, Cultural and Geographic Landscapes of Transoxiana > Results and Discussion > The Transoxianan paternal heritage in the Asian context
plainstates an association- Asserted: passes — The authors put it forward as true.
- Checkable: passes — It can be checked against evidence.
- Load-bearing: passes — The paper’s conclusions depend on it.
- Based: passes — The paper gives a reason why it holds.
A result the paper reports from its own data — it cites no other source for it, so there is none to check. The quote shows it is in the paper.
In the paper
“The overwhelming majority of these haplotypes came from Turkmen populations from several countries.”
§ The Connection of the Genetic, Cultural and Geographic Landscapes of Transoxiana > Results and Discussion > Arab and Mongol expansions: migration of cultures or populations?
plainstates an association- Asserted: passes — The authors put it forward as true.
- Checkable: passes — It can be checked against evidence.
- Load-bearing: passes — The paper’s conclusions depend on it.
- Based: passes — The paper gives a reason why it holds.
- It may state two separate claims as one. 19
- Probably not a substantial claim. 8
Create a free account to see these claims.
Create a free account to see these assumptions.
43 more claims
Create a free account to see all 72 claims and to verify the 3 references still open.
Claims other papers make about this one
Each is checked against this paper’s own text: does it say what the citing paper says it does?
In the citing paper
“Furthermore, many minor sub-lineages of Q-M242 have been detected in populations from Inner Eurasia, including Mongolic- and Turkic-speaking populations [6,23,50,51].”
From Ancient Components and Recent Expansion in the Eurasian Heartland: Insights into the Revised Phylogeny of Y-Chromosomes from Central Asia (2022) · cites this paper as [23]
In the citing paper
“The only successor clan of the Darligin Mongols which has been genetically studied is Konyrat (Kungirat) [6, 20].”
From The medieval Mongolian roots of Y-chromosomal lineages from South Kazakhstan (2020) · cites this paper as [20]
Self-check
Percentages, sums and reported differences re-computed from the paper’s own numbers.
Each contradiction between two passages listed here was confirmed by an independent check.
Rated major: it would touch a result — a value a result rests on, reported and recomputed p-values on opposite sides of the significance level, two passages that conflict with no sign which is right, or a cited work retracted before this paper was published.
In the paper
§ The Connection of the Genetic, Cultural and Geographic Landscapes of Transoxiana > Results and Discussion > Genetic portraits of populations and tribal/clan groups of Transoxiana
“the Kozha-Sunak clan group is the most heterogeneous (HD = 0.94)”
§ The Connection of the Genetic, Cultural and Geographic Landscapes of Transoxiana > Results and Discussion > In search of Arab ancestry in Transoxiana
“the high haplogroup variation (HD = 0.86) among the Kozha-Sunak”
Rated minor: it would not touch a result — a value no result rests on, a p-value that stays on the same side of the significance level, or a conflict that is clerical, resolved elsewhere in the paper, or outside its own findings.
In the paper
“More than half of the Transoxianan Y-chromosomes (58%) falls into three haplogroups (Fig. 2): C2-М217 (31%), R1a1a-M198 (16%), and Q-M242 (13%)”
§ The Connection of the Genetic, Cultural and Geographic Landscapes of Transoxiana > Results and Discussion > Genetic portraits of populations and tribal/clan groups of Transoxiana
Reported 58 · recomputed 60
Citations
Cites
Excoffier, L., & Lischer, H. E. L. (2010) · Molecular Ecology Resources · doi:10.1111/j.1755-0998.2010.02847.x · Cited by 16,266
The American Journal of Human Genetics
S., J. (1950) · Population · doi:10.2307/1523704 · Cited by 5,124
Mitochondrial portraits of human populations using median networks.
Bandelt, H. J., Forster, P., Sykes, B. C., & Richards, M. B. (1995) · Genetics · doi:10.1093/genetics/141.2.743 · Cited by 1,071
An evaluation of genetic distances for use with microsatellite loci.
Goldstein, D. B., Ruiz‐Linares, A., Cavalli-Sforza, L. L., & Feldman, M. W. (1995) · Genetics · doi:10.1093/genetics/139.1.463 · Cited by 950
Genetic absolute dating based on microsatellites and the origin of modern humans.
Goldstein, D. B., Ruiz‐Linares, A., Cavalli-Sforza, L. L., & Feldman, M. W. (1995) · Proceedings of the National Academy of Sciences · doi:10.1073/pnas.92.15.6723 · Cited by 764
The Genetic Legacy of the Mongols
Zerjal, T., Xue, Y., Bertorelle, G., Wells, R. S., Bao, W., Zhu, S., Qamar, R., Ayub, Q., Mohyuddin, A., Fu, S., et al. (2003) · The American Journal of Human Genetics · doi:10.1086/367774 · Cited by 563
Self-citationFenner, J. N. (2005) · American Journal of Physical Anthropology · doi:10.1002/ajpa.20188 · Cited by 508
A recent bottleneck of Y chromosome diversity coincides with a global change in culture
Karmin, M., Saag, L., Vicente, M., Sayres, M. A. W., Järve, M., Talas, U. G., Rootsi, S., Ilumäe, A.-M., Mägi, R., Mitt, M., et al. (2015) · Genome Research · doi:10.1101/gr.186684.114 · Cited by 485
Self-citationRosser, Z. H., Zerjal, T., Hurles, M. E., Adojaan, M., Alavantic, D., Amorim, A., Amos, W., Armenteros, M., Arroyo, E., Barbujani, G., et al. (2000) · The American Journal of Human Genetics · doi:10.1086/316890 · Cited by 424
Self-citationmtDNA Variation among Greenland Eskimos: The Edge of the Beringian Expansion
Saillard, J., Forster, P., Lynnerup, N., Bandelt, H.-J., & Nørby, S. (2000) · The American Journal of Human Genetics · doi:10.1086/303038 · Cited by 398
Research works printed but not linked: 6
- Baumer, C. The history of Central Asia: The Age of the Silk Roads. Vol. 2 (I.B.Tauris & Co Ltd, 2014).
- Balanovsky, O. Genepool of Europe. (In Russian, KMK Scientific Press Ltd., 2015).
- Dani, A. H. & Masson, V. M. History of civilizations of Central Asia: The Dawn of Civilization: Earliest Times to 700 B.C., Vol. 1 (UNESCO, 1992).
- Zhabagin, M. K. et al. The relation between the Y-chromosomal variation and the clan structure: the gene pool of the steppe aristocracy and the steppe clergy of the Kazakhs. Moscow University Anthropology Bulletin 1, 96–101 (2014).
- Prozorov, S. M. Islam in the territories of the Former Russian Empire: Encyclopaedic Lexicon. Vol. 1 (In Russian, Oriental Literature, 2006).
- Green, M. R. & Sambrook, J. Molecular cloning: a laboratory manual. 4th edn, (Cold Spring Harbor Laboratory Press, 2012).
Cited by
Zhabagin, M., Sarkytbayeva, A., Tazhigulova, I., Yerezhepov, D., Li, S., Akilzhanov, R., Yeralinov, A., Sabitov, Z., & Akilzhanova, A. (2019) · International Journal of Legal Medicine · doi:10.1007/s00414-018-1859-8 · Cited by 28
Self-citationDoğan, S., Gürkan, C., Dogan, M., Balkaya, H. E., Tunc, R., Demirdov, D. K., Ameen, N. A., & Marjanović, D. (2017) · PLoS ONE · doi:10.1371/journal.pone.0187408 · Cited by 31
Rectifying long-standing misconceptions about the ρ statistic for molecular dating
Macaulay, V. A., Soares, P. A., & Richards, M. B. (2019) · PLoS ONE · doi:10.1371/journal.pone.0212311 · Cited by 26
The medieval Mongolian roots of Y-chromosomal lineages from South Kazakhstan
Zhabagin, M., Sabitov, Z., Tarlykov, P., Tazhigulova, I., Junissova, Z., Yerezhepov, D., Akilzhanov, R., Zholdybayeva, E., Wei, L.-H., Akilzhanova, A., et al. (2020) · BMC Genetics · doi:10.1186/s12863-020-00897-5 · Cited by 21
Self-citationMatch probabilities for Y-chromosomal profiles: A paradigm shift
Caliebe, A., & Krawczak, M. (2018) · Forensic Science International Genetics · doi:10.1016/j.fsigen.2018.08.009 · Cited by 19
Metadata
- Authors
- Zhabagin, M., Balanovska, E., Sabitov, Z., Kuznetsova, M., Agdzhoyan, A., Balaganskaya, O., Chukhryaeva, M., Markina, N., Romanov, A., Skhalyakho, R., Zaporozhchenko, V., Saroyants, L., Dalimova, D., Davletchurin, D., Turdikulova, S., Yusupov, Y., Tazhigulova, I., Akilzhanova, A., Tyler-Smith, C., & Balanovsky, O.
- Affiliations
- Russian Academy of Sciences (RU)
- Research Centre for Medical Genetics (RU)
- L. N. Gumilyov Eurasian National University (KZ)
- Research Institute for the Study of Leprosy (RU)
- Nazarbayev University (KZ)
- Corresponding author
- Zhabagin, Maxat
- Balanovsky, Oleg
- ORCID
- Venue
- Scientific Reports
- Published
- 2017-06-08
- Volume
- 7
- Issue
- 1
- Pages
- 3085-3085
- ISSN
- 2045-2322 (ISSN-L)
- PMC
- PMC5465200
- OpenAlex
- W2621257476
- Cited by
- 39
- References
- 65
- Citations by year
- 2026: 1 · 2025: 3 · 2024: 4 · 2023: 3 · 2022: 4 · 2021: 4 · 2020: 9 · 2019: 3 · 2018: 6 · 2017: 2
- FWCI
- 3.09
- Type
- journal article
- Language
- en
- Open access
- gold
- doi.org
- Locations
- Scientific Reports (publishedVersion, cc-by)
- Europe PMC (PubMed Central) (publishedVersion, other-oa)
- PubMed (publishedVersion)
- PubMed Central (publishedVersion, cc-by)
- Nazarbayev University Repository (Nazarbayev University) (submittedVersion, cc-by-nc-sa)
- DOAJ (DOAJ: Directory of Open Access Journals) (submittedVersion, cc-by-sa)
- Funders
- Wellcome Trust (098051)
- Topics
- Life Sciences › Biochemistry, Genetics and Molecular Biology › Genetics › Forensic and Genetic Research
- Life Sciences › Biochemistry, Genetics and Molecular Biology › Genetics › Genetic diversity and population structure
- Social Sciences › Arts and Humanities › History › Eurasian Exchange Networks
- Keywords
- Y-chromosome variation, Transoxiana, Central Asian populations, haplogroup frequencies, genetic structure, cultural landscape, Mongol expansion, Islam, pastoralism, Kazakhs, Uzbek language, Karakalpak language, genealogy, paternal lineages
- MeSH terms
- Paternal Inheritance, Asia, Central, Culture, Genetics, Population, Geography, Haplotypes, Humans, Cluster Analysis, Polymorphism, Single Nucleotide, Chromosomes, Human, Y, Population Groups, Human Migration
About these checks
Registry, retraction, Cites and statistics results are computed, not judged, with one exception: a printed reference that no index lists is read once by a model before it counts as a citation error. Claims are extracted by a model and kept only when their quote appears verbatim in the text; each cited source is then checked, with a model’s help, for whether it says what the claim relies on. Those verdicts can be wrong — read the claim’s quote and the cited source before relying on one.
A language model drew the claims from the paper on 2026-11-12, under version 3 of the claim definition (model deepseek-v4.1-flash, prompt extract-v3).
A second model labelled each claim on 2026-11-12 (model jev-1.13-20260917, definition revision gold-guideline-v0.2).
Statistics and arithmetic are recomputed, not judged.
Confidence bands are shown only for fields calibrated on our annotated test set. None is calibrated yet, so no band is shown.
What counts as a claim ›How we measure confidence ›How we check this ›
Are you an author, or do you see a problem with this page? Request a review
