

The DOI matches its Crossref record; 72 of the 73 references it cites were found in a registry or an index.
Prenatal Glucocorticoid Exposure Modifies Endocrine Function and Behaviour for 3 Generations Following Maternal and Paternal Transmission
Open accessAbstract
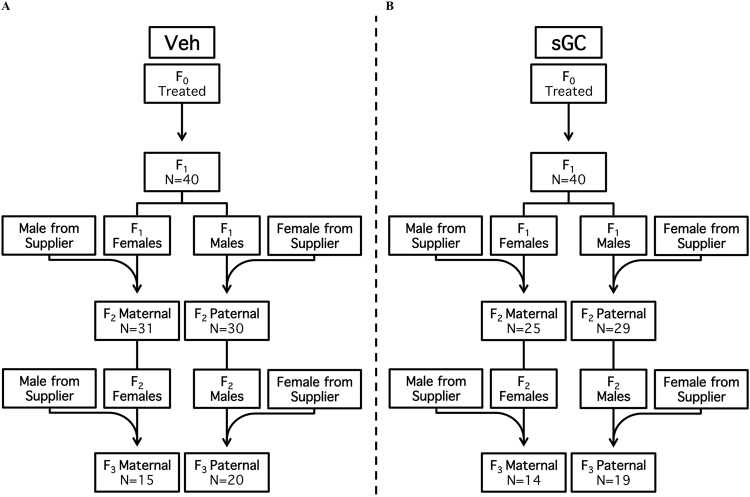
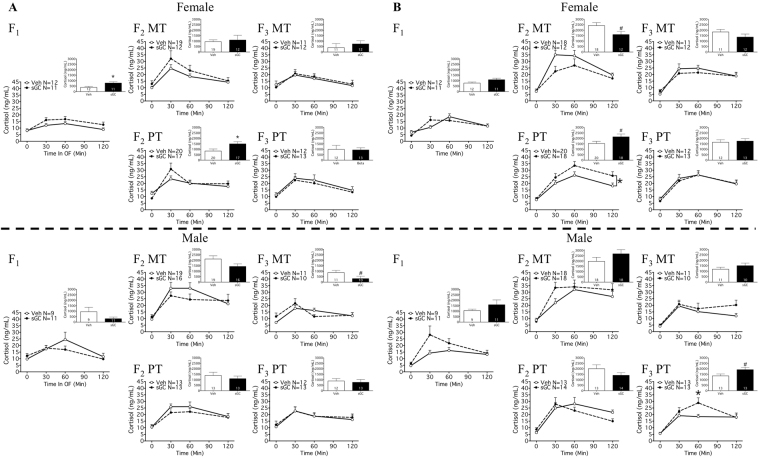
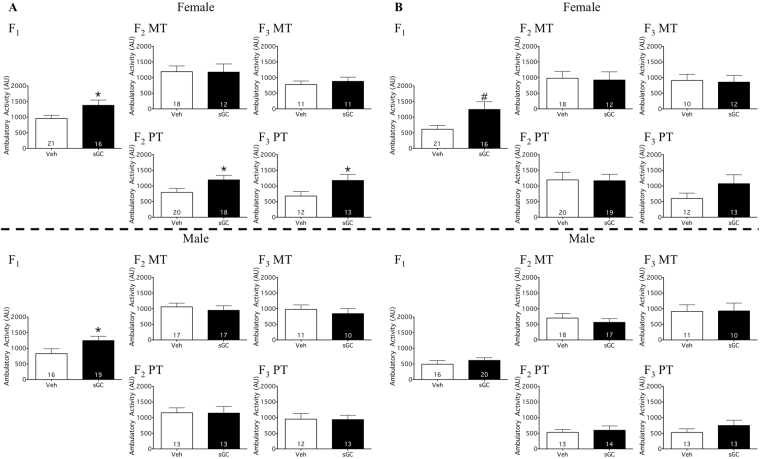
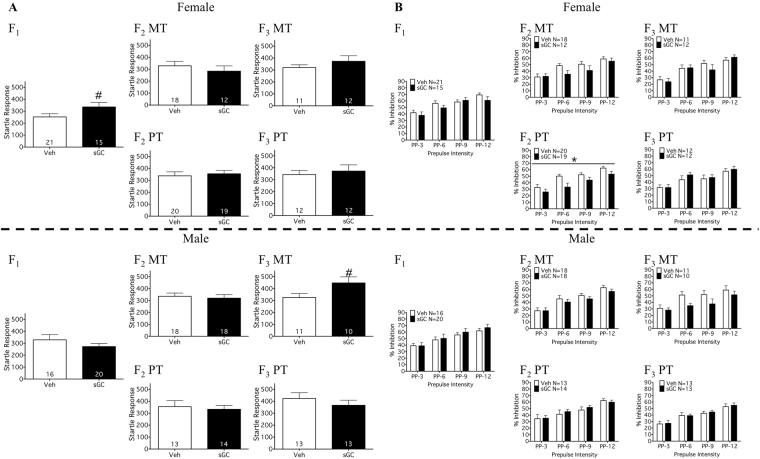
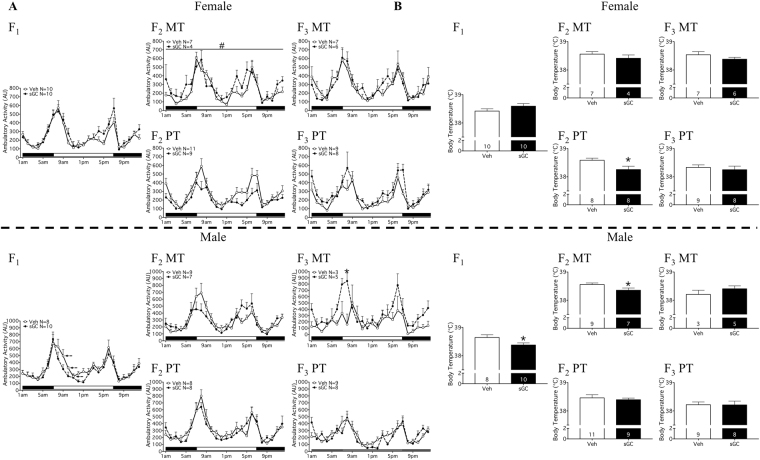
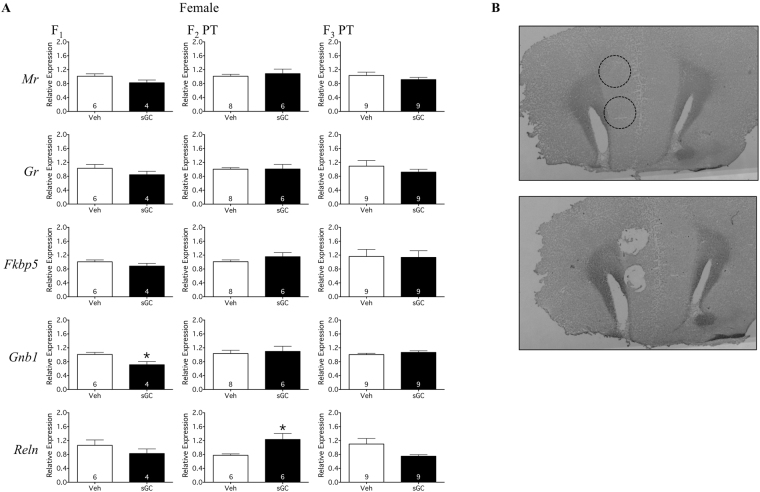
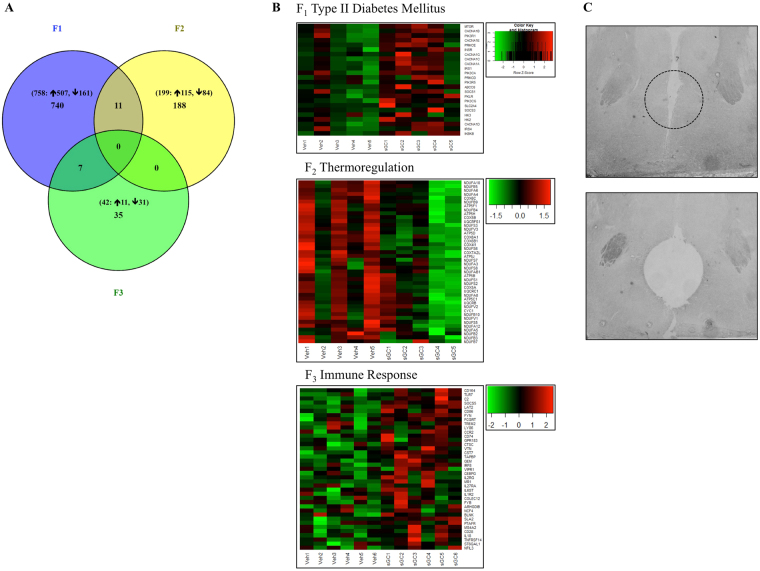
Fetal exposure to high levels of glucocorticoids programs long-term changes in the physiologic stress response and behaviours. However, it is not known whether effects manifest in subsequent generations of offspring following maternal (MT) or paternal (PT) transmission. We treated pregnant guinea pigs with three courses of saline or synthetic glucocorticoid (sGC) at a clinically relevant dose. Altered cortisol response to stress and behaviours transmitted to juvenile female and male F 2 and F 3 offspring from both parental lines. Behavioural effects of sGC in F 1-F 3 PT females associated with altered expression of genes in the prefrontal cortex and hypothalamic paraventricular nucleus (PVN). Exposure to sGC programmed large transgenerational changes in PVN gene expression, including type II diabetes, thermoregulation, and collagen formation gene networks. We demonstrate transgenerational programming to F 3 following antenatal sGC. Transmission is sex- and generation-dependent, occurring through both parental lines. Paternal transmission to F 3 females strongly implicates epigenetic mechanisms of transmission.
Overview
The claims and statistics of this paper haven’t been checked yet.
Run the check — free, no account needed. It reads the open-access text and checks the sources it cites.
Integrity signals
Registry
Cites
Statistics
Figures
Verification
Claims the paper makes
The claims and statistics of this paper haven’t been checked yet.
Run the check — free, no account needed. It reads the open-access text and checks the sources it cites.
Claims other papers make about this one
Each is checked against this paper’s own text: does it say what the citing paper says it does?
The cited source says what the claim attributes to it.
In the citing paper
“However, this effect was also observed in the next generation, with evidence of long-term programming.”
The cited source says what the claim attributes to it.
In the citing paper
“In utero exposure to synthetic glucocorticoids in guinea pigs was shown to influence the cortisol response to stress in the offspring, and they had increased stress-related behaviors [80].”
The cited source says what the claim attributes to it.
In the citing paper
“Moreover, recent studies indicate that the effects of antenatal glucocorticoid exposure may persist for several generations [96].”
From Stress and the HPA Axis: Balancing Homeostasis and Fertility. (2017) · cites this paper as [96]
Self-check
Percentages, sums and reported differences re-computed from the paper’s own numbers.
The self-check needs the paper’s full text.
Citations
Cites
Moderated estimation of fold change and dispersion for RNA-seq data with DESeq2
Love, M. I., Huber, W., & Anders, S. (2014) · Genome Biology · doi:10.1186/s13059-014-0550-8 · Cited by 95,106
Robinson, M. D., McCarthy, D. J., & Smyth, G. K. (2010) · Bioinformatics · doi:10.1093/bioinformatics/btp616 · Cited by 41,364
Trapnell, C., Roberts, A., Goff, L. A., Pertea, G. M., Kim, D., Kelley, D. R., Pimentel, H., Salzberg, S. L., Rinn, J. L., & Pachter, L. S. (2012) · Nature Protocols · doi:10.1038/nprot.2012.016 · Cited by 12,145
Leek, J. T., Johnson, W. E., Parker, H. S., Jaffe, A. E., & Storey, J. D. (2012) · Bioinformatics · doi:10.1093/bioinformatics/bts034 · Cited by 6,231
Software for Computing and Annotating Genomic Ranges
Lawrence, M. F., Huber, W. K., Pagès, H., Aboyoun, P., Carlson, M. R. J., Gentleman, R. C., Morgan, M. T., & Carey, V. J. (2013) · PLoS Computational Biology · doi:10.1371/journal.pcbi.1003118 · Cited by 4,475
Antenatal corticosteroids for accelerating fetal lung maturation for women at risk of preterm birth
Roberts, D., Brown, J., Medley, N., & Dalziel, S. R. (2017) · Cochrane Database of Systematic Reviews · doi:10.1002/14651858.cd004454.pub3 · Cited by 2,806
Comparative aspects of the brain growth spurt
Dobbing, J., & Sands, J. (1979) · Early Human Development · doi:10.1016/0378-3782(79)90022-7 · Cited by 2,506
The Galaxy platform for accessible, reproducible and collaborative biomedical analyses: 2016 update
Afgan, E., Baker, D., van den Beek, M., Blankenberg, D. J., Bouvier, D., Čech, M., Chilton, J. M., Clements, D., Coraor, N., Eberhard, C., et al. (2016) · Nucleic Acids Research · doi:10.1093/nar/gkw343 · Cited by 2,150
Normalization of RNA-seq data using factor analysis of control genes or samples
Risso, D., Ngai, J., Speed, T. P., & Dudoit, S. (2014) · Nature Biotechnology · doi:10.1038/nbt.2931 · Cited by 2,052
Motulsky, H. J., & Brown, R. E. (2006) · BMC Bioinformatics · doi:10.1186/1471-2105-7-123 · Cited by 1,616
Cited by
Sorted by citations
Stress and the HPA Axis: Balancing Homeostasis and Fertility.
Joseph, D., & Whirledge, S. (2017) · International journal of molecular sciences · doi:10.3390/ijms18102224 · Cited by 290
“Moreover, recent studies indicate that the effects of antenatal glucocorticoid exposure may persist for several generations [96].”
BackgroundPrenatal Stress, Glucocorticoids, and Developmental Programming of the Stress Response
McGowan, P. O., & Matthews, S. G. (2017) · Endocrinology · doi:10.1210/en.2017-00896 · Cited by 278
Self-citationAntenatal corticosteroids: an assessment of anticipated benefits and potential risks
Jobe, A. H., & Goldenberg, R. L. (2018) · American Journal of Obstetrics and Gynecology · doi:10.1016/j.ajog.2018.04.007 · Cited by 157
Morrison, J. L., Botting, K. J., Darby, J. R. T., David, A. L., Dyson, R. M., Gatford, K. L., Gray, C. L., Herrera, E. A., Hirst, J. J., Kim, B., et al. (2018) · The Journal of Physiology · doi:10.1113/jp274948 · Cited by 148
Self-citationFitzgerald, E., Hor, K., & Drake, A. J. (2020) · Early Human Development · doi:10.1016/j.earlhumdev.2020.105190 · Cited by 149
Metadata
- Authors
- Moisiadis, V. G., Constantinof, A., Kostaki, A., Szyf, M., & Matthews, S. G.
- Affiliations
- University of Toronto (CA)
- Corresponding author
- Matthews, Stephen G.
- ORCID
- Matthews, Stephen G.
- Venue
- Scientific Reports
- Published
- 2017-09-18
- Volume
- 7
- Issue
- 1
- Pages
- 11814-11814
- ISSN
- 2045-2322 (ISSN-L)
- PMC
- PMC5603559
- OpenAlex
- W2754298054
- Cited by
- 122
- References
- 73
- Citations by year
- 2026: 2 · 2025: 10 · 2024: 11 · 2023: 12 · 2022: 6 · 2021: 10 · 2020: 43 · 2019: 14 · 2018: 11 · 2017: 3
- FWCI
- 21.21
- Type
- journal article
- Language
- en
- Open access
- gold
- doi.org
- Locations
- Scientific Reports (publishedVersion, cc-by)
- Europe PMC (PubMed Central) (publishedVersion, cc-by)
- PubMed Central (publishedVersion, cc-by)
- PubMed (publishedVersion)
- DOAJ (DOAJ: Directory of Open Access Journals) (submittedVersion)
- Funders
- Fondation Brain Canada
- Kids Brain Health Network
- Canadian Institutes of Health Research (126166, 126166_1)
- Topics
- Health Sciences › Medicine › Pediatrics, Perinatology and Child Health › Birth, Development, and Health
- Life Sciences › Neuroscience › Behavioral Neuroscience › Stress Responses and Cortisol
- Health Sciences › Medicine › Public Health, Environmental and Occupational Health › Maternal Mental Health During Pregnancy and Postpartum
- Keywords
- prenatal glucocorticoid exposure, transgenerational epigenetic inheritance, mother-to-child transmission, paternal transmission, stress response, cortisol, hypothalamic paraventricular nucleus, prefrontal cortex gene expression, type 2 diabetes, thermoregulation, collagen synthesis, guinea pig model
- MeSH terms
- Animals, Diabetes Mellitus, Type 2, Female, Glucocorticoids, Guinea Pigs, Male, Paraventricular Hypothalamic Nucleus, Pregnancy, Prenatal Exposure Delayed Effects, Epigenesis, Genetic
About these checks
Registry, retraction, Cites and statistics results are computed, not judged, with one exception: a printed reference that no index lists is read once by a model before it counts as a citation error. Claims are extracted by a model and kept only when their quote appears verbatim in the text; each cited source is then checked, with a model’s help, for whether it says what the claim relies on. Those verdicts can be wrong — read the claim’s quote and the cited source before relying on one.
Statistics and arithmetic are recomputed, not judged.
Confidence bands are shown only for fields calibrated on our annotated test set. None is calibrated yet, so no band is shown.
What counts as a claim ›How we measure confidence ›How we check this ›
Are you an author, or do you see a problem with this page? Request a review
