

The DOI matches its Crossref record.
Defective thymic output in WAS patients is associated with abnormal actin organization
Abstract
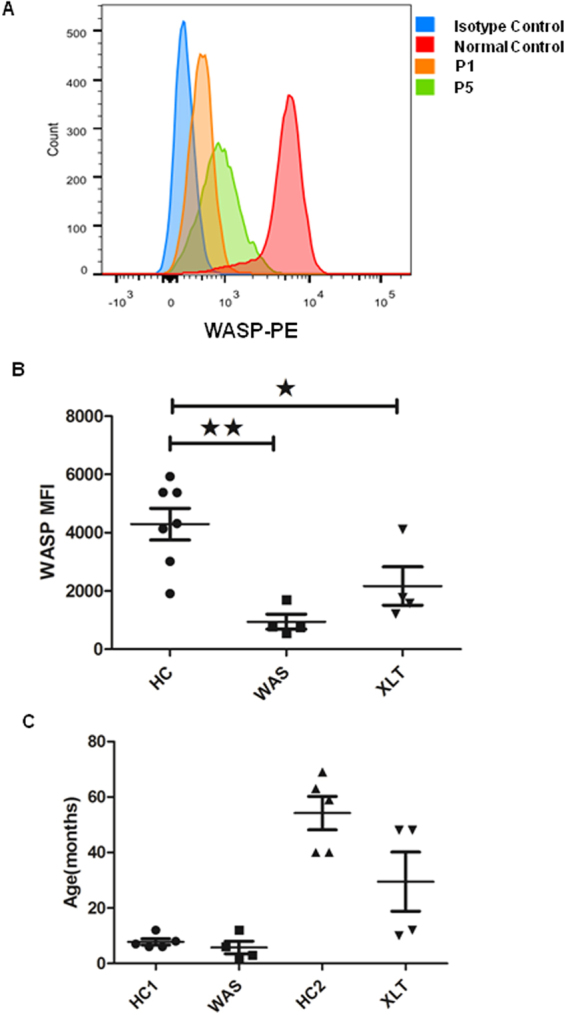
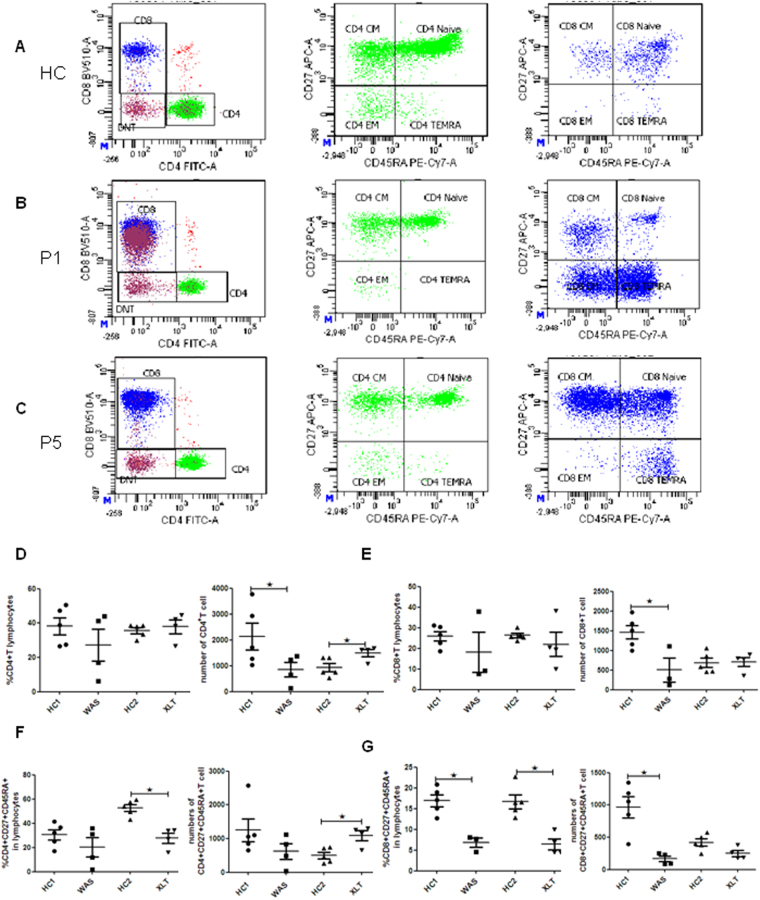
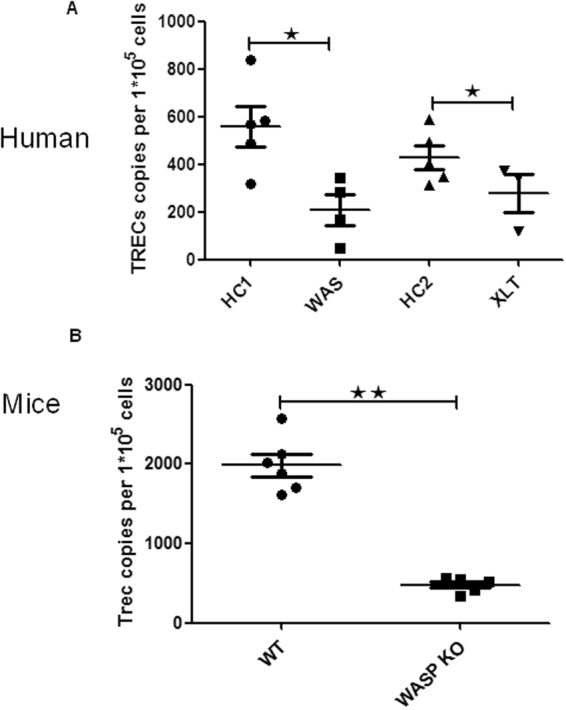
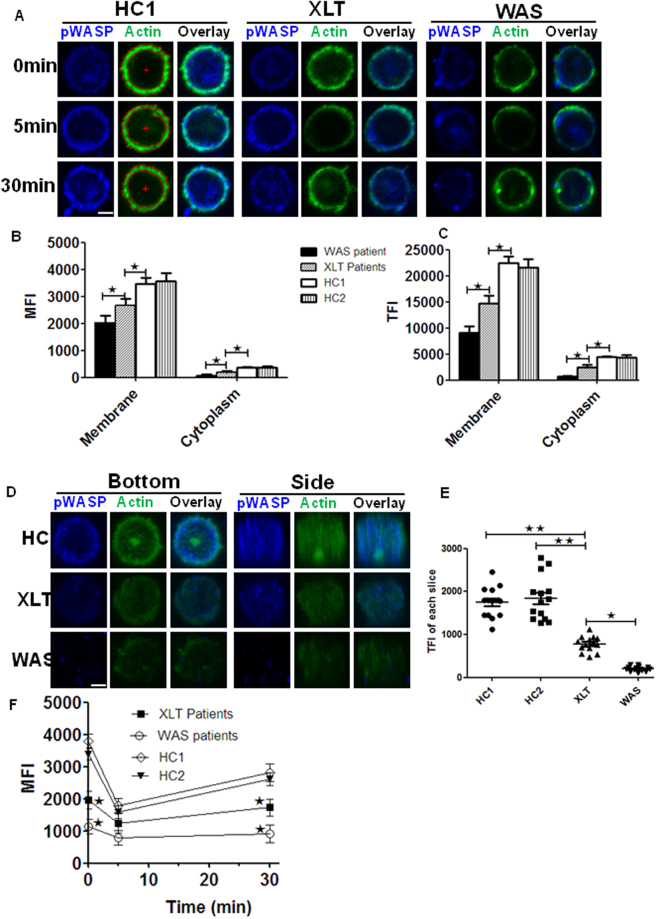
Wiskott-Aldrich syndrome protein (WASp) is a key regulator of the actin cytoskeleton. Defective T - cell function is a major cause for immune deficiency in Wiskott-Aldrich syndrome (WAS) patients. T cells originate in the bone marrow and develop in the thymus, and then migrate to peripheral tissues. TCR excision circles (TRECs) present in thymic output cells stably, which is used as a molecular marker for thymic output. We found that CD8+ T naïve cells of classic WAS patients were significantly reduced, and TRECs in patients with classic WAS and X-linked thrombocytopenia (XLT) dramatically decreased compared with that of HCs. TRECs were also reduced in WAS (KO) mice. These suggest that defective thymic output partially accounts for T cell lymphopenia in WAS patients. However, the correlation between the defect of thymic output and actin organization still remains elusive. We found that the subcellular location and the levels of of F-actin were altered in T cells from both WAS and XLT patients compared to that of HCs with or without stimulation. Our study shows that WASp plays a critical role in thymic output, which highly correlates with the subcellular location and level of F-actin in T cells.
Overview
The claims and statistics of this paper haven’t been checked yet.
Run the check — free, no account needed. It reads the open-access text and checks the sources it cites.
Integrity signals
Registry
Cites
Statistics
Figures
Verification
Claims the paper makes
The claims and statistics of this paper haven’t been checked yet.
Run the check — free, no account needed. It reads the open-access text and checks the sources it cites.
Claims other papers make about this one
Each is checked against this paper’s own text: does it say what the citing paper says it does?
In the citing paper
“Recently, decreased TRECs in patients and mice with WAS mutations were demonstrated along with decreased F-actin in patient T cells, 43 emphasizing the critical role of actin remodeling throughout thymic development and output.”
From Dominant activating RAC2 mutation with lymphopenia, immunodeficiency, and cytoskeletal defects (2019) · cites this paper as [43]
Self-check
Percentages, sums and reported differences re-computed from the paper’s own numbers.
The self-check needs the paper’s full text.
Citations
Cites
No references could be resolved yet.
Research works printed but not linked: 22
- Gulacsy, V. et al. Genetic characteristics of eighty-seven patients with the Wiskott-Aldrich syndrome. Molecular immunology 48, 788–792, https://doi.org/10.1016/j.molimm.2010.11.013 (2011). · DOI
- Aldrich, R. A., Steinberg, A. G. & Campbell, D. C. Pedigree demonstrating a sex-linked recessive condition characterized by draining ears, eczematoid dermatitis and bloody diarrhea. Pediatrics 13, 133–139 (1954). · DOI
- Zhu, Q. et al. The Wiskott-Aldrich syndrome and X-linked congenital thrombocytopenia are caused by mutations of the same gene. Blood 86, 3797–3804 (1995). · DOI
- Notarangelo, L. D., Miao, C. H. & Ochs, H. D. Wiskott-Aldrich syndrome. Current opinion in hematology 15, 30–36, https://doi.org/10.1097/MOH.0b013e3282f30448 (2008). · DOI
- Kim, A. S., Kakalis, L. T., Abdul-Manan, N., Liu, G. A. & Rosen, M. K. Autoinhibition and activation mechanisms of the Wiskott-Aldrich syndrome protein. Nature 404, 151–158, https://doi.org/10.1038/35004513 (2000). · DOI
- Le Clainche, C. & Carlier, M. F. Regulation of actin assembly associated with protrusion and adhesion in cell migration. Physiological reviews 88, 489–513, https://doi.org/10.1152/physrev.00021.2007 (2008). · DOI
- Trifari, S. et al. Defective Th1 cytokine gene transcription in CD4+ and CD8+ T cells from Wiskott-Aldrich syndrome patients. Journal of immunology 177, 7451–7461 (2006). · DOI
- Morales-Tirado, V. et al. Critical requirement for the Wiskott-Aldrich syndrome protein in Th2 effector function. Blood 115, 3498–3507, https://doi.org/10.1182/blood-2009-07-235754 (2010). · DOI
- Sarzotti-Kelsoe, M. et al. Thymic output, T-cell diversity, and T-cell function in long-term human SCID chimeras. Blood 114, 1445–1453, https://doi.org/10.1182/blood-2009-01-199323 (2009). · DOI
- Park, J. Y. et al. Early deficit of lymphocytes in Wiskott-Aldrich syndrome: possible role of WASP in human lymphocyte maturation. Clinical and experimental immunology 136, 104–110, https://doi.org/10.1111/j.1365-2249.2004.02409.x (2004). · DOI
- Rawlings, S. L. et al. Spontaneous apoptosis in lymphocytes from patients with Wiskott-Aldrich syndrome: correlation of accelerated cell death and attenuated bcl-2 expression. Blood 94, 3872–3882 (1999). · DOI
- Ribeiro, R. M. & Perelson, A. S. Determining thymic output quantitatively: using models to interpret experimental T-cell receptor excision circle (TREC) data. Immunological reviews 216, 21–34, https://doi.org/10.1111/j.1600-065X.2006.00493.x (2007). · DOI
- Jilkina, O. et al. Retrospective TREC testing of newborns with Severe Combined Immunodeficiency and other primary immunodeficiency diseases. Molecular genetics and metabolism reports 1, 324–333, https://doi.org/10.1016/j.ymgmr.2014.07.003 (2014). · DOI
- Zhang, S. L. & Bhandoola, A. Losing TREC with age. Immunity 36, 163–165, https://doi.org/10.1016/j.immuni.2012.02.005 (2012). · DOI
- Yee, C. S. et al. Recurrent viral infections associated with a homozygous CORO1A mutation that disrupts oligomerization and cytoskeletal association. The Journal of allergy and clinical immunology 137, 879–888 e872, https://doi.org/10.1016/j.jaci.2015.08.020 (2016). · DOI
- Keppler, S. J. et al. Wiskott-Aldrich Syndrome Interacting Protein Deficiency Uncovers the Role of the Co-receptor CD19 as a Generic Hub for PI3 Kinase Signaling in B Cells. Immunity 43, 660–673, https://doi.org/10.1016/j.immuni.2015.09.004 (2015). · DOI
- Kumari, S. et al. Actin foci facilitate activation of the phospholipase C-gamma in primary T lymphocytes via the WASP pathway. eLife 4, doi:https://doi.org/10.7554/eLife.04953 (2015). · DOI
- Massaad, M. J., Ramesh, N. & Geha, R. S. Wiskott-Aldrich syndrome: a comprehensive review. Annals of the New York Academy of Sciences 1285, 26–43, https://doi.org/10.1111/nyas.12049 (2013). · DOI
- Goley, E. D. & Welch, M. D. The ARP2/3 complex: an actin nucleator comes of age. Nature reviews. Molecular cell biology 7, 713–726, https://doi.org/10.1038/nrm2026 (2006). · DOI
- Liu, D. W. et al. Wiskott-Aldrich syndrome/X-linked thrombocytopenia in China: Clinical characteristic and genotype-phenotype correlation. Pediatric blood & cancer 62, 1601–1608, https://doi.org/10.1002/pbc.25559 (2015). · DOI
- Dion, M. L., Sekaly, R. P. & Cheynier, R. Estimating thymic function through quantification of T-cell receptor excision circles. Methods in molecular biology 380, 197–213, https://doi.org/10.1007/978-1-59745-395-0_12 (2007). · DOI
- Broers, A. E. et al. Quantification of newly developed T cells in mice by real-time quantitative PCR of T-cell receptor rearrangement excision circles. Experimental hematology 30, 745–750 (2002). · DOI
Cited by
Dominant activating RAC2 mutation with lymphopenia, immunodeficiency, and cytoskeletal defects
Hsu, A. P., Donkó, A., Arrington, M. E., Swamydas, M., Fink, D., Das, A., Escobedo, O., Bonagura, V., Szabolcs, P., Steinberg, H. N., et al. (2019) · Blood · doi:10.1182/blood-2018-11-886028 · Cited by 92
Metadata
- Authors
- Li, W., Sun, X., Wang, J., Zhao, Q., Dai, R., Wang, Y., Zhou, L., Westerberg, L., Ding, Y., Zhao, X., & Liu, C.
- ORCID
- Westerberg, Lisa
- Venue
- Scientific Reports
- Published
- 2017-09-20
- Volume
- 7
- Issue
- 1
- ISSN
- 2045-2322
- PMC
- PMC5607224
- Cited by
- 9
- References
- 0
- Language
- en
About these checks
Registry, retraction, Cites and statistics results are computed, not judged, with one exception: a printed reference that no index lists is read once by a model before it counts as a citation error. Claims are extracted by a model and kept only when their quote appears verbatim in the text; each cited source is then checked, with a model’s help, for whether it says what the claim relies on. Those verdicts can be wrong — read the claim’s quote and the cited source before relying on one.
Statistics and arithmetic are recomputed, not judged.
Confidence bands are shown only for fields calibrated on our annotated test set. None is calibrated yet, so no band is shown.
What counts as a claim ›How we measure confidence ›How we check this ›
Are you an author, or do you see a problem with this page? Request a review
