

The DOI matches its Crossref record; 47 of the 47 references it cites were found in a registry or an index.
The clinical importance of a cytokine network in the acute phase of sepsis
Open accessAbstract
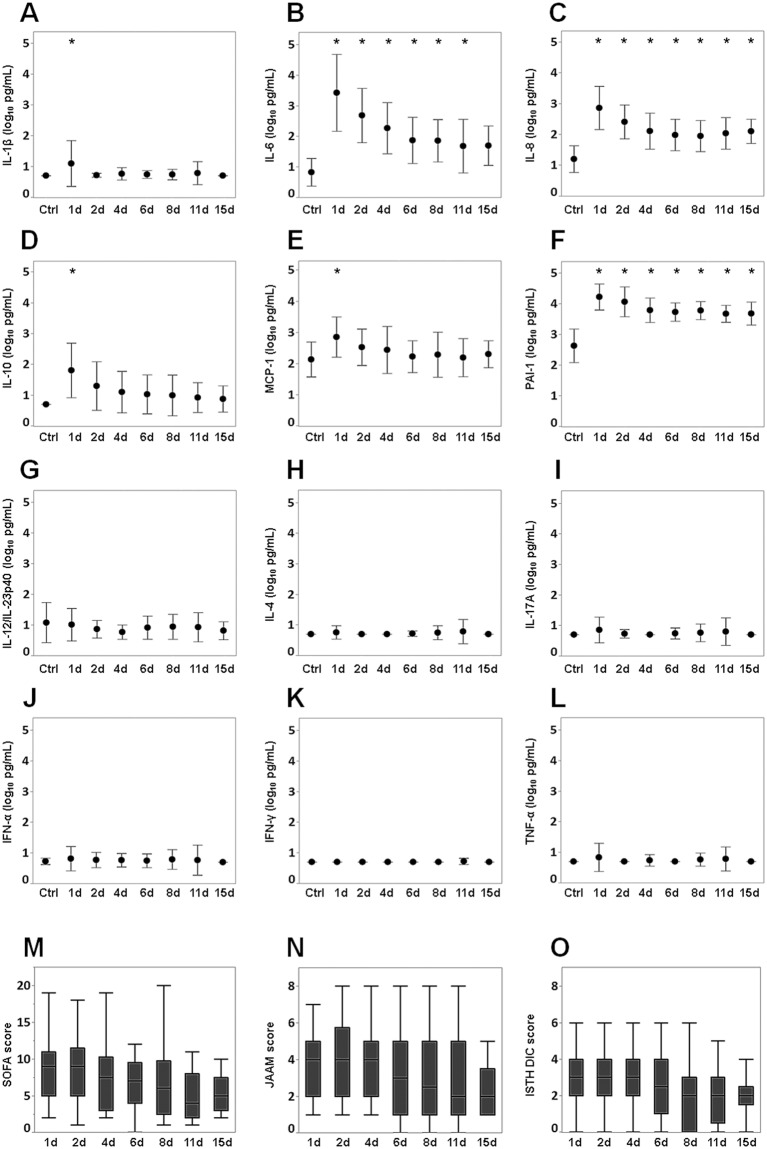
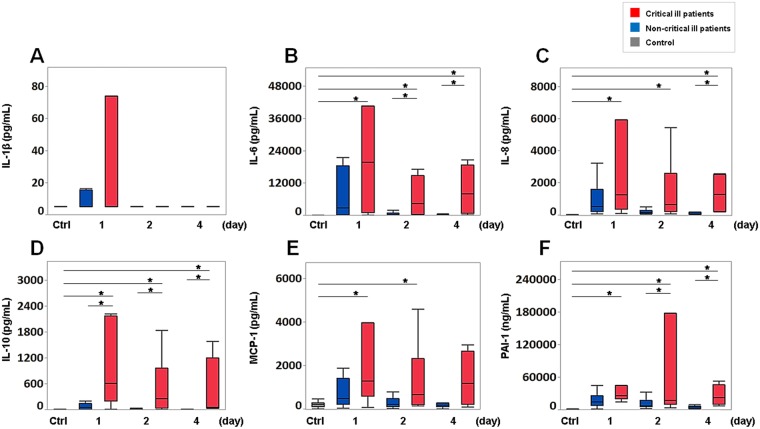
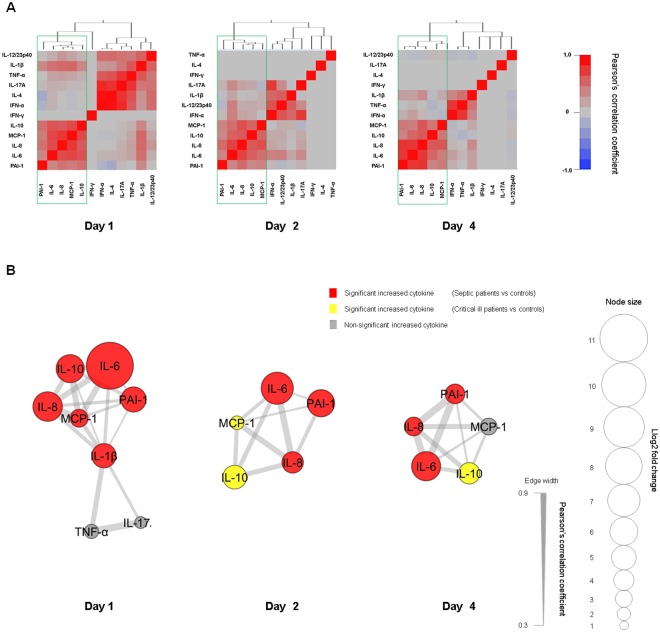
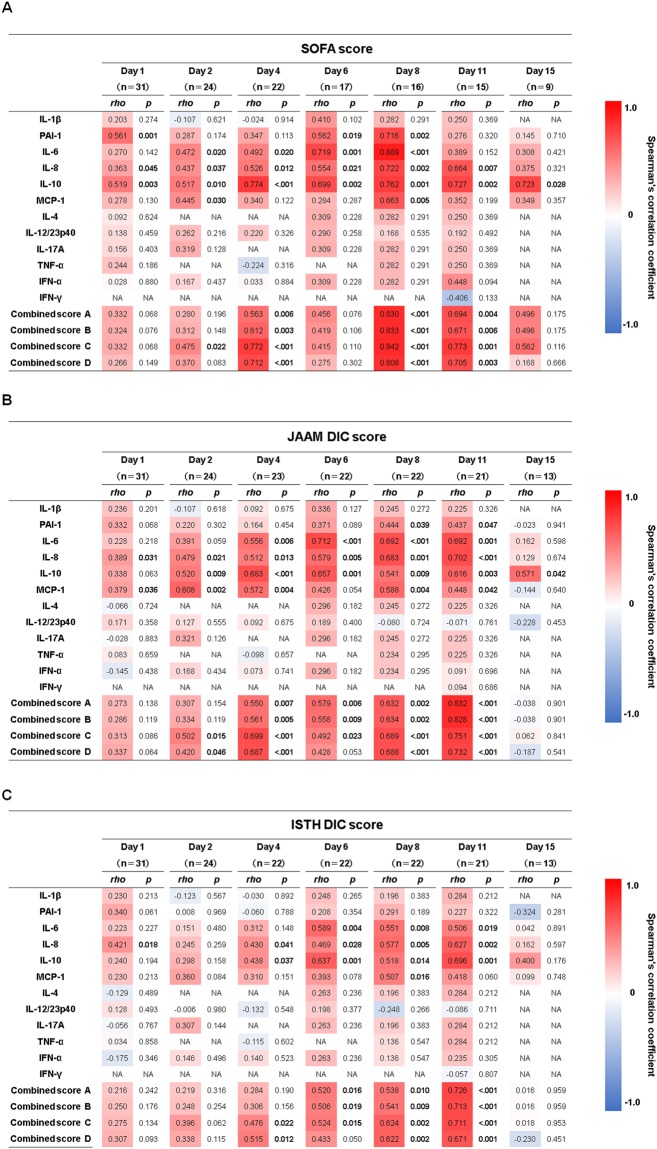
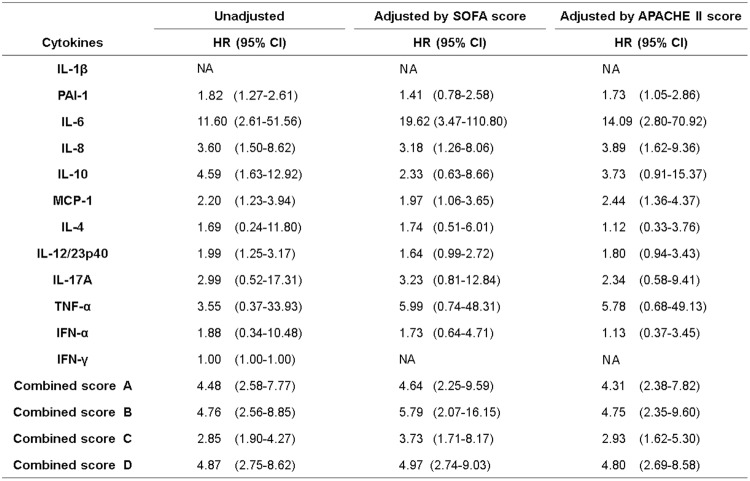
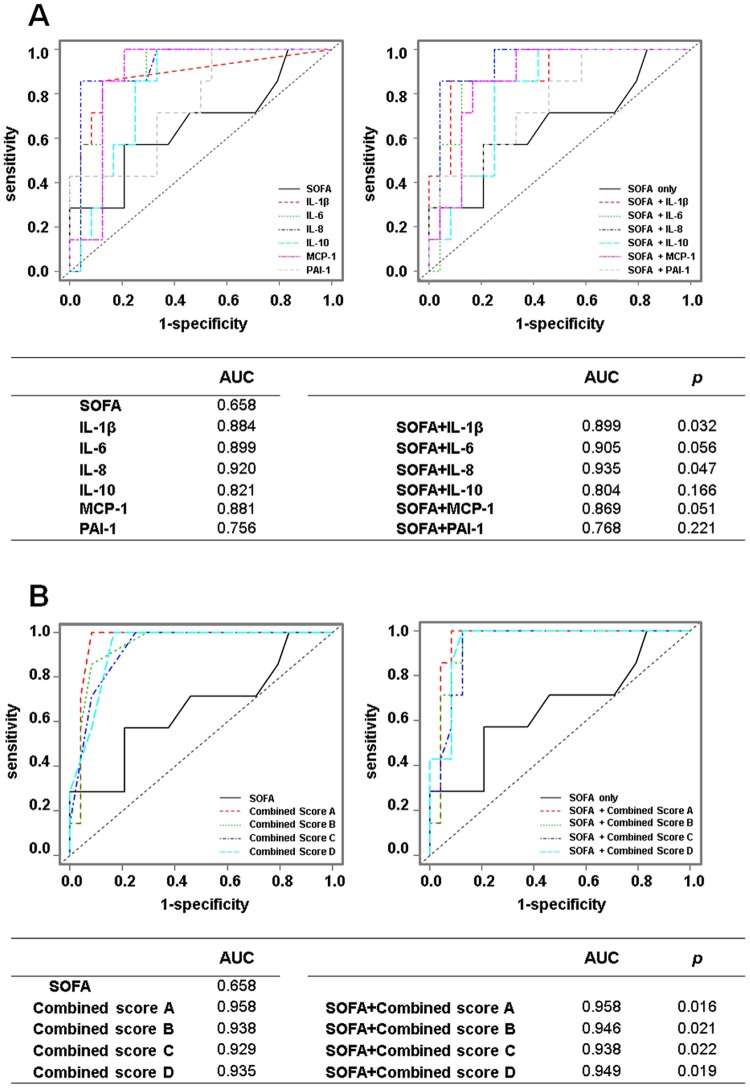
Sepsis remains a major cause of death. Cytokines interact closely with each other and play a crucial role in the progression of sepsis. We focussed on the associations of a cytokine network with prognosis and disease severities in sepsis. This retrospective study included 31 patients with sepsis and 13 healthy controls. Blood samples were collected from patients on days 1, 2, 4, 6, 8, 11 and 15 and from healthy controls. Levels of PAI-1, IFN-α, IFN-γ, IL-1β, IL-6, IL-8, IL-12/IL-23p40, IL-17A, TNF-α, MCP-1, IL-4 and IL-10 were measured. SOFA, JAAM DIC and ISTH DIC scores were evaluated at the same times blood samples were taken. Network analysis revealed a network formed by PAI-1, IL-6, IL-8, MCP-1 and IL-10 on days 1, 2 and 4 throughout the acute phase of sepsis. There were positive correlations of each cytokine and the combined score (IL-6 + IL-8 + IL-10 + MCP-1) with the SOFA, JAAM DIC and ISTH DIC scores throughout the acute phase. A Cox proportional hazards model focussed on the acute phase showed that the above combined score was significantly related with patient prognosis, suggesting that the cytokine network of IL-6, IL-8, MCP-1 and IL-10 could play a pivotal role in the acute phase of sepsis.
Overview
The claims and statistics of this paper haven’t been checked yet.
Run the check — free, no account needed. It reads the open-access text and checks the sources it cites.
Integrity signals
Registry
Cites
Statistics
Figures
Verification
Claims the paper makes
The claims and statistics of this paper haven’t been checked yet.
Run the check — free, no account needed. It reads the open-access text and checks the sources it cites.
Claims other papers make about this one
Each is checked against this paper’s own text: does it say what the citing paper says it does?
The source backs part of the claim, not all of it — or backs it for a different population, condition or comparison.
In the citing paper
“In septic shock, underlying dysregulated immune responses produce cytokines in response to infection [23].”
From Non-Diabetic Hypoglycemia: Evaluation and Management in Adults (2025) · cites this paper as [23]
Experimental — accuracy not yet measuredThe check wasn’t confident either way, so it gives no verdict — never disputed.
In the citing paper
“This systemic overdrive accelerates glucose utilization that eventually may outpace the body's gluconeogenic capacity.”
From Non-Diabetic Hypoglycemia: Evaluation and Management in Adults (2025) · cites this paper as [23]
Experimental — accuracy not yet measured
Self-check
Percentages, sums and reported differences re-computed from the paper’s own numbers.
The self-check needs the paper’s full text.
Citations
Cites
Cytoscape: A software Environment for integrated models of biomolecular interaction networks
Shannon, P., Markiel, A., Ozier, O., Baliga, N. S., Wang, J. T., Ramage, D., Amin, N., Schwikowski, B., & Ideker, T. (2003) · Genome Research · doi:10.1101/gr.1239303 · Cited by 51,888
The third international consensus definitions for sepsis and septic shock (Sepsis-3).
Singer, M., Deutschman, C. S., Seymour, C. W., Shankar-Hari, M., Annane, D., Bauer, M., Bellomo, R., Bernard, G. R., Chiche, J.-D., Coopersmith, C. M., et al. (2016) · JAMA · doi:10.1001/jama.2016.0287 · Cited by 28,250
Knaus, W. A., Draper, E. A., Wagner, D. P., & Zimmerman, J. E. (1985) · Critical Care Medicine · doi:10.1097/00003246-198510000-00009 · Cited by 15,518
APACHE II-A Severity of Disease Classification System
Knaus, W. A., Draper, E. A., Wagner, D. P., & Zimmerman, J. E. (1986) · Critical Care Medicine · doi:10.1097/00003246-198608000-00028 · Cited by 13,379
Bone, R. C., BALK, R. A., Cerra, F. B., Dellinger, R. P., Fein, A. M., Knaus, W. A., Schein, R. M. H., & Sibbald, W. J. (1992) · CHEST Journal · doi:10.1378/chest.101.6.1644 · Cited by 13,335
Chen, Y., Wang, L., Kang, Q., Zhang, X., Yu, G., Wan, X., Wang, J., & Zhu, K. (2017) · Cellular Physiology and Biochemistry · doi:10.1159/000477308 · Cited by 10,730
APACHE II: a severity of disease classification system.
Knaus, W. A., Draper, E. S., Wagner, D. P., & Zimmerman, J. E. (1985) · PubMed · Cited by 6,034
American College of Chest Physicians/Society of Critical Care Medicine Consensus Conference
(1992) · Critical Care Medicine · doi:10.1097/00003246-199206000-00025 · Cited by 5,134
Surviving Sepsis Campaign: International guidelines for management of sepsis and septic shock: 2016.
Rhodes, A., Evans, L. E., Alhazzani, W., Levy, M. M., Antonelli, M., Ferrer, R., Kumar, A., Sevransky, J. E., Sprung, C. L., Nunnally, M. E., et al. (2017) · Critical Care Medicine · doi:10.1097/ccm.0000000000002255 · Cited by 3,652
Hematological Problems in Pediatric Intensive Care
Revel‐Vilk, S., Cox, P. N., Robitaille, N., & Blanchette, V. S. (2013) · Pediatric and adolescent medicine · doi:10.1159/000350346 · Cited by 3,526
Cited by
Sorted by citations
Items 101–193 of 193
Sater, M. S., Almansour, N., Malalla, Z. H. A., Fredericks, S., Ali, M. E., & Giha, H. A. (2025) · Diagnostics · doi:10.3390/diagnostics15020217 · Cited by 6
Kanoi, B. N., & Egwang, T. G. (2021) · Parasitology International · doi:10.1016/j.parint.2021.102387 · Cited by 6
Li, Y., Hsu, D.-Z., Liu, C.-T., Chandrasekaran, V. R. M., & Liu, M. (2022) · Canadian Journal of Physiology and Pharmacology · doi:10.1139/cjpp-2021-0682 · Cited by 9
Trovão, L. O., Rodrigues, L. D. S., Mendes, P. M., Alves, P. C. S., Oliveira, A. D. S., Brito, J. M., Vale, A. Á. M., Garbis, D. V. D. O., Simão, G., dos Santos, A. P. S. D. A., et al. (2023) · Journal of Immunology Research · doi:10.1155/2023/2868707 · Cited by 6
Sari, M. I., Jusuf, N. K., Munir, D., Putra, A. B., Bisri, T., Ilyas, S., Farhat, F., Muhar, A. M., Rusda, M., & Amin, M. M. (2023) · Biomedicines · doi:10.3390/biomedicines11082325 · Cited by 8
Trevelin, S. C., Sag, C. M., Zhang, M., Alves-Filho, J. C., Cunha, T. M., dos Santos, C. X., Sawyer, G. J., Murray, T. V., Brewer, A. C., Laurindo, F. R. M., et al. (2020) · Shock · doi:10.1097/shk.0000000000001706 · Cited by 7
Park, J. E., Jo, Y. H., Hwang, S. Y., Kim, W. Y., Ryoo, S. M., Jang, D.-H., Kim, T., Kim, Y.-J., Kim, S., Cho, H., et al. (2021) · Shock · doi:10.1097/shk.0000000000001850 · Cited by 7
Hemoadsorption in Children with Cytokine Storm Using the Jafron HA330 and HA380 Cartridges
Azenova, K., & Sazonov, V. (2025) · Journal of Clinical Medicine · doi:10.3390/jcm14186359 · Cited by 5
Electrochemical Biosensors for Sepsis Detection in Liver Cirrhosis: Advances and Insights
Kaur, M., & Singh, N. (2025) · ACS Applied Bio Materials · doi:10.1021/acsabm.5c00545 · Cited by 5
Buys, W., Bick, A., Madel, R. J., Westendorf, A. M., Buer, J., Herbstreit, F., Kirschning, C. J., & Peters, J. (2023) · Frontiers in Immunology · doi:10.3389/fimmu.2023.1277033 · Cited by 5
A humoral solution: Autologous blood products and tissue repair
Yogev, Y. (2020) · Cellular Immunology · doi:10.1016/j.cellimm.2020.104178 · Cited by 5
Breda, C. N. D. S., Breda, L. C. D., Carvalho, L. A. D. C., Amano, M. T., Terra, F. F., Silva, R. C., de Fragas, M. G., Forni, M. F., Fonseca, M. T., Venturini, G., et al. (2021) · The Journal of Immunology · doi:10.4049/jimmunol.2000573 · Cited by 6
Niedźwiedź, A., Pius‐Sadowska, E., Kawa, M. P., Kuligowska, A., Parczewski, M., Safranow, K., Kozłowski, K., Machaliński, B., & Machalińska, A. (2022) · Pathogens · doi:10.3390/pathogens11101098 · Cited by 5
Sepsis-Associated Brain Dysfunction: Mechanisms, Clinical Insights, and Therapeutic Strategies
Payal, N., Saxena, J., Srivatsava, V. K., Kaushik, S., Siddiqui, A. J., Chauhan, K., Sharma, A., Jyoti, A., & Sharma, L. (2025) · Current Drug Targets · doi:10.2174/0113894501381183250825144834 · Cited by 4
Characteristics and Risk Factors for Pediatric Sepsis
Zhu, Y., Liu, T.-L., Dai, Q., Liu, S.-F., Xiong, P., Huang, H., Yuan, Y., Zhang, T., & Chen, Y. (2024) · Current Medical Science · doi:10.1007/s11596-024-2870-6 · Cited by 4
Sympathetic regulation of the host immune response to bacterial sepsis
Nguyen, H., Bastow, C. R., Wen, S., & Wong, C. H. Y. (2025) · Clinical Science · doi:10.1042/cs20256909 · Cited by 4
Armstrong, A., Tang, Y., Mukherjee, N. Z., Zhang, N., & Huang, G. (2024) · Frontiers in Immunology · doi:10.3389/fimmu.2024.1448201 · Cited by 4
Burov, А. I., Абрамов, Т. А., Kostritca, N. S., Korotkov, D. S., Danilov, G., Strunina, Y. V., & Савин, И. А. (2021) · European journal of medical research · doi:10.1186/s40001-021-00614-7 · Cited by 4
Bick, A., Buys, W., Engler, A., Madel, R. J., Atia, M., Faro, F., Westendorf, A. M., Limmer, A., Buer, J., Herbstreit, F., et al. (2022) · PLoS ONE · doi:10.1371/journal.pone.0273247 · Cited by 4
Faustova, M. O., Nazarchuk, O. A., Dmytrіiev, D., Аветіков, Д. С., Лобань, Г. А., Babina, Y., & Ananieva, M. M. (2021) · AFMN Biomedicine · doi:10.5937/afmnai39-34181 · Cited by 4
Granzyme A inhibition reduces inflammation and increases survival during abdominal sepsisPreprint
Garzón-Tituaña, M., Sierra-Monzón, J. L., Comas, L., Santiago, L., Ushakova, T. K., Uranga-Murillo, I., Ramírez-Labrada, A., Tapia, E., Morte-Romea, E., Algarate, S., et al. (2020) · bioRxiv (Cold Spring Harbor Laboratory) · doi:10.1101/2020.06.05.135814 · Cited by 4
Thrombocytopenia Independently Leads to Monocyte Immune DysfunctionPreprint
Li, C., Ture, S. K., Nieves-López, B., Blick-Nitko, S. K., Maurya, P., Livada, A. C., Stahl, T. J., Kim, M., Pietropaoli, A. P., & Morrell, C. N. (2023) · bioRxiv (Cold Spring Harbor Laboratory) · doi:10.1101/2023.05.10.540214 · Cited by 4
Molecular analysis of immune cell subsets and cytokine profiles in septic Vietnamese patients
Huynh, C. D., Nguyen, P. M., Ngo, T. D., Nguyen, X., Nguyen, T. D., Thi, H., Le, H. T., Hoang, D. M., Le, L. K., Nguyen, Q. K., et al. (2025) · Clinical and Experimental Medicine · doi:10.1007/s10238-025-01862-1 · Cited by 3
Daňková, V., Exnerová, A., Vágnerová, H., Pavlík, V., & Nešporová, K. (2025) · Biomolecules · doi:10.3390/biom16010002 · Cited by 3
Brogi, E., Cremonini, C., Ceresoli, M., Catena, F., Gurrado, A., Forfori, F., Ghiadoni, L., Melai, E., IRIS study group, Musetti, S., et al. (2026) · Journal of Anesthesia Analgesia and Critical Care · doi:10.1186/s44158-026-00338-2 · Cited by 3
Recent advances in the biosensing platforms for sepsis diagnosis
Mishra, V. D., Pandey, M., Kumar, H., Panigrahi, P. K., & Bhattacharya, S. (2026) · RSC Advances · doi:10.1039/d5ra06963g · Cited by 3
LUNG PROTECTIVE EFFECTS OF CLOPIDOGREL IN POLYMICROBIAL SEPSIS
Mueen, R. M., & Hadi, N. R. (2023) · Polski Merkuriusz Lekarski · doi:10.36740/merkur202304104 · Cited by 3
Brunsch, V., Bergmann‐Ewert, W., Müller‐Hilke, B., & Aleith, J. (2025) · Medical Microbiology and Immunology · doi:10.1007/s00430-025-00826-2 · Cited by 3
Pérez-Hernández, E. G., de León, V. D. L. P.-D., Luna-Reyes, I., Delgado‐Coello, B., Sifuentes‐Osornio, J., & Mas‐Oliva, J. (2022) · Molecular Medicine · doi:10.1186/s10020-022-00585-3 · Cited by 3
Identification of Clinically Significant Cytokine Signature Clusters in Patients With Septic Shock
Zhao, J., Patel, B. K., Krishack, P. A., Stutz, M. R., Pearson, S. D., Lin, J., Lecompte-Osorio, P. A., Dugan, K. C., Kim, S., Gras, N., et al. (2023) · Critical Care Medicine · doi:10.1097/ccm.0000000000006032 · Cited by 3
Exosome Secretion Regulation in Mice with Acute Lung Injury
Jie, H., & Lü, W. (2025) · Journal of Inflammation Research · doi:10.2147/jir.s506693 · Cited by 3
Evaluation of cytokine response to extracorporeal membrane oxygenation
Liu, T. X., Amos, S. H., Ganga, A. L., Bullins, C. M., Jennings, C. D., Arnold, W. S., & Joseph, M. (2021) · Artificial Organs · doi:10.1111/aor.14079 · Cited by 2
Perschinka, F., Lehner, G. F., Mayerhöfer, T., Köhler, A., Hasibeder, W. R., Krismer, C., Killian, J., Fries, D. R., Bösch, J., Perschinka, N., et al. (2025) · Viruses · doi:10.3390/v17121617 · Cited by 3
Koga, T., Furukawa, K., Migita, K., Morimoto, S., Shimizu, T., Fukui, S., Umeda, M., Endo, Y., Sumiyoshi, R., Kawashiri, S., et al. (2021) · Arthritis Research & Therapy · doi:10.1186/s13075-021-02644-2 · Cited by 2
Growth Differentiation Factor-15 Correlates with Mortality and Severity in Severe Burns
Onishi, S., Ebihara, T., Togami, Y., Matsubara, T., Matsumoto, H., Osuka, A., Ogura, H., & Oda, J. (2022) · Shock · doi:10.1097/shk.0000000000001925 · Cited by 2
Self-citationGan, J., Zhang, W., Pan, F., Qiu, Z., & Chen, X. (2025) · Molecular Biology Reports · doi:10.1007/s11033-024-10212-5 · Cited by 1
Chekroune, T., Carignon, S., Taleb, M., Savigny, F., Rose, S., Maillet, I., & Mura, C. (2025) · Frontiers in Immunology · doi:10.3389/fimmu.2025.1610033 · Cited by 1
Patel, P., Agnihotri, G., Siddappa, S., Ravindran, B., & Saiyed, T. (2025) · ACS Omega · doi:10.1021/acsomega.5c05936 · Cited by 1
Frapard, T., Gendreau, S., Kasbi, A., Meyer, A., Razazi, K., de Prost, N., Lavillegrand, J., & Dessap, A. M. (2026) · Annals of Intensive Care · doi:10.1016/j.aicoj.2026.100027 · Cited by 2
Biocompatibility and toxicity challenges of green carbon dots
Gulati, S., Ansari, N., & Chandel, S. (2026) · Elsevier eBooks · doi:10.1016/b978-0-443-34121-2.00020-0 · Cited by 1
Ghelfi, L., Mongan, D., Murphy, J., Staines, L., Healy, C., Susai, S. R., Khandaker, G. M., Cannon, M. D., & Cotter, D. (2026) · Brain Behavior and Immunity · doi:10.1016/j.bbi.2026.106828 · Cited by 1
Mesenchymal stem cell - derived extracellular vesicles modulate immune function in sepsis
Meng, Q., Song, Y., Wang, C., Novak, A., Taneja, N., Ma, Z., Helkin, A. W., & Cooney, R. N. (2026) · Frontiers in Immunology · doi:10.3389/fimmu.2026.1881925 · Cited by 1
Pawlik, R. J., Petrakova, L., Brotte, L., Engler, H., Benson, S., & Elsenbruch, S. (2022) · Frontiers in Neuroscience · doi:10.3389/fnins.2022.876490 · Cited by 1
Blaess, M. F., Sommerfeld, O., Csük, R., & Deigner, H. (2022) · Exploration of Immunology · doi:10.37349/ei.2022.00063 · Cited by 1
Brunialti, M. K. C., Leite, G. G. F., Eburneo, G. S., de Araújo, O. R., Pietrobom, P. M. P., Ferreira, P. R. A., Bellei, N., Arakaki, J. S. O., Medina-Pestana, J. O., Requião‐Moura, L., et al. (2023) · Viruses · doi:10.3390/v15112166 · Cited by 1
Sater, M. S. (2025) · International Journal of Clinical and Experimental Medicine · doi:10.62347/kdcd8395 · Cited by 1
Razavi, S. D., Ahmadi-Roknabadi, F., Safarian, M., Mehdipour, A., Anbarian, A., Mirzamohammadi, M., Zeinali, M., & Arababadi, M. K. (2019) · Проблеми радіаційної медицини та радіобіології = Problems of Radiation Medicine and Radiobiology · doi:10.33145/2304-8336-2019-24-449-454 · Cited by 1
Chávez, M., Caicedo, L., & Puerta, M. G. (2019) · Archivos de Medicina (Manizales) · doi:10.30554/archmed.20.1.3442.2020 · Cited by 1
The Role of Cytokine in the Diagnosis and Monitoring of Patients with Systemic Infections
Iancu, A. V., Gurău, G., Dumitru, C. N., Baroiu, L., Chifiriuc, M. C., Lazăr, V., Arbune, M., Coman, G., & Draganescu, M. L. (2020) · Revista de Chimie · doi:10.37358/rc.20.7.8263 · Cited by 1
G-Trap Assay I: Small GTPases as sensitive immune response biomarkers for active bacteremiaPreprint
Clark, R. M., Bondu, V., Simons, P. C., Shevy, L., Young, S. A., Castillo, E. F., Kanagy, N. L., Wandinger‐Ness, A., Howdieshell, T. R., & Buranda, T. (2022) · bioRxiv (Cold Spring Harbor Laboratory) · doi:10.1101/2022.06.09.495550 · Cited by 1
Simons, P. C., Shevy, L., Bondu, V., Wandinger‐Ness, A., Young, S. A., & Buranda, T. (2022) · bioRxiv (Cold Spring Harbor Laboratory) · doi:10.1101/2022.06.09.495553 · Cited by 1
Hakanpää, L. (2020) · Työväentutkimus Vuosikirja
Arch Med (Manizales) 20(1) 2020 Fascículo completo.
Castrillón, J. J. C. (2020) · Archivos de Medicina (Manizales) · doi:10.30554/archmed.20.1.3702.2020
Evaluation of cytokine storms in a disseminated intravascular coagulation monkey model
Hirasawa, Y., Fujiwara, A., Tabata, K., Yoshida, K., Negama, T., Anzai, T., & Sato, S. (2020) · Fundamental Toxicological Sciences · doi:10.2131/fts.7.105
IL-1, IL-6, TNF-α, and MIF in relative adrenal insufficiency in septic shock: a piglet model
Akura, B., Batubara, J. R. L., Munasir, Z., Gunanti, Prihartono, J., Satari, H. I., Immanuel, S., & Somasetia, D. H. (2020) · Medical Journal of Indonesia · doi:10.13181/mji.oa.202943
Herwanto, V., Wang, Y., Shojaei, M., Khan, A., Lai, K., Shetty, A., Huang, S., Chew, T., Teoh, S., Nalos, M., et al. (2020) · medRxiv · doi:10.1101/2020.12.10.20244707
Adipocytokine Profile Reveals a Significant Cytokine Network in the Acute Phase of SepsisPreprint
Ebihara, T., Matsumoto, H., Matsubara, T., Matsuura, H., Hirose, T., Shimizu, K., Ogura, H., Kang, S., Tanaka, T., & Shimazu, T. (2020) · doi:10.21203/rs.3.rs-99736/v1
Self-citationAnalysis of Cell Signaling Perturbations in Response to Chronic Localized Infections
Prince, A. N. (2021) · The Research Repository @ WVU (West Virginia University) · doi:10.33915/etd.8145
Chávez, M., Caicedo, L. L., & Puerta, M. G. (2020) · Redalyc (Universidad Autónoma del Estado de México)
Brunialti, M. K. C., Leite, G. G. F., de Araújo, O. R., Eburneo, G. S., Pietrobom, P. M. P., Ferreira, P. R. A., Bellei, N., Arakaki, J. S. O., Requião‐Moura, L., & Salomão, R. (2022) · Research Square · doi:10.21203/rs.3.rs-1184252/v1
Hide, W. (2021) · Faculty Opinions – Post-Publication Peer Review of the Biomedical Literature · doi:10.3410/f.739682615.793583703
Germain, R. N., & Khan, M. M. (2019) · Faculty Opinions – Post-Publication Peer Review of the Biomedical Literature · doi:10.3410/f.734913249.793562347
de França, F. S. (2021) · Digital Library of Theses and Dissertations (Universidade de São Paulo) · doi:10.11606/t.42.2021.tde-04052022-155627
The Pathological Changes Seen in Cardiac Diseases Indicated for Transplantation
Al‐Obaidi, A. D., Mutar, M. T., Majid, M., Ahmad, S. S., Bakose, R. Y., Al‐Obaidi, M. N., Al-Abbasi, H., Shaalan, S. S., & Ismail, M. (2022) · Springer eBooks · doi:10.1007/978-3-031-17311-0_4
Protective Effects of Ramelteon on Acute Lung Injury in Endotoxin-Induced Sepsis in Rats
Yüksel, T. N., Köse, D., Gürbüz, M. A., Halıcı, Z., Canbolat, F., & Bozgeyi̇k, E. (2023) · Van Medical Journal · doi:10.5505/vtd.2023.62582
Hamidizadeh, N., Fotoohi, M., Jafari, P., Pirbonyeh, N., Ranjbar, S., Zardosht, M., & Mohamdi, A. A. (2023) · SSRN Electronic Journal · doi:10.2139/ssrn.4663030
Association between cytokine network and organ damage in crush syndromePreprint
Matsumoto, H., Imamura, Y., Shimizu, K., Ogura, H., & Oda, J. (2024) · Research Square · doi:10.21203/rs.3.rs-3850901/v1
Self-citationCorrelation Between I/T Ratio, S100B, Interleukin-10 Serum, and NEWS2 Score in Sepsis
Lestari, N. A., Suromo, L., Hendrianingtyas, M., Setyadi, A., & Retnoningrum, D. (2024) · ACTA MEDICA IRANICA · doi:10.18502/acta.v61i10.15658
Identifying Host and Bacterial Biomarkers to Predict Sepsis
Lewis, M. L. (2024) · Cronfa (Swansea University) · doi:10.23889/suthesis.66753
Gülin, F. S. (2024) · Digital Library of Theses and Dissertations (Universidade de São Paulo) · doi:10.11606/t.22.2024.tde-25062024-101010
Shen, T., Lv, X., Shen, Y., Zhou, W., Liu, X., Ma, Q., Ma, S., Sheng, S., & Zhu, F. (2024) · Research Square · doi:10.21203/rs.3.rs-4577576/v1
D’Amico, R. C., Nagashima, S., Carstens, L. B., Bertoldi, K., Mataruco, S., D’Agostini, J. C. H., Hlatchuk, E. C., da Silva, S. B., de Noronha, L., & Baena, C. P. (2025) · International Journal of Molecular Sciences · doi:10.3390/ijms26041541
Shen, T., Lv, X., Shen, Y., Zhou, W., Liu, X., Ma, Q., Sheng, S., & Zhu, F. (2025) · Research Square · doi:10.21203/rs.3.rs-6455319/v1
Yi, X., Yang, X., Shen, X., Huang, S., Zheng, M., Mao, H., Lin, T., & Jin, Y. (2025) · Research Square · doi:10.21203/rs.3.rs-6703771/v1
Modeling Physiological and Neuronal Systems
Sawicki, J. (2025) · Current research in systematic musicology · doi:10.1007/978-3-031-97003-0_4
Interleukin-8 Predicts Fatal Kala-Azar: A Case–Control Study
Lima, S. S., Bráz, D. C., Silva, V. C., Pereira, T. D. J. C. F., Carvalho, L. K. D. C. A. A., Costa, D. L., & Costa, C. H. N. (2025) · Tropical Medicine and Infectious Disease · doi:10.3390/tropicalmed10090250 · Cited by 1
Ibrahim, U. H., Xulu, K., Valjee, R. B., Niesler, C. U., & Mackraj, I. (2025) · Immunological Investigations · doi:10.1080/08820139.2025.2572521
Bondarenko, O. I., & Kyiko, P. A. (2025) · Kharkiv Surgical School · doi:10.37699/2308-7005.2.2025.48
Identifying effective diagnostic biomarkers in sepsis by bioinformatics analysis
Han, M., Zheng, H., Wang, D., & Lyu, Y. (2025) · Computer Methods in Biomechanics & Biomedical Engineering · doi:10.1080/10255842.2025.2595138
Harviendo, G. Y., Adhipireno, P., Rachmawati, B., Limijadi, E. K. S., & Retnoningrum, D. (2025) · Acta Medica Bulgarica · doi:10.2478/amb-2025-0070
Pérez-Hernández, E. G., De la Puente-Díaz de León, V., Luna-Reyes, I., Delgado‐Coello, B., Sifuentes‐Osornio, J., & Mas‐Oliva, J. (2023) · Figshare · doi:10.6084/m9.figshare.22611448
Koga, T., Furukawa, K., Migita, K., Morimoto, S., Shimizu, T., Fukui, S., Umeda, M., Endo, Y., Sumiyoshi, R., Kawashiri, S.-Y., et al. (2021) · Figshare · doi:10.6084/m9.figshare.16821593
Tan, K., Minejima, E., Lou, M., Mack, W. J., Nieberg, P., & Wong‐Beringer, A. (2021) · Figshare · doi:10.6084/m9.figshare.14374719
Telodendrimer nanotrap for selective cytokine removal from sepsis patient plasma
Messina, J. M., Guo, D., Shi, C., Valenzuela-Faccini, N., Meng, Q., Cooney, R. N., & Luo, J. (2026) · Frontiers in Immunology · doi:10.3389/fimmu.2026.1633723
Clère-Jehl, R. (2020) · theses.fr (ABES) · doi:10.70675/a65a57a6ze1d1z47baz8fa5zabef17722df4
Crausaz, M. (2022) · theses.fr (ABES) · doi:10.70675/d0a5defazaeb0z46a2zb177z225779634e8f
Slek, C. (2024) · theses.fr (ABES) · doi:10.70675/c92aeb34z4bf6z4ac1z8b86z05b8b0931355
Elevated sCD25 predicts early infection in patients with major burns
Hurtado‐Navarro, L., Cabeza, E. F., Mata-Martínez, P., Sánchez-Sánchez, M., Terrón‐Arcos, V., Martín-Flórez, C., Cachafeirio, L., Vejo-Gutiérrez, J., Fernández-Felipe, J., Lozano‐Rodríguez, R., et al. (2026) · Critical Care · doi:10.1186/s13054-026-06105-7
Qi, H., Zhang, X., Ma, Y., Pan, S., Wu, C., Ye, B., Ye, Y., Yang, X. L., Zhang, S., & Xu, K. (2026) · Journal of Leukocyte Biology · doi:10.1093/jleuko/qiag098
Pathophysiology and Biomarkers of Secondary Multiple Organ Dysfunction Syndrome
Emura, I., & Usuda, H. (2026) · Physiologia · doi:10.3390/physiologia6030047
Cincović, M., Milosevic, N., Majkić, M., Hodnik, J. J., Kramberger, B., & Starič, J. (2026) · Frontiers in Veterinary Science · doi:10.3389/fvets.2026.1923985
Walkowicz, M., Jarczewski, J., Słomiński, B., Bierzanowski, S., Pietruczuk, K., & Steckiewicz, K. P. (2026) · Frontiers in Bioengineering and Biotechnology · doi:10.3389/fbioe.2026.1942504
Metadata
- Authors
- Matsumoto, H., Ogura, H., Shimizu, K., Ikeda, M., Hirose, T., Matsuura, H., Kang, S., Takahashi, K., Tanaka, T., & Shimazu, T.
- Affiliations
- The University of Osaka (JP)
- Osaka City University (JP)
- Corresponding author
- Matsumoto, Hisatake
- ORCID
- Venue
- Scientific Reports
- Published
- 2018-09-18
- Volume
- 8
- Issue
- 1
- Pages
- 13995-13995
- ISSN
- 2045-2322 (ISSN-L)
- PMC
- PMC6143513
- OpenAlex
- W2891533504
- Cited by
- 193
- References
- 47
- Citations by year
- 2026: 14 · 2025: 30 · 2024: 20 · 2023: 18 · 2022: 36 · 2021: 34 · 2020: 27 · 2019: 14
- FWCI
- 14.63
- Type
- journal article
- Language
- en
- Open access
- gold
- doi.org
- Locations
- Scientific Reports (publishedVersion, cc-by)
- Europe PMC (PubMed Central) (publishedVersion, other-oa)
- PubMed Central (publishedVersion, cc-by)
- PubMed (publishedVersion)
- DOAJ (DOAJ: Directory of Open Access Journals) (submittedVersion)
- Funders
- A Grant-in-Aid for Scientific Research from the Ministry of Education, Culture, Sports, Science, and Technology in Japan.
- Topics
- Health Sciences › Medicine › Critical Care and Intensive Care Medicine › Sepsis Diagnosis and Treatment
- Life Sciences › Immunology and Microbiology › Immunology › Inflammation biomarkers and pathways
- Health Sciences › Medicine › Nephrology › Acute Kidney Injury Research
- Keywords
- sepsis, cytokine network, prognostic factors, interleukin-6, interleukin-8, MCP-1, IL-10, plasminogen activator inhibitor-1, SOFA score, disseminated intravascular coagulation, disease severity, network analysis
- MeSH terms
- Aged, Aged, 80 and over, Female, Follow-Up Studies, Humans, Male, Middle Aged, Prognosis, Prospective Studies, ROC Curve, Severity of Illness Index, Biomarkers, Survival Rate, Case-Control Studies, Cytokines, Disease Progression, Sepsis
About these checks
Registry, retraction, Cites and statistics results are computed, not judged, with one exception: a printed reference that no index lists is read once by a model before it counts as a citation error. Claims are extracted by a model and kept only when their quote appears verbatim in the text; each cited source is then checked, with a model’s help, for whether it says what the claim relies on. Those verdicts can be wrong — read the claim’s quote and the cited source before relying on one.
Statistics and arithmetic are recomputed, not judged.
Confidence bands are shown only for fields calibrated on our annotated test set. None is calibrated yet, so no band is shown.
What counts as a claim ›How we measure confidence ›How we check this ›
Are you an author, or do you see a problem with this page? Request a review
