

The DOI matches its Crossref record; 40 of the 40 references it cites were found in a registry or an index.
Lifelong physical activity is associated with promoter hypomethylation of genes involved in metabolism, myogenesis, contractile properties and oxidative stress resistance in aged human skeletal muscle
Open accessAbstract
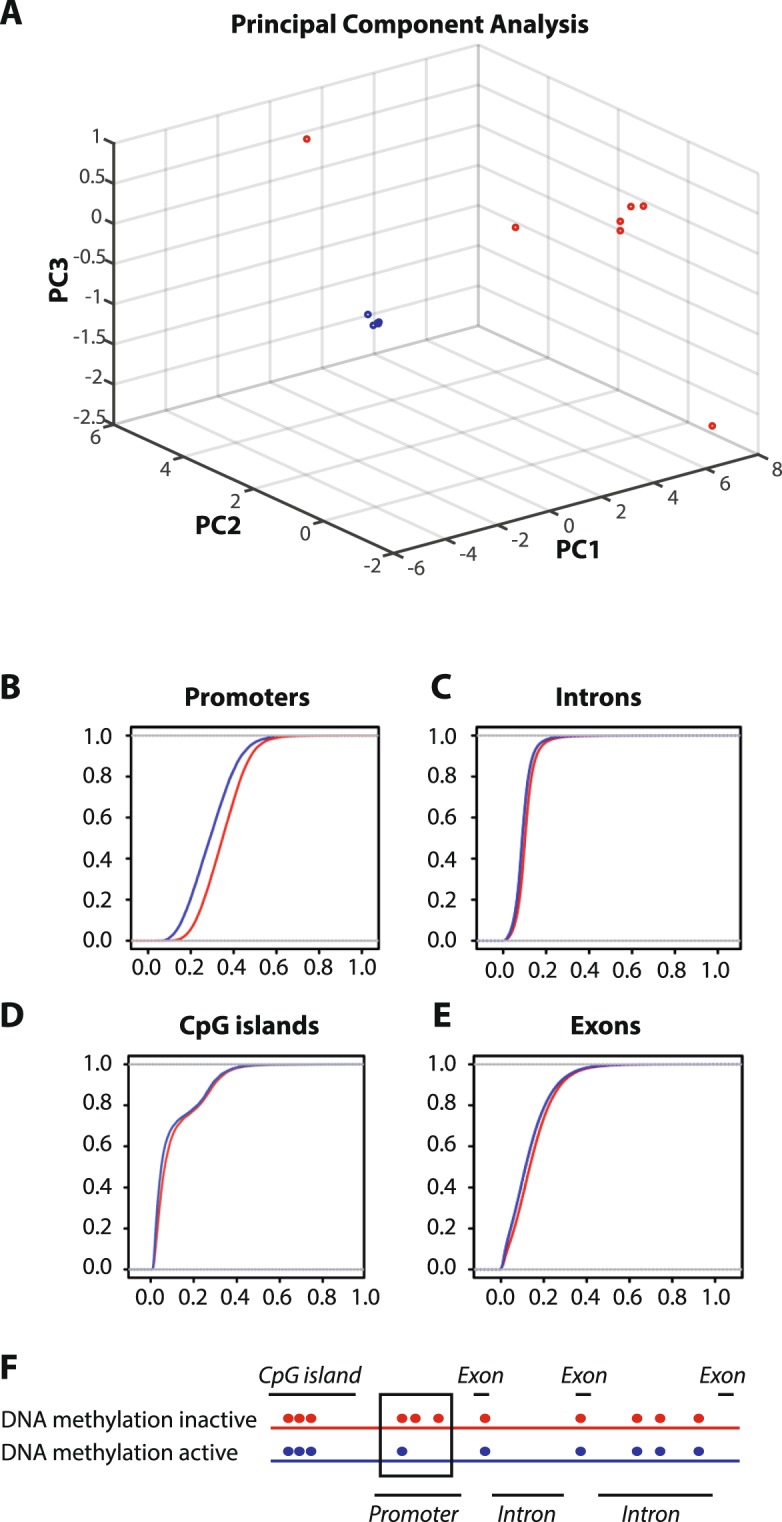
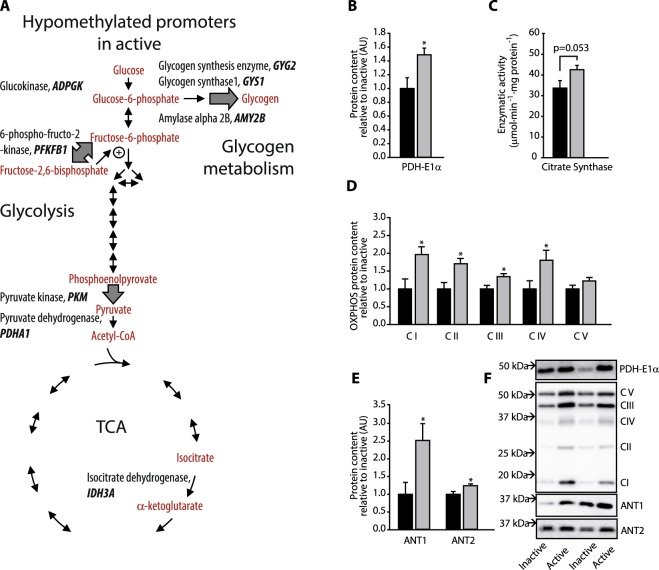
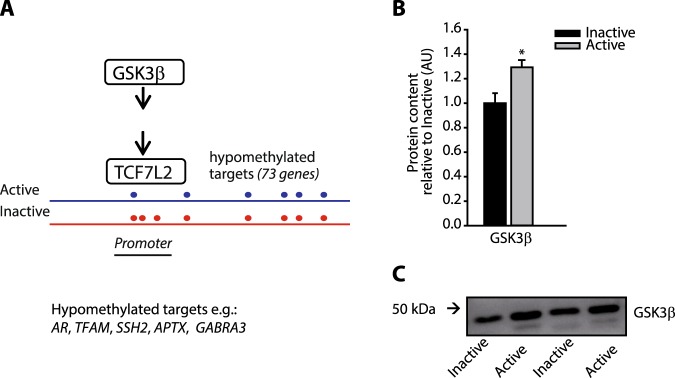
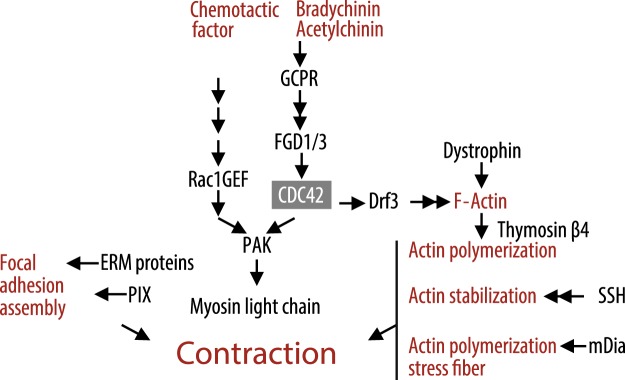
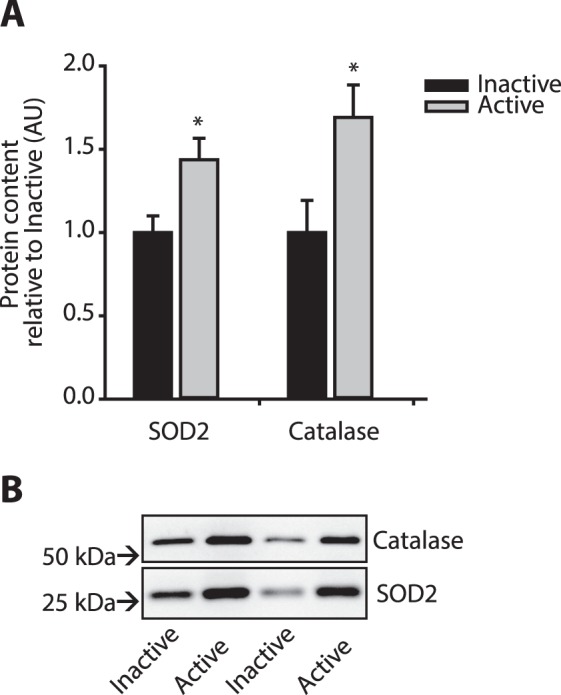
Lifelong regular physical activity is associated with reduced risk of type 2 diabetes (T2D), maintenance of muscle mass and increased metabolic capacity. However, little is known about epigenetic mechanisms that might contribute to these beneficial effects in aged individuals. We investigated the effect of lifelong physical activity on global DNA methylation patterns in skeletal muscle of healthy aged men, who had either performed regular exercise or remained sedentary their entire lives (average age 62 years). DNA methylation was significantly lower in 714 promoters of the physically active than inactive men while methylation of introns, exons and CpG islands was similar in the two groups. Promoters for genes encoding critical insulin-responsive enzymes in glycogen metabolism, glycolysis and TCA cycle were hypomethylated in active relative to inactive men. Hypomethylation was also found in promoters of myosin light chain, dystrophin, actin polymerization, PAK regulatory genes and oxidative stress response genes. A cluster of genes regulated by GSK3β-TCF7L2 also displayed promoter hypomethylation. Together, our results suggest that lifelong physical activity is associated with DNA methylation patterns that potentially allow for increased insulin sensitivity and a higher expression of genes in energy metabolism, myogenesis, contractile properties and oxidative stress resistance in skeletal muscle of aged individuals.
Overview
The claims and statistics of this paper haven’t been checked yet.
Run the check — free, no account needed. It reads the open-access text and checks the sources it cites.
Integrity signals
Registry
Cites
Statistics
Figures
Verification
Claims the paper makes
The claims and statistics of this paper haven’t been checked yet.
Run the check — free, no account needed. It reads the open-access text and checks the sources it cites.
Claims other papers make about this one
Each is checked against this paper’s own text: does it say what the citing paper says it does?
In the citing paper
“lifelong mixed-modality endurance exercise training may help reduce DNA methylation in the promoter regions of glycolysis, glycogen synthesis, and TCA-related genes in aged human skeletal muscle, thereby maintaining muscle mass and increasing metabolic capacity [70].”
From Exerkines and Sarcopenia: Unveiling the Mechanism Behind Exercise-Induced Mitochondrial Homeostasis (2025) · cites this paper as [70]
Self-check
Percentages, sums and reported differences re-computed from the paper’s own numbers.
The self-check needs the paper’s full text.
Citations
Cites
Enrichr: a comprehensive gene set enrichment analysis web server 2016 update
Kuleshov, M. V., Jones, M. R., Rouillard, A. D., Fernandez, N. F., Duan, Q., Wang, Z., Koplev, S., Jenkins, S. L., Jagodnik, K. M., Lachmann, A., et al. (2016) · Nucleic Acids Research · doi:10.1093/nar/gkw377 · Cited by 10,799
Bismark: a flexible aligner and methylation caller for Bisulfite-Seq applications
Krueger, F., & Andrews, S. (2011) · Bioinformatics · doi:10.1093/bioinformatics/btr167 · Cited by 5,324
A Flexible System of Enzymatic Analysis
Lowry, O. H., & Passonneau, J. V. (1972) · Elsevier eBooks · doi:10.1016/b978-0-12-457950-7.x5001-3 · Cited by 4,050
Schreck, R., RIEBER, P., & Baeuerle, P. A. (1991) · The EMBO Journal · doi:10.1002/j.1460-2075.1991.tb07761.x · Cited by 3,793
Pax7 Is Required for the Specification of Myogenic Satellite Cells
Seale, P., Sabourin, L. A., Girgis-Gabardo, A., Mansouri, A., Gruß, P., & Rudnicki, M. A. (2000) · Cell · doi:10.1016/s0092-8674(00)00066-0 · Cited by 2,345
Variant of transcription factor 7-like 2 (TCF7L2) gene confers risk of type 2 diabetes
Grant, S. F. A., Thorleifsson, G., Reynisdottir, I., Benediktsson, R., Manolescu, A., Sainz, J., Helgason, A., Stefansson, H., Emilsson, V., Helgadottir, A., et al. (2006) · Nature Genetics · doi:10.1038/ng1732 · Cited by 2,287
methylKit: a comprehensive R package for the analysis of genome-wide DNA methylation profiles
Akalin, A., Kormáksson, M., Li, S., Garrett-Bakelman, F. E., Figueroa, M. E., Melnick, A. M., & Mason, C. E. (2012) · Genome biology · doi:10.1186/gb-2012-13-10-r87 · Cited by 2,269
Hoeijmakers, J. H. J. (2009) · New England Journal of Medicine · doi:10.1056/nejmra0804615 · Cited by 2,239
Decline in skeletal muscle mitochondrial function with aging in humans
Short, K. R., Bigelow, M. L., Kahl, J., Singh, R., Coenen-Schimke, J., Raghavakaimal, S., & Nair, K. S. (2005) · Proceedings of the National Academy of Sciences · doi:10.1073/pnas.0501559102 · Cited by 1,333
Acute Exercise Remodels Promoter Methylation in Human Skeletal Muscle
Barrès, R., Yan, J., Egan, B., Treebak, J. T., Rasmussen, M., Fritz, T., Caidahl, K., Krook, A., O'Gorman, D. J., & Zierath, J. R. (2012) · Cell Metabolism · doi:10.1016/j.cmet.2012.01.001 · Cited by 965
Cited by
Sorted by citations
Items 101–135 of 135
The epigenetic landscape of skeletal muscle in response to exercise and aging
Champsi, S., & Hood, D. A. (2026) · FEBS Journal · doi:10.1111/febs.70591 · Cited by 1
Heikkinen, A., Lundgren, S., & Ollikainen, M. (2022) · Elsevier eBooks · doi:10.1016/b978-0-12-821514-2.00033-7 · Cited by 1
A influência do exercício físico sob o estresse oxidativo em idosos: uma revisão narrativa
da Silva, E. C., da Silva, A. P. N. A., Malta, W. V., de Lima, B. B. C., Gomes, A. D. S., Cavalcanti, P. R. J. L., da Silva, M. C., de Lira, M. C., & Ferreira, E. H. D. M. (2022) · Revista Eletrônica Acervo Saúde · doi:10.25248/reas.e11135.2022 · Cited by 1
Levasseur, B. M., Young, E. E., & Christianson, J. A. (2023) · Springer eBooks · doi:10.1007/978-3-031-25702-5_5 · Cited by 1
Is Biological Aging a Treatable Disease? A Consideration Based on Proposed Mechanisms of Aging
Goto, S. (2024) · YAKUGAKU ZASSHI · doi:10.1248/yakushi.23-00165-5 · Cited by 1
Neuro-molecular Effects of Yoga and Endurance Exercises: Similarities and Dissimilarities
Sharma, K., Arya, K., Kumar, S., & Sharma, S. (2024) · Springer eBooks · doi:10.1007/978-981-97-2851-0_9 · Cited by 1
Fancourt, D. E., Masebo, L., Finn, S., Mak, H. W., & Bu, F. (2024) · medRxiv · doi:10.1101/2024.11.01.24316559 · Cited by 1
Naimo, M. A. (2019) · The Research Repository @ WVU (West Virginia University) · doi:10.33915/etd.4094
Cruz, M. A. D., Ulfenborg, B., Blomstrand, P., Faresjö, M., Ståhl, F. L., & Karlsson, S. (2022) · Research Square · doi:10.21203/rs.3.rs-1391526/v1
Cruz, M. A. D., Ulfenborg, B., Blomstrand, P., Faresjö, M., Ståhl, F. L., & Karlsson, S. (2022) · Research Square · doi:10.21203/rs.3.rs-1391526/v2
Gorski, P. P., Raastad, T., Ullrich, M., Turner, D. C., Hallén, J., Sarvari, S. I., Nilsen, T. S., & Sharples, A. P. (2022) · medRxiv · doi:10.1101/2022.09.12.22279705
Epigenetische Veränderungen in Zusammenhang mit Bewegungstherapie
Völker-Albert, M. C. (2023) · B&G Bewegungstherapie und Gesundheitssport · doi:10.1055/a-2107-7636
Suhaimi, N. F. (2023) · Malaysian Journal of Medicine and Health Sciences · doi:10.47836/mjmhs.19.s14.15
Brandão, C., Rodrigues, G. S., Noronha, N. Y., Nicoletti, C. F., Junqueira‐Franco, M. V. M., Alves, C. P., Diani, L. M., Carvalho, F. G., de Freitas, E. C., Nonino, C. B., et al. (2024) · Research Square · doi:10.21203/rs.3.rs-4119029/v1
Landen, S., Jacques, M., Hiam, D., Alvarez‐Romero, J., Schittenhelm, R. B., Shah, A. D., Huang, C., Steele, J. R., Harvey, N. R., Haupt, L. M., et al. (2023) · Figshare · doi:10.6084/m9.figshare.24091589
Multifactorial microbial networks shape aging and neurodegeneration
Kara, N. Z., Savaliya, J. H., & Blacher, E. (2024) · Elsevier eBooks · doi:10.1016/b978-0-443-18979-1.00002-2
Vasileva, F., Font-Lladó, R., López-Ros, V., Barretina, J., Noguera-Castells, A., Esteller, M., López-Bermejo, A., & Prats-Puig, A. (2025) · Scandinavian Journal of Medicine & Science in Sports · doi:10.1111/sms.70012 · Cited by 2
Mechanisms of Biological Aging with Special Reference to the Skeletal Muscle
Goto, S., & Radak, Z. O. (2025) · Advances in experimental medicine and biology · doi:10.1007/978-3-031-88361-3_13
Translating Epi-Proteomic Developments into Business Value for the Insurance Industry
Lüdemann, C., & Völker-Albert, M. C. (2025) · Zeitschrift für die gesamte Versicherungswissenschaft · doi:10.3790/zverswiss.2025.1468001
Geiger, C., Needhamsen, M., Emanuelsson, E. B., Norrbom, J., Steindorf, K., Sundberg, C. J., Reitzner, S. M., & Lindholm, M. E. (2024) · Figshare · doi:10.6084/m9.figshare.26743394
Dye, C. K., Corley, M. J., Ing, C. T., Lum‐Jones, A., Li, D., Mau, M. K. L. M., & Maunakea, A. K. (2022) · Figshare · doi:10.6084/m9.figshare.20336735
Dye, C. K., Corley, M. J., Ing, C. T., Lum‐Jones, A., Li, D., Mau, M. K. L. M., & Maunakea, A. K. (2022) · Figshare · doi:10.6084/m9.figshare.20336738
Landen, S., Jacques, M., Hiam, D., Alvarez‐Romero, J., Schittenhelm, R. B., Shah, A. D., Huang, C., Steele, J. R., Harvey, N. R., Haupt, L. M., et al. (2023) · Figshare · doi:10.6084/m9.figshare.24091598
Geiger, C., Needhamsen, M., Emanuelsson, E. B., Norrbom, J., Steindorf, K., Sundberg, C. J., Reitzner, S. M., & Lindholm, M. E. (2024) · Figshare · doi:10.6084/m9.figshare.26743391
Geiger, C., Needhamsen, M., Emanuelsson, E. B., Norrbom, J., Steindorf, K., Sundberg, C. J., Reitzner, S. M., & Lindholm, M. E. (2024) · Figshare · doi:10.6084/m9.figshare.26743400
Geiger, C., Needhamsen, M., Emanuelsson, E. B., Norrbom, J., Steindorf, K., Sundberg, C. J., Reitzner, S. M., & Lindholm, M. E. (2024) · Figshare · doi:10.6084/m9.figshare.26743397
Landen, S., Jacques, M., Hiam, D., Alvarez‐Romero, J., Schittenhelm, R. B., Shah, A. D., Huang, C., Steele, J. R., Harvey, N. R., Haupt, L. M., et al. (2023) · Figshare · doi:10.6084/m9.figshare.24091586
Geiger, C., Needhamsen, M., Emanuelsson, E. B., Norrbom, J., Steindorf, K., Sundberg, C. J., Reitzner, S. M., & Lindholm, M. E. (2024) · Figshare · doi:10.6084/m9.figshare.26743403
Dye, C. K., Corley, M. J., Ing, C. T., Lum‐Jones, A., Li, D., Mau, M. K. L. M., & Maunakea, A. K. (2022) · Figshare · doi:10.6084/m9.figshare.20336726
Dye, C. K., Corley, M. J., Ing, C. T., Lum‐Jones, A., Li, D., Mau, M. K. L. M., & Maunakea, A. K. (2022) · Figshare · doi:10.6084/m9.figshare.20336732
Dye, C. K., Corley, M. J., Ing, C. T., Lum‐Jones, A., Li, D., Mau, M. K. L. M., & Maunakea, A. K. (2022) · Figshare · doi:10.6084/m9.figshare.20336729
Geiger, C., Needhamsen, M., Emanuelsson, E. B., Norrbom, J., Steindorf, K., Sundberg, C. J., Reitzner, S. M., & Lindholm, M. E. (2024) · Figshare · doi:10.6084/m9.figshare.26743406
Landen, S., Jacques, M., Hiam, D., Alvarez‐Romero, J., Schittenhelm, R. B., Shah, A. D., Huang, C., Steele, J. R., Harvey, N. R., Haupt, L. M., et al. (2023) · Figshare · doi:10.6084/m9.figshare.24091601
Nalli, R., Elumalai, S., Raavi, V., & Likhit, M. (2026) · Gene Reports · doi:10.1016/j.genrep.2026.102464
SNP-derived CpG variation and DNA methylation linking genetic susceptibility to metabolic disease
Khanna, K., & Alam, S. (2026) · Epigenomics · doi:10.1080/17501911.2026.2705144
Metadata
- Authors
- Sailani, M. R., Halling, J. F., Møller, H. D., Lee, H., Plomgaard, P., Pilegaard, H., Snyder, M. P., & Regenberg, B.
- Affiliations
- Stanford Medicine (US)
- University of Copenhagen (DK)
- Copenhagen University Hospital (DK)
- Corresponding author
- Regenberg, Birgitte
- ORCID
- Venue
- Scientific Reports
- Published
- 2019-03-01
- Volume
- 9
- Issue
- 1
- Pages
- 3272-3272
- ISSN
- 2045-2322 (ISSN-L)
- PMC
- PMC6397284
- OpenAlex
- W2920732619
- Cited by
- 129
- References
- 40
- Citations by year
- 2026: 9 · 2025: 24 · 2024: 24 · 2023: 18 · 2022: 23 · 2021: 13 · 2020: 9 · 2019: 8
- FWCI
- 4.38
- Type
- journal article
- Language
- en
- Open access
- gold
- doi.org
- Locations
- Scientific Reports (publishedVersion, cc-by)
- Europe PMC (PubMed Central) (publishedVersion, other-oa)
- PubMed Central (publishedVersion, cc-by)
- PubMed (publishedVersion)
- Research at the University of Copenhagen (University of Copenhagen) (publishedVersion, cc-by)
- DOAJ (DOAJ: Directory of Open Access Journals) (submittedVersion)
- Funders
- National Science Foundation
- Villum Fonden (VKR023513)
- Danish Diabetes Academy
- National Research Foundation
- Schweizerischer Nationalfonds zur Förderung der Wissenschaftlichen Forschung (161005, 151825)
- Danmarks Grundforskningsfond (DNRF55)
- Danmarks Frie Forskningsfond
- TrygFonden
- National Heart, Lung, and Blood Institute (R01HL122887)
- Topics
- Life Sciences › Biochemistry, Genetics and Molecular Biology › Molecular Biology › Epigenetics and DNA Methylation
- Life Sciences › Biochemistry, Genetics and Molecular Biology › Genetics › Genetics and Physical Performance
- Life Sciences › Biochemistry, Genetics and Molecular Biology › Molecular Biology › Metabolism, Diabetes, and Cancer
- Keywords
- lifelong physical activity, DNA methylation, promoter hypomethylation, skeletal muscle aging, epigenetics, sedentary lifestyle, insulin sensitivity, glycogen metabolism, myogenesis, oxidative stress resistance, myosin light chain, dystrophin, actin polymerization, PAK, type 2 diabetes risk, muscle contractile properties
- MeSH terms
- Aging, Humans, Male, Middle Aged, Muscle Contraction, Muscle Proteins, Promoter Regions, Genetic, Exercise, Oxidative Stress, Muscle, Skeletal, DNA Methylation, Muscle Development
About these checks
Registry, retraction, Cites and statistics results are computed, not judged, with one exception: a printed reference that no index lists is read once by a model before it counts as a citation error. Claims are extracted by a model and kept only when their quote appears verbatim in the text; each cited source is then checked, with a model’s help, for whether it says what the claim relies on. Those verdicts can be wrong — read the claim’s quote and the cited source before relying on one.
Statistics and arithmetic are recomputed, not judged.
Confidence bands are shown only for fields calibrated on our annotated test set. None is calibrated yet, so no band is shown.
What counts as a claim ›How we measure confidence ›How we check this ›
Are you an author, or do you see a problem with this page? Request a review
