

The DOI matches its Crossref record; 2 of the 2 references it cites were found in a registry or an index.
Microarray assessment of N-glycan-specific IgE and IgG profiles associated with Schistosoma mansoni infection in rural and urban Uganda
Abstract
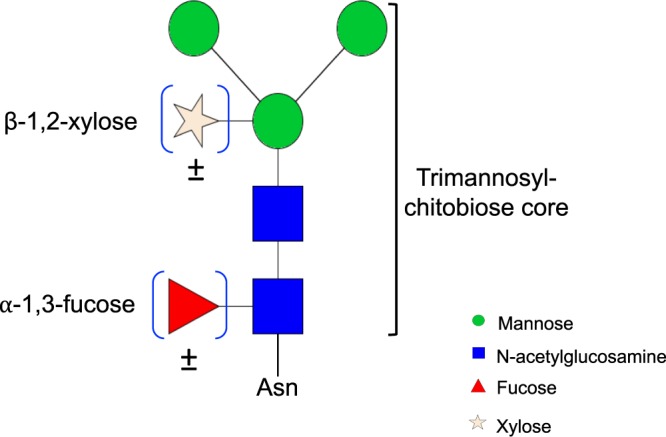
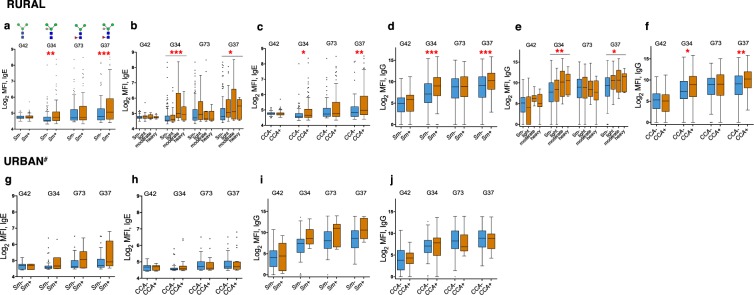
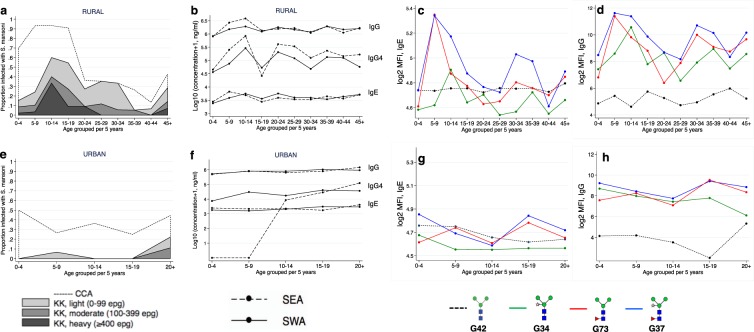
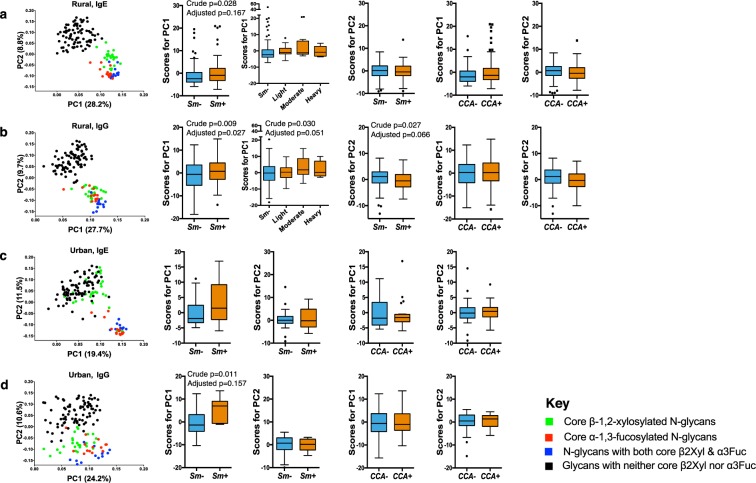
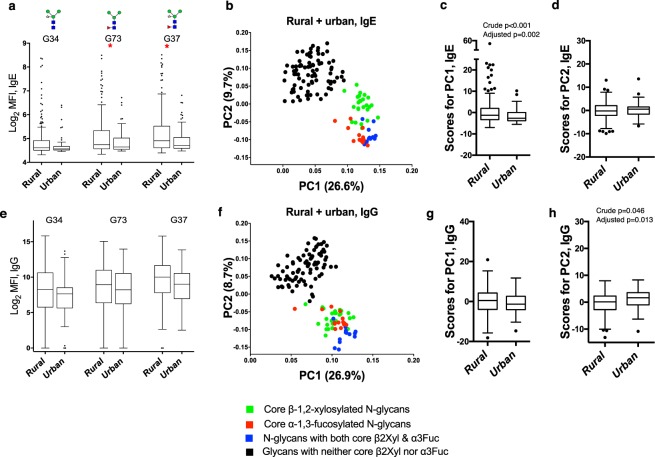
Core β-1,2-xylose and α-1,3-fucose are antigenic motifs on schistosome N-glycans, as well as prominent IgE targets on some plant and insect glycoproteins. To map the association of schistosome infection with responses to these motifs, we assessed plasma IgE and IgG reactivity using microarray technology among Ugandans from rural Schistosoma mansoni(Sm)-endemic islands (n = 209), and from proximate urban communities with lower Sm exposure (n = 62). IgE and IgG responses to core β-1,2-xylose and α-1,3-fucose modified N-glycans were higher in rural versus urban participants. Among rural participants, IgE and IgG to core β-1,2-xylose were positively associated with Sm infection and concentration peaks coincided with the infection intensity peak in early adolescence. Responses to core α-1,3-fucose were elevated regardless of Sm infection status and peaked before the infection peak. Among urban participants,Sm infection intensity was predominantly light and positively associated with responses to both motifs. Principal component and hierarchical cluster analysis reduced the data to a set of variables that captured core β-1,2-xylose- and α-1,3-fucose-specific responses, and confirmed associations with Sm and the rural environment. Responses to core β-1,2-xylose and α-1,3-fucose have distinctive relationships with Sm infection and intensity that should further be explored for associations with protective immunity, and cross-reactivity with other exposures.
Overview
The claims and statistics of this paper haven’t been checked yet.
Run the check — free, no account needed. It reads the open-access text and checks the sources it cites.
Integrity signals
Registry
Cites
Statistics
Figures
Verification
Claims the paper makes
The claims and statistics of this paper haven’t been checked yet.
Run the check — free, no account needed. It reads the open-access text and checks the sources it cites.
Claims other papers make about this one
Each is checked against this paper’s own text: does it say what the citing paper says it does?
In the citing paper
“Reactivity to classical CCD epitopes, including β-1,2-xylose and α-1,3-fucose, has been associated with sensitization to natural allergen extracts, rural environmental exposure, and S. mansoni infection, even in the absence of skin reactivity to allergen extracts or sensitization to major allergen molecules”
From Parasites and allergies: a complex bidirectional relationship from evolutionary origins to modern therapeutics (2026) · cites this paper as Nkurunungi et al. 2019
In the citing paper
“Studies have shown that patients infected with parasites may develop IgE responses to a wide range of N-glycans.”
From Parasites and allergies: a complex bidirectional relationship from evolutionary origins to modern therapeutics (2026) · cites this paper as Nkurunungi et al. 2019
Self-check
Percentages, sums and reported differences re-computed from the paper’s own numbers.
The self-check needs the paper’s full text.
Citations
Cites
The Role of Protein Glycosylation in Allergy
Altmann, F. (2007) · International Archives of Allergy and Immunology · doi:10.1159/000096114 · Cited by 393
Okano, M., Satoskar, A. R., Nishizaki, K., Abe, M., & Harn, D. A. (1999) · The Journal of Immunology · doi:10.4049/jimmunol.163.12.6712 · Cited by 206
Research works printed but not linked: 66
- Colley, D. G., Bustinduy, A. L., Secor, W. E. & King, C. H. Human schistosomiasis. The Lancet 383, 2253–2264, https://doi.org/10.1016/S0140-6736(13)61949-2 (2014). · DOI
- Toor, J. et al. Are We on Our Way to Achieving the 2020 Goals for Schistosomiasis Morbidity Control Using Current World Health Organization Guidelines? Clin Infect Dis 66, S245–S252, https://doi.org/10.1093/cid/ciy001 (2018). · DOI
- Secor, W. E. & Montgomery, S. P. Something old, something new: is praziquantel enough for schistosomiasis control? Future Med Chem 7, 681–684, https://doi.org/10.4155/fmc.15.9 (2015). · DOI
- King, C. H. The evolving schistosomiasis agenda 2007–2017-Why we are moving beyond morbidity control toward elimination of transmission. PLoS Negl Trop Dis 11, e0005517, https://doi.org/10.1371/journal.pntd.0005517 (2017). · DOI
- Sokolow, S. H. et al. Global Assessment of Schistosomiasis Control Over the Past Century Shows Targeting the Snail Intermediate Host Works Best. PLoS Negl Trop Dis 10, e0004794, https://doi.org/10.1371/journal.pntd.0004794 (2016). · DOI
- Tebeje, B. M., Harvie, M., You, H., Loukas, A. & McManus, D. P. Schistosomiasis vaccines: where do we stand? Parasites & Vectors 9, 528, https://doi.org/10.1186/s13071-016-1799-4 (2016). · DOI
- Omer-Ali, P., Magee, A. I., Kelly, C. & Simpson, A. J. A major role for carbohydrate epitopes preferentially recognized by chronically infected mice in the determination of Schistosoma mansoni schistosomulum surface antigenicity. Journal of immunology (Baltimore, Md.: 1950) 137, 3601–3607 (1986). · DOI
- Eberl, M. et al. Antibodies to glycans dominate the host response to schistosome larvae and eggs: is their role protective or subversive? J Infect Dis 183, 1238–1247, https://doi.org/10.1086/319691 (2001). · DOI
- Kariuki, T. M., Farah, I. O., Wilson, R. A. & Coulson, P. S. Antibodies elicited by the secretions from schistosome cercariae and eggs are predominantly against glycan epitopes. Parasite immunology 30, 554–562, https://doi.org/10.1111/j.1365-3024.2008.01054.x (2008). · DOI
- Everts, B. et al. Schistosome-derived omega-1 drives Th2 polarization by suppressing protein synthesis following internalization by the mannose receptor. The Journal of experimental medicine 209, 1753–1767, s1751, https://doi.org/10.1084/jem.20111381 (2012). · DOI · Paper page
- van de Vijver, K. K. et al. Glycans of Schistosoma mansoni and keyhole limpet haemocyanin induce hepatic granulomas in vivo. Int J Parasitol 34, 951–961, https://doi.org/10.1016/j.ijpara.2004.04.009 (2004). · DOI
- Elliott, A. M. et al. Ethical and scientific considerations on the establishment of a controlled human infection model for schistosomiasis in Uganda: report of a stakeholders’ meeting held in Entebbe, Uganda. [version 1; referees: 2 approved] AAS Open Research, https://doi.org/10.12688/aasopenres.12841.1 (2018). · DOI
- Utzinger, J., Becker, S. L., van Lieshout, L., van Dam, G. J. & Knopp, S. New diagnostic tools in schistosomiasis. Clinical Microbiology and Infection 21, 529–542, https://doi.org/10.1016/j.cmi.2015.03.014 (2015). · DOI
- van Diepen, A. et al. Development of a Schistosoma mansoni shotgun O-glycan microarray and application to the discovery of new antigenic schistosome glycan motifs. Int J Parasitol 45, 465–475, https://doi.org/10.1016/j.ijpara.2015.02.008 (2015). · DOI
- Nyame, A. K., Kawar, Z. S. & Cummings, R. D. Antigenic glycans in parasitic infections: implications for vaccines and diagnostics. Archives of biochemistry and biophysics 426, 182–200, https://doi.org/10.1016/j.abb.2004.04.004 (2004). · DOI
- Hokke, C. H. & van Diepen, A. Helminth glycomics – glycan repertoires and host-parasite interactions. Molecular and Biochemical Parasitology 215, 47–57, https://doi.org/10.1016/j.molbiopara.2016.12.001 (2017). · DOI
- Smit, C. H. et al. Glycomic Analysis of Life Stages of the Human Parasite Schistosoma mansoni Reveals Developmental Expression Profiles of Functional and Antigenic Glycan Motifs. Molecular & cellular proteomics: MCP 14, 1750–1769, https://doi.org/10.1074/mcp.M115.048280 (2015). · DOI
- Haslam, S. M., Morris, H. R. & Dell, A. Mass spectrometric strategies: providing structural clues for helminth glycoproteins. Trends in parasitology 17, 231–235 (2001). · DOI
- Commins, S. P. Carbohydrates as allergens. Current allergy and asthma reports 15, 492, https://doi.org/10.1007/s11882-014-0492-y (2015). · DOI
- Khoo, K.-H., Chatterjee, D., Caulfield, J. P., Morris, H. R. & Dell, A. Structural mapping of the glycans from the egg glycoproteins of Schistosoma mansoni and Schistosoma japonicum: identification of novel core structures and terminal sequences. Glycobiology 7, 663–677, https://doi.org/10.1093/glycob/7.5.663 (1997). · DOI
- van Die, I. et al. Core alpha1– > 3-fucose is a common modification of N-glycans in parasitic helminths and constitutes an important epitope for IgE from Haemonchus contortus infected sheep. FEBS letters 463, 189–193 (1999). · DOI
- Yan, S. et al. Core Richness of N-Glycans of Caenorhabditis elegans: A Case Study on Chemical and Enzymatic Release. Analytical chemistry 90, 928–935, https://doi.org/10.1021/acs.analchem.7b03898 (2018). · DOI
- Haslam, S. M., Coles, G. C., Reason, A. J., Morris, H. R. & Dell, A. The novel core fucosylation of Haemonchus contortus N-glycans is stage specific. Molecular and Biochemical Parasitology 93, 143–147, https://doi.org/10.1016/S0166-6851(98)00020-6 (1998). · DOI
- Haslam, S. M. et al. Haemonchus contortus glycoproteins contain N-linked oligosaccharides with novel highly fucosylated core structures. The Journal of biological chemistry 271, 30561–30570 (1996). · DOI
- Aalberse, R. C., Koshte, V. & Clemens, J. G. J. Immunoglobulin E antibodies that crossreact with vegetable foods, pollen, and Hymenoptera venom. Journal of Allergy and Clinical Immunology 68, 356–364, https://doi.org/10.1016/0091-6749(81)90133-0 (1981). · DOI
- Fabini, G., Freilinger, A., Altmann, F. & Wilson, I. B. H. Identification of Core α1,3-Fucosylated Glycans and Cloning of the Requisite Fucosyltransferase cDNA from Drosophila melanogaster: Potential Basis of the Neural Anti-Horseradish Peroxidase Epitope. Journal of Biological Chemistry 276, 28058–28067, https://doi.org/10.1074/jbc.M100573200 (2001). · DOI
- Fötisch, K., Altmann, F., Haustein, D. & Vieths, S. Involvement of Carbohydrate Epitopes in the IgE Response of Celery–Allergic Patients. International Archives of Allergy and Immunology 120, 30–42 (1999). · DOI
- Fournet, B. et al. Primary structure of an N-glycosidic carbohydrate unit derived from Sophora japonica lectin. European journal of biochemistry 166, 321–324 (1987). · DOI
- Ramirez-Soto, D. & Poretz, R. D. The (1—3)-linked alpha-L-fucosyl group of the N-glycans of the Wistaria floribunda lectins is recognized by a rabbit anti-serum. Carbohydrate research 213, 27–36 (1991). · DOI
- Smit, C. H. et al. Surface expression patterns of defined glycan antigens change during Schistosoma mansoni cercarial transformation and development of schistosomula. Glycobiology 25, 1465–1479, https://doi.org/10.1093/glycob/cwv066 (2015). · DOI
- Wuhrer, M., Koeleman, C. A., Deelder, A. M. & Hokke, C. H. Repeats of LacdiNAc and fucosylated LacdiNAc on N-glycans of the human parasite Schistosoma mansoni. The FEBS journal 273, 347–361, https://doi.org/10.1111/j.1742-4658.2005.05068.x (2006). · DOI
- Faveeuw, C. et al. Schistosome N-glycans containing core alpha 3-fucose and core beta 2-xylose epitopes are strong inducers of Th2 responses in mice. European journal of immunology 33, 1271–1281, https://doi.org/10.1002/eji.200323717 (2003). · DOI · Paper page
- Wilson, I. B. & Altmann, F. Structural analysis of N-glycans from allergenic grass, ragweed and tree pollens: corealpha1,3-linked fucose and xylose present in all pollens examined. Glycoconj J 15, 1055–1070 (1998). · DOI
- Wilson, I. B. H., Harthill, J. E., Mullin, N. P., Ashford, D. A. & Altmann, F. Core α1,3-fucose is a key part of the epitope recognized by antibodies reacting against plant N-linked oligosaccharides and is present in a wide variety of plant extracts. Glycobiology 8, 651–661, https://doi.org/10.1093/glycob/8.7.651 (1998). · DOI
- Meevissen, M. H. et al. Structural characterization of glycans on omega-1, a major Schistosoma mansoni egg glycoprotein that drives Th2 responses. Journal of proteome research 9, 2630–2642, https://doi.org/10.1021/pr100081c (2010). · DOI
- Zaccone, P. et al. The S. mansoni glycoprotein omega-1 induces Foxp3 expression in NOD mouse CD4(+) T cells. Eur. J. Immunol. 41, 2709–2718, https://doi.org/10.1002/eji.201141429 (2011). · DOI
- Everts, B. et al. Omega-1, a glycoprotein secreted by Schistosoma mansoni eggs, drives Th2 responses. The Journal of experimental medicine 206, 1673–1680, https://doi.org/10.1084/jem.20082460 (2009). · DOI
- Schramm, G. et al. Molecular characterisation of kappa-5, a major antigenic glycoprotein from Schistosoma mansoni eggs. Mol Biochem Parasitol 166, 4–14, https://doi.org/10.1016/j.molbiopara.2009.02.003 (2009). · DOI
- Meevissen, M. H. et al. Targeted glycoproteomic analysis reveals that kappa-5 is a major, uniquely glycosylated component of Schistosoma mansoni egg antigens. Molecular & cellular proteomics: MCP 10, M110 005710, https://doi.org/10.1074/mcp.M110.005710 (2011). · DOI
- Dunne, D. W., Butterworth, A. E., Fulford, A. J., Ouma, J. H. & Sturrock, R. F. Human IgE responses to Schistosoma mansoni and resistance to reinfection. Memorias do Instituto Oswaldo Cruz 87(Suppl 4), 99–103 (1992). · DOI
- Demeure, C. E. et al. Resistance to Schistosoma mansoni in Humans: Influence of the IgE/IgG4 Balance and IgG2 in Immunity to Reinfection after Chemotherapy. The Journal of Infectious Diseases 168, 1000–1008 (1993). · DOI
- Amoah, A. S. et al. Identification of dominant anti-glycan IgE responses in school children by glycan microarray. The Journal of allergy and clinical immunology 141, 1130–1133, https://doi.org/10.1016/j.jaci.2017.09.040 (2018). · DOI
- Yang, Y. Y., van Diepen, A., Brzezicka, K., Reichardt, N. C. & Hokke, C. H. Glycan microarray-assisted identification of IgG subclass targets in schistosomiasis. Frontiers in Immunology, https://doi.org/10.3389/fimmu.2018.02331 (2018). · DOI
- Brzezicka, K. et al. Synthesis and microarray-assisted binding studies of core xylose and fucose containing N-glycans. ACS Chem Biol 10, 1290–1302, https://doi.org/10.1021/cb501023u (2015). · DOI
- van Diepen, A. et al. Differential anti-glycan antibody responses in Schistosoma mansoni-infected children and adults studied by shotgun glycan microarray. PLoS Negl Trop Dis 6, e1922, https://doi.org/10.1371/journal.pntd.0001922 (2012). · DOI
- Nampijja, M. et al. The Lake Victoria island intervention study on worms and allergy-related diseases (LaVIISWA): study protocol for a randomised controlled trial. Trials 16, 187, https://doi.org/10.1186/s13063-015-0702-5 (2015). · DOI
- Nkurunungi, G. et al. Schistosoma mansoni-specific immune responses and allergy in Uganda. Parasite immunology 40, https://doi.org/10.1111/pim.12506 (2018). · DOI
- Sanya, R. E. et al. The Impact of Intensive Versus Standard Anthelminthic Treatment on Allergy-related Outcomes, Helminth Infection Intensity, and Helminth-related Morbidity in Lake Victoria Fishing Communities, Uganda: Results From the LaVIISWA Cluster-randomized Trial. Clinical Infectious Diseases, ciy761–ciy761, https://doi.org/10.1093/cid/ciy761 (2018). · DOI
- Webb, E. L. et al. Helminths are positively associated with atopy and wheeze in Ugandan fishing communities: results from a cross-sectional survey. Allergy 71, 1156–1169, https://doi.org/10.1111/all.12867 (2016). · DOI
- Katz, N., Chaves, A. & Pellegrino, J. A simple device for quantitative stool thick-smear technique in Schistosomiasis mansoni. Rev Inst Med Trop Sao Paulo 14, 397–400 (1972).
- Verweij, J. J. et al. Simultaneous detection and quantification of Ancylostoma duodenale, Necator americanus, and Oesophagostomum bifurcum in fecal samples using multiplex real-time PCR. The American journal of tropical medicine and hygiene 77, 685–690 (2007). · DOI
- Verweij, J. J. et al. Molecular diagnosis of Strongyloides stercoralis in faecal samples using real-time PCR. Trans R Soc Trop Med Hyg 103, 342–346, https://doi.org/10.1016/j.trstmh.2008.12.001 (2009). · DOI
- Emmanuel, I. O. A. & Ekkehard, D. Epidemiology, of bilharzias (schistosomiasis) in Uganda from 1902 until 2005. African Health Sciences 8, 239–243 (2008).
- Echeverria, B. et al. Chemoenzymatic Synthesis of N-glycan Positional Isomers and Evidence for Branch Selective Binding by Monoclonal Antibodies and Human C-type Lectin Receptors. ACS Chemical Biology 13, 2269–2279, https://doi.org/10.1021/acschembio.8b00431 (2018). · DOI
- Yang, Y. Y. et al. Specific anti-glycan antibodies are sustained during and after parasite clearance in Schistosoma japonicum-infected rhesus macaques. PLoS Negl Trop Dis 11, e0005339, https://doi.org/10.1371/journal.pntd.0005339 (2017). · DOI
- Oyelaran, O., McShane, L. M., Dodd, L. & Gildersleeve, J. C. Profiling human serum antibodies with a carbohydrate antigen microarray. Journal of proteome research 8, 4301–4310, https://doi.org/10.1021/pr900515y (2009). · DOI
- Goeman, J. J., van de Geer, S. A., de Kort, F. & van Houwelingen, H. C. A global test for groups of genes: testing association with a clinical outcome. Bioinformatics 20, 93–99 (2004). · DOI
- Goeman, J. J., Van De Geer, S. A. & Van Houwelingen, H. C. Testing against a high dimensional alternative. Journal of the Royal Statistical Society: Series B 68, 477–493 (2006). · DOI
- Cheever, A. W., Macedonia, J. G., Deb, S., Cheever, E. A. & Mosimann, J. E. Persistence of eggs and hepatic fibrosis after treatment of Schistosoma mansoni-infected mice. The American journal of tropical medicine and hygiene 46, 752–758 (1992). · DOI
- Bardor, M. et al. Immunoreactivity in mammals of two typical plant glyco-epitopes, core alpha(1,3)-fucose and core xylose. Glycobiology 13, 427–434, https://doi.org/10.1093/glycob/cwg024 (2003). · DOI
- Luyai, A. E. et al. Differential expression of anti-glycan antibodies in schistosome-infected humans, rhesus monkeys and mice. Glycobiology 24, 602–618, https://doi.org/10.1093/glycob/cwu029 (2014). · DOI
- van Diepen, A. et al. Parasite glycans and antibody-mediated immune responses in Schistosoma infection. Parasitology 139, 1219–1230, https://doi.org/10.1017/s0031182012000273 (2012). · DOI
- Diemert, D. J. et al. Generalized urticaria induced by the Na-ASP-2 hookworm vaccine: implications for the development of vaccines against helminths. The Journal of allergy and clinical immunology 130, 169–176.e166, https://doi.org/10.1016/j.jaci.2012.04.027 (2012). · DOI
- Mari, A. et al. Evaluation by double-blind placebo-controlled oral challenge of the clinical relevance of IgE antibodies against plant glycans. Allergy 63, 891–896, https://doi.org/10.1111/j.1398-9995.2008.01703.x (2008). · DOI
- Hemmer, W. In Anticarbohydrate Antibodies: From Molecular Basis to Clinical Application (eds Paul, K. & Sven, M.-L.) 181–202 (Springer Vienna, 2012). · DOI
- Commins, S. P. et al. Delayed anaphylaxis, angioedema, or urticaria after consumption of red meat in patients with IgE antibodies specific for galactose-α-1,3-galactose. Journal of Allergy and Clinical Immunology 123, 426–433.e422, https://doi.org/10.1016/j.jaci.2008.10.052 (2009). · DOI
Cited by
Sorted by citations
Packi, K., Świerczewski, D., Klimczak, S., Ochab, D., Gałęziewska, J., Gromek, P., Kruczkowska, W., Płuciennik, E., Kałuzińska-Kołat, Ż., & Kołat, D. (2026) · Antonie van Leeuwenhoek · doi:10.1007/s10482-026-02425-4
Metadata
- Authors
- Nkurunungi, G., van Diepen, A., Nassuuna, J., Sanya, R. E., Nampijja, M., Nambuya, I., Kabagenyi, J., Serna, S., Reichardt, N.-C., van Ree, R., Webb, E. L., Elliott, A. M., Yazdanbakhsh, M., & Hokke, C. H.
- Venue
- Scientific Reports
- Published
- 2019-03-05
- Volume
- 9
- Issue
- 1
- ISSN
- 2045-2322
- PMC
- PMC6401159
- Cited by
- 19
- References
- 2
- Language
- en
About these checks
Registry, retraction, Cites and statistics results are computed, not judged, with one exception: a printed reference that no index lists is read once by a model before it counts as a citation error. Claims are extracted by a model and kept only when their quote appears verbatim in the text; each cited source is then checked, with a model’s help, for whether it says what the claim relies on. Those verdicts can be wrong — read the claim’s quote and the cited source before relying on one.
Statistics and arithmetic are recomputed, not judged.
Confidence bands are shown only for fields calibrated on our annotated test set. None is calibrated yet, so no band is shown.
What counts as a claim ›How we measure confidence ›How we check this ›
Are you an author, or do you see a problem with this page? Request a review
