

The DOI matches its Crossref record.
Old World Monkeys are less than ideal transplantation models for testing pig organs lacking three carbohydrate antigens (Triple-Knockout)
Abstract
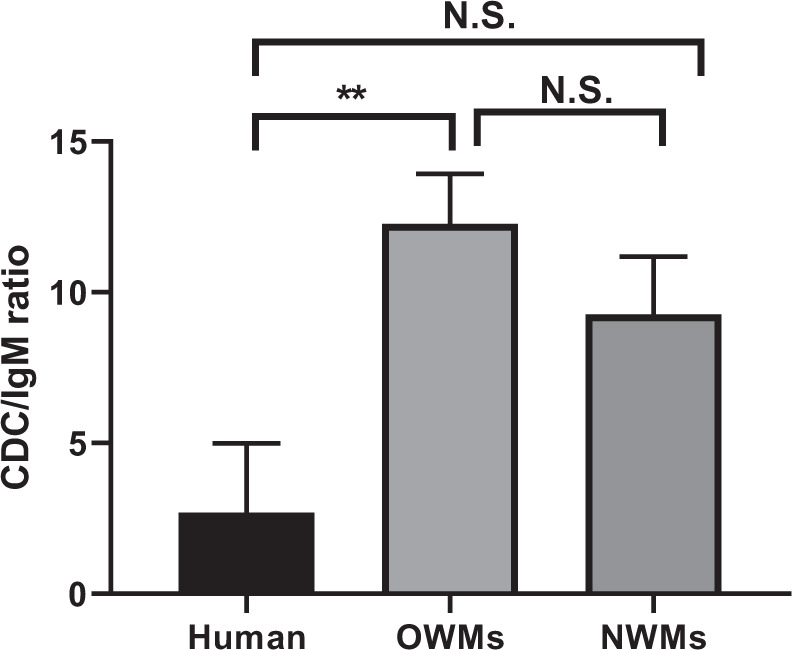
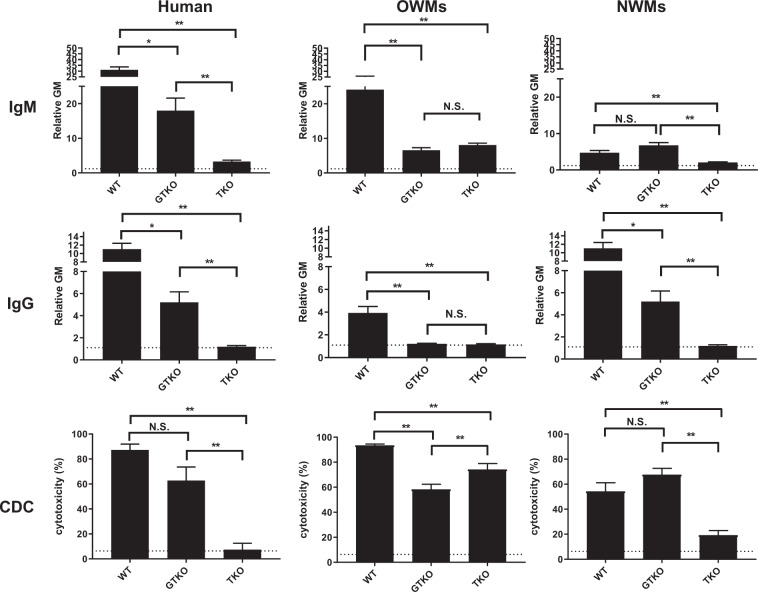
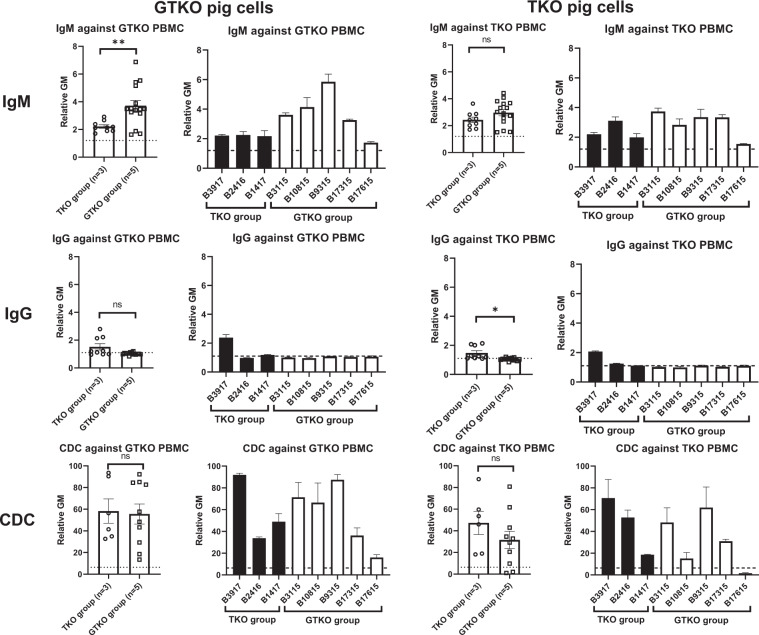
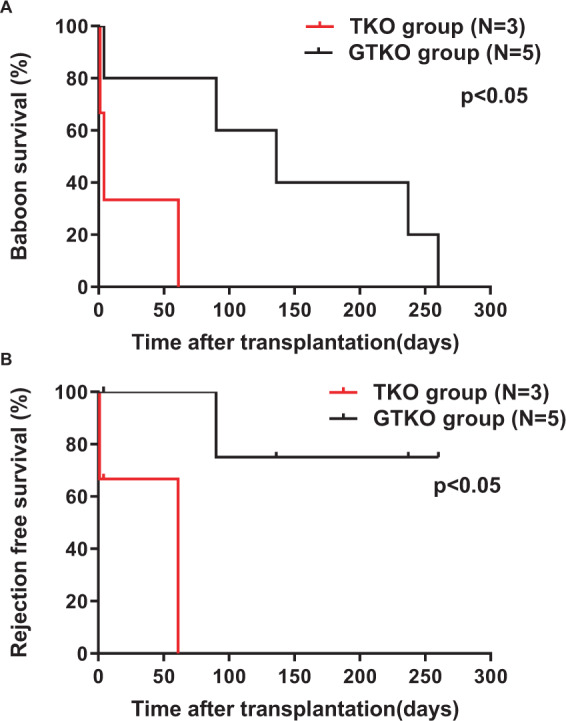
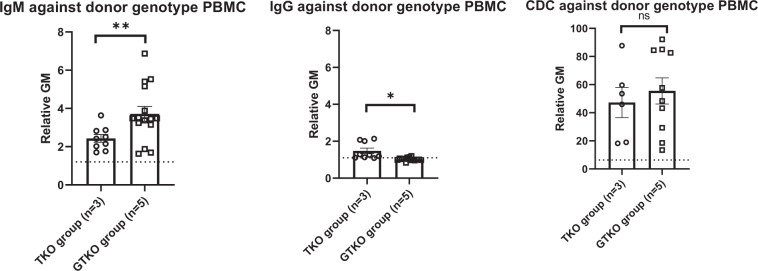
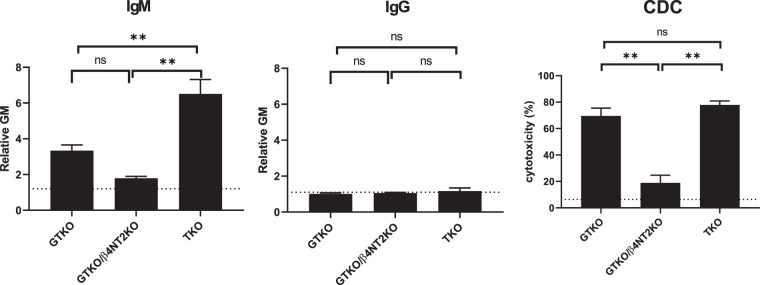
Triple-knockout (TKO) pigs (with added protective human transgenes) are likely to be optimal sources of organs for clinical organ xenotransplantation because many humans have minimal or no natural antibody to TKO pig cells. However, Old World monkeys (OWMs) have naturally-existing antibodies directed to TKO cells. We measured anti-pig IgM/IgG binding, and complement-dependent cytotoxicity to wild-type (WT), α1,3-galactosyltransferase gene-knockout (GTKO), and TKO pig peripheral blood mononuclear cells (PBMCs) using sera from humans, several OWMs, and two New World monkeys (NWMs). Furthermore, we compared survival of GTKO (n = 5) and TKO (n = 3) pig kidneys in baboons. OWMs had significantly greater IgM binding and cytotoxicity to TKO PBMCs than humans or NWMs. Mean anti-TKO IgM was significantly higher in OWMs and significantly lower in NWMs than in humans. Cytotoxicity of OWM sera to TKO PBMCs was significantly greater than of human serum, but there was no significant difference between human and NWM sera. The median survival of TKO pig kidneys (4 days) in baboons was significantly shorter than that of GTKO kidneys (136 days) (p < 0.05). Even though considered ideal for clinical xenotransplantation, the presence of naturally-existing antibodies to TKO pig cells in OWMs complicates the transplantation of TKO pig kidneys in OWMs.
Overview
The claims and statistics of this paper haven’t been checked yet.
Run the check — free, no account needed. It reads the open-access text and checks the sources it cites.
Integrity signals
Registry
Cites
Statistics
Figures
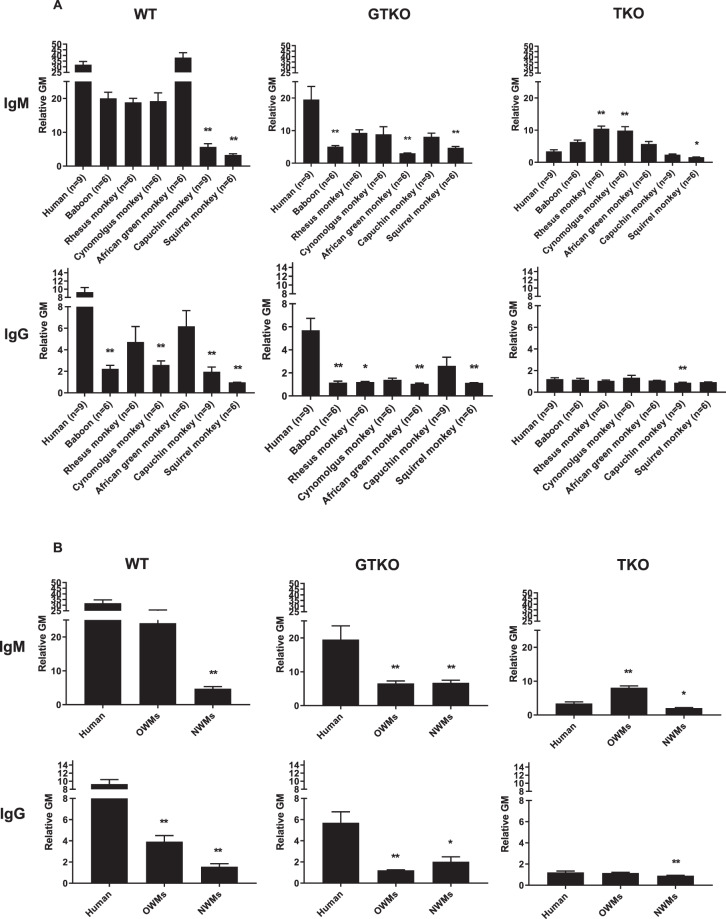
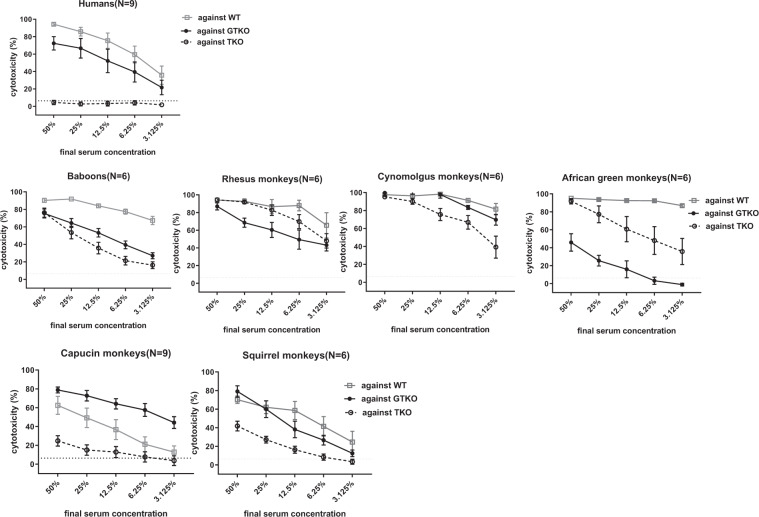
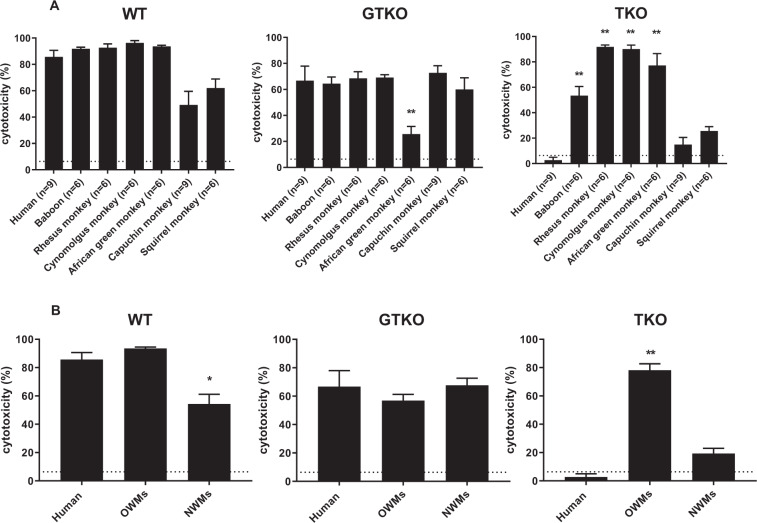
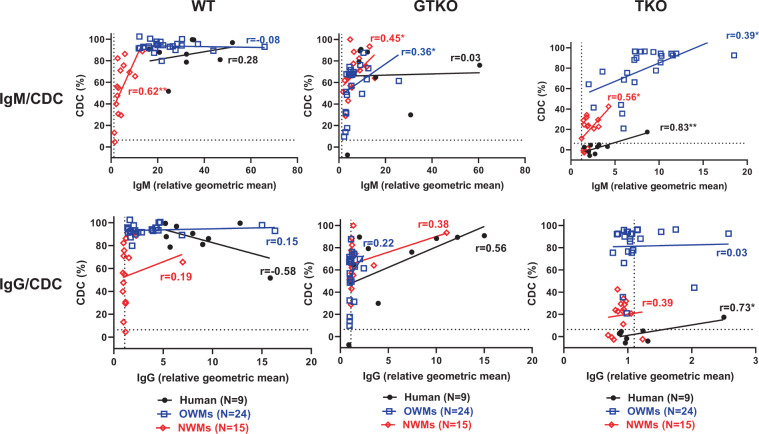
Verification
Claims the paper makes
The claims and statistics of this paper haven’t been checked yet.
Run the check — free, no account needed. It reads the open-access text and checks the sources it cites.
Claims other papers make about this one
Each is checked against this paper’s own text: does it say what the citing paper says it does?
The source backs part of the claim, not all of it — or backs it for a different population, condition or comparison.
In the citing paper
“Although renal grafts derived from the porcine donors lacking these three glycans and carrying various human transgenes have been tested in OWMs, graft survival was short8 or not all human transgenes were expressed10.”
From Design and testing of a humanized porcine donor for xenotransplantation (2023) · cites this paper as [8]
Experimental — accuracy not yet measuredThe source backs part of the claim, not all of it — or backs it for a different population, condition or comparison.
In the citing paper
“Although a porcine donor carrying a CMAH knockout is thought not to survive in OWMs considering complication from a CMAH knockout8,9, renal grafts derived from the 3KO.7TG ± RI porcine donor supported life long-term in cynomolgus monkeys, up to 758 days.”
From Design and testing of a humanized porcine donor for xenotransplantation (2023) · cites this paper as [8]
Experimental — accuracy not yet measuredThe cited source says what the claim attributes to it.
In the citing paper
“This is consistent with other reports that 3KO porcine cells possess additional xenoantigens recognized by OWM serum8,9.”
From Design and testing of a humanized porcine donor for xenotransplantation (2023) · cites this paper as [8]
The cited source says what the claim attributes to it.
In the citing paper
“However, in vitro analysis suggests that a human-compatible porcine donor should ideally have all three glycans eliminated to match with the absence of the three glycans in humans8,9.”
From Design and testing of a humanized porcine donor for xenotransplantation (2023) · cites this paper as [8]
The cited source says what the claim attributes to it.
In the citing paper
“In addition, data suggest that CMAH inactivation may produce a novel antigen xenogenic to the OWMs, which may be a target of preformed antibody binding, leading to complement activation in OWM serum8,9.”
From Design and testing of a humanized porcine donor for xenotransplantation (2023) · cites this paper as [8]
Self-check
Percentages, sums and reported differences re-computed from the paper’s own numbers.
The self-check needs the paper’s full text.
Citations
Cites
No references could be resolved yet.
Research works printed but not linked: 20
- Yamamoto, T. et al. Life-supporting Kidney Xenotransplantation From Genetically Engineered Pigs in Baboons: A Comparison of Two Immunosuppressive Regimens. Transplantation 103, 2090–2104, https://doi.org/10.1097/tp.0000000000002796 (2019). · DOI
- Iwase, H. et al. Pig kidney graft survival in a baboon for 136 days: longest life-supporting organ graft survival to date. Xenotransplantation 22, 302–309, https://doi.org/10.1111/xen.12174 (2015). · DOI
- Iwase, H. et al. Immunological and physiological observations in baboons with life-supporting genetically engineered pig kidney grafts. Xenotransplantation 24, https://doi.org/10.1111/xen.12293 (2017). · DOI · Paper page
- Adams, A. B. et al. Xenoantigen deletion and chemical immunosuppression can prolong renal xenograft survival. Ann Surg. 268, 564–573, https://doi.org/10.1097/sla.0000000000002977 (2018). · DOI
- Higginbotham, L. et al. Pre-transplant antibody screening and anti-CD154 costimulation blockade promote long-term xenograft survival in a pig-to-primate kidney transplant model. Xenotransplantation 22, 221–230, https://doi.org/10.1111/xen.12166 (2015). · DOI
- Mohiuddin, M. M. et al. Chimeric 2C10R4 anti-CD40 antibody therapy is critical for long-term survival of GTKO.hCD46.hTBM pig-to-primate cardiac xenograft. Nat Commun. 7, 11138, https://doi.org/10.1038/ncomms11138 (2016). · DOI
- Langin, M. et al. Consistent success in life-supporting porcine cardiac xenotransplantation. Nature 564, 430–433, https://doi.org/10.1038/s41586-018-0765-z (2018). · DOI
- Estrada, J. L. et al. Evaluation of human and non-human primate antibody binding to pig cells lacking GGTA1/CMAH/beta4GalNT2 genes. Xenotransplantation 22, 194–202, https://doi.org/10.1111/xen.12161 (2015). · DOI · Paper page
- Cooper, D. K. C. et al. Justification of specific genetic modifications in pigs for clinical organ xenotransplantation. Xenotransplantation, e12516, https://doi.org/10.1111/xen.12516 (2019). · DOI
- Li, Q. et al. Carbohydrate antigen expression and anti-pig antibodies in New World capuchin monkeys: Relevance to studies of xenotransplantation. Xenotransplantation, e12498, https://doi.org/10.1111/xen.12498 (2019). · DOI
- Hara, H. et al. Allosensitized humans are at no greater risk of humoral rejection of GT-KO pig organs than other humans. Xenotransplantation 13, 357–365, https://doi.org/10.1111/j.1399-3089.2006.00319.x (2006). · DOI
- Gao, B. et al. Anti-Neu5Gc and anti-non-Neu5Gc antibodies in healthy humans. PloS one 12, e0180768, https://doi.org/10.1371/journal.pone.0180768 (2017). · DOI · Paper page
- Mueller, N. J. et al. Reduction of consumptive coagulopathy using porcine cytomegalovirus-free cardiac porcine grafts in pig-to-primate xenotransplantation. Transplantation 78, 1449–1453 (2004). · DOI
- Zhou, H. et al. Are there advantages in the use of specific pathogen-free baboons in pig organ xenotransplantation models? Xenotransplantation 21, 287–290, https://doi.org/10.1111/xen.12088 (2014). · DOI
- Lin, C. C. et al. Recipient tissue factor expression is associated with consumptive coagulopathy in pig-to-primate kidney xenotransplantation. Am J Transplant 10, 1556–1568, https://doi.org/10.1111/j.1600-6143.2010.03147.x (2010). · DOI
- Campanile, N. et al. Acute gastric dilatation after porcine islet transplantation in a cynomolgus monkey - case history and review of the literature. Xenotransplantation 14, 265–270, https://doi.org/10.1111/j.1399-3089.2007.00406.x (2007). · DOI
- Cooper, D. K., Ekser, B., Ramsoondar, J., Phelps, C. & Ayares, D. The role of genetically engineered pigs in xenotransplantation research. J Pathol. 238, 288–299, https://doi.org/10.1002/path.4635 (2016). · DOI
- Cooper, D. K. C., Ezzelarab, M., Iwase, H. & Hara, H. Perspectives on the optimal genetically engineered pig in 2018 for initial clinical trials of kidney or heart xenotransplantation. Transplantation 102, 1974–1982, https://doi.org/10.1097/tp.0000000000002443 (2018). · DOI
- Li, Q. et al. Is sensitization to pig antigens detrimental to subsequent allotransplantation? Xenotransplantation 25, e12393, https://doi.org/10.1111/xen.12393 (2018). · DOI
- Iwase, H., Klein, E. C. & Cooper, D. K. Physiologic aspects of pig kidney transplantation in nonhuman primates. Comp Med. 68, 332–340, https://doi.org/10.30802/aalas-cm-17-000117 (2018). · DOI
Cited by
Sorted by citations
Design and testing of a humanized porcine donor for xenotransplantation
Anand, R. P., Layer, J. V., Heja, D., Hirose, T., Lassiter, G., Firl, D. J., Paragas, V. B., Akkad, A., Chhangawala, S., Colvin, R. B., et al. (2023) · Nature · doi:10.1038/s41586-023-06594-4 · Cited by 302
Models of immunogenicity in preclinical assessment of tissue engineered heart valves
Ground, M., Waqanivavalagi, S., Walker, R., Milsom, P., & Cornish, J. (2021) · Acta Biomaterialia · doi:10.1016/j.actbio.2021.05.049 · Cited by 31
Metadata
- Authors
- Yamamoto, T., Iwase, H., Patel, D., Jagdale, A., Ayares, D., Anderson, D., Eckhoff, D. E., Cooper, D. K. C., & Hara, H.
- Venue
- Scientific Reports
- Published
- 2020-06-17
- Volume
- 10
- Issue
- 1
- ISSN
- 2045-2322
- PMC
- PMC7300119
- Cited by
- 110
- References
- 0
- Language
- en
About these checks
Registry, retraction, Cites and statistics results are computed, not judged, with one exception: a printed reference that no index lists is read once by a model before it counts as a citation error. Claims are extracted by a model and kept only when their quote appears verbatim in the text; each cited source is then checked, with a model’s help, for whether it says what the claim relies on. Those verdicts can be wrong — read the claim’s quote and the cited source before relying on one.
Statistics and arithmetic are recomputed, not judged.
Confidence bands are shown only for fields calibrated on our annotated test set. None is calibrated yet, so no band is shown.
What counts as a claim ›How we measure confidence ›How we check this ›
Are you an author, or do you see a problem with this page? Request a review
