Student or educator? Sign up with your school email and get 6 months of Pro free.
CoChat

The DOI matches its Crossref record; the references it cites are not checked yet.

Multi-omics analysis to decipher the molecular link between chronic exposure to pollution and human skin dysfunction

Open access

Abstract

Environmental pollution is composed of several factors, namely particulate matter (PM 2.5, PM 10), ozone and Ultra Violet (UV) rays among others and first and the most exposed tissue to these substances is the skin epidermis. It has been established that several skin disorders such as eczema, acne, lentigines and wrinkles are aggravated by exposure to atmospheric pollution. While pollutants can interact with skin surface, contamination of deep skin by ultrafine particles or Polycyclic aromatic hydrocarbons (PAH) might be explained by their presence in blood and hair cortex. Molecular mechanisms leading to skin dysfunction due to pollution exposure have been poorly explored in humans. In addition to various host skin components, cutaneous microbiome is another target of these environment aggressors and can actively contribute to visible clinical manifestation such as wrinkles and aging. The present study aimed to investigate the association between pollution exposure, skin microbiota, metabolites and skin clinical signs in women from two cities with different pollution levels. Untargeted metabolomics and targeted proteins were analyzed from D-Squame samples from healthy women (n = 67 per city), aged 25–45 years and living for at least 15 years in the Chinese cities of Baoding (used as a model of polluted area) and Dalian (control area with lower level of pollution). Additional samples by swabs were collected from the cheeks from the same population and microbiome was analysed using bacterial 16S rRNA as well as fungal ITS1 amplicon sequencing and metagenomics analysis. The level of exposure to pollution was assessed individually by the analysis of polycyclic aromatic hydrocarbons (PAH) and their metabolites in hair samples collected from each participant. All the participants of the study were assessed for the skin clinical parameters (acne, wrinkles, pigmented spots etc.). Women from the two cities (polluted and less polluted) showed distinct metabolic profiles and alterations in skin microbiome. Profiling data from 350 identified metabolites, 143 microbes and 39 PAH served to characterize biochemical events that correlate with pollution exposure. Finally, using multiblock data analysis methods, we obtained a potential molecular map consisting of multi-omics signatures that correlated with the presence of skin pigmentation dysfunction in individuals living in a polluted environment. Overall, these signatures point towards macromolecular alterations by pollution that could manifest as clinical sign of early skin pigmentation and/or other imperfections.

Overview

The claims and statistics of this paper haven’t been checked yet.

Free: it reads the open-access text and checks the first 5 claims that cite a source we can check. Create a free account to check every claim.

A few free checks a day · papers already verified open instantly · results are public

Integrity signals

Registry

Crossref · 10.1038/s41598-021-97572-1

Cites

Statistics

Figures

Figure 1 Metabolite pathways that are differentially modulated in skin samples of individuals from polluted city of Baoding. (A) Heatmap of log2 of Fold Change between Baoding (More Polluted) and Dalian (Less Polluted), positive values indicate a higher amount in Baoding and negative values a higher amount in Dalian. (B) Focus on N-acetyle amino acids with boxplots of log normalized values, colored by site. (C) Focus on gamma-glutamyl amino acids with boxplots of log normalized values, colored by site. A red star indicates, for a given metabolite, that the difference in mean between the 2 cities is significant (q-value < 0.05, t-test with correction for multiple testing using Benjamini–Hochberg method). Figures were created using the R software: R Core Team (2017), R Foundation for Statistical Computing, Vienna, Austria. URL https://www.R-project.org/.
Figure 1 Metabolite pathways that are differentially modulated in skin samples of individuals from polluted city of Baoding. (A) Heatmap of log2 of Fold Change between Baoding (More Polluted) and Dalian (Less Polluted), positive values indicate a higher amount in Baoding and negative values a higher amount in Dalian. (B) Focus on N-acetyle amino acids with boxplots of log normalized values, colored by site. (C) Focus on gamma-glutamyl amino acids with boxplots of log normalized values, colored by site. A red star indicates, for a given metabolite, that the difference in mean between the 2 cities is significant (q-value < 0.05, t-test with correction for multiple testing using Benjamini–Hochberg method). Figures were created using the R software: R Core Team (2017), R Foundation for Statistical Computing, Vienna, Austria. URL https://www.R-project.org/.CC BY · PubMed Central
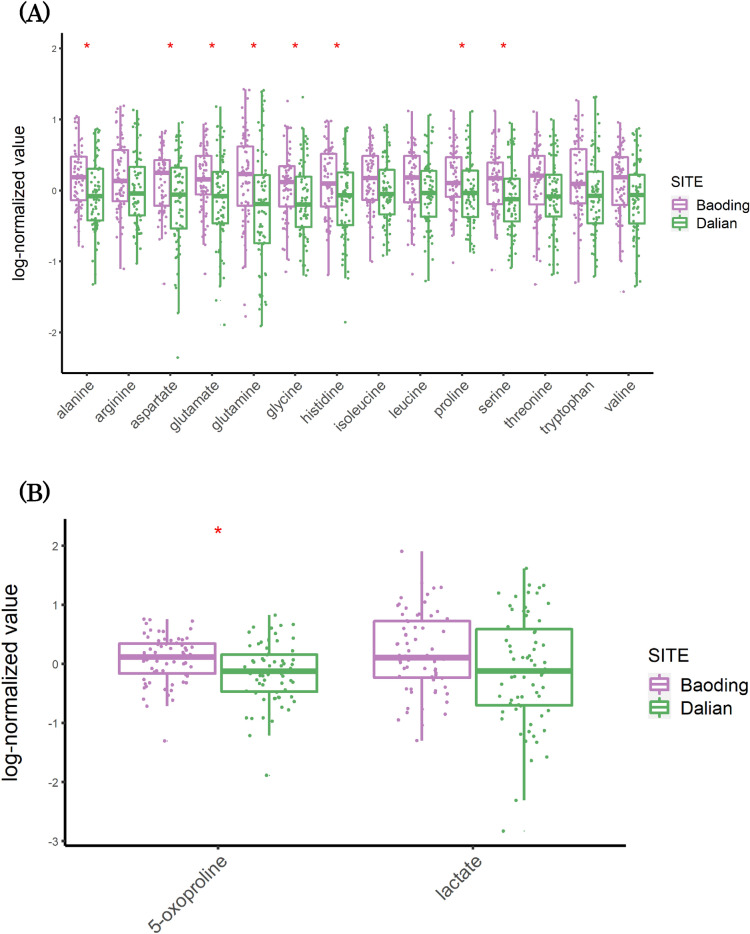
Figure 2 (A) Boxplots of log-transformed values of free amino acids (B) Boxplots of log-transformed values of NMF. A red star indicates, for a given metabolite, that the difference in mean between the 2 cities, Baoding (More Polluted) and Dalian (Less Polluted), is significant (q-value < 0.05, t-test with correction for multiple testing using Benjamini–Hochberg method). Figures were created using the R software: R Core Team (2017), R Foundation for Statistical Computing, Vienna, Austria. URL https://www.R-project.org/.
Figure 2 (A) Boxplots of log-transformed values of free amino acids (B) Boxplots of log-transformed values of NMF. A red star indicates, for a given metabolite, that the difference in mean between the 2 cities, Baoding (More Polluted) and Dalian (Less Polluted), is significant (q-value < 0.05, t-test with correction for multiple testing using Benjamini–Hochberg method). Figures were created using the R software: R Core Team (2017), R Foundation for Statistical Computing, Vienna, Austria. URL https://www.R-project.org/.CC BY · PubMed Central
Figure 3 (A) Volcano plot representing the log2(FC) in x-axis and -log10(q − value) in y-axis. A threshold of 0.6 for the log2(FC) is added as a dotted vertical black line and a threshold of − log10(0.05) as a dotted horizontal black line for the q-value. For representation purpose, the y-axis scale has been squashed by a factor of 5 between 5 and 12. A metabolite is considered significantly modulated if its |log2(FC)|> 0.6 and q-value < 0.05 (in red and labelled on the figure). (B) Boxplots of significantly modulated metabolites, gathered by pathway, Baoding (More Polluted) and Dalian (Less Polluted). Figures were created using the R software: R Core Team (2017), R Foundation for Statistical Computing, Vienna, Austria. URL https://www.R-project.org/.
Figure 3 (A) Volcano plot representing the log2(FC) in x-axis and -log10(q − value) in y-axis. A threshold of 0.6 for the log2(FC) is added as a dotted vertical black line and a threshold of − log10(0.05) as a dotted horizontal black line for the q-value. For representation purpose, the y-axis scale has been squashed by a factor of 5 between 5 and 12. A metabolite is considered significantly modulated if its |log2(FC)|> 0.6 and q-value < 0.05 (in red and labelled on the figure). (B) Boxplots of significantly modulated metabolites, gathered by pathway, Baoding (More Polluted) and Dalian (Less Polluted). Figures were created using the R software: R Core Team (2017), R Foundation for Statistical Computing, Vienna, Austria. URL https://www.R-project.org/.CC BY · PubMed Central
Figure 4 (A) Heatmap of cross-correlation between metabolites and PAHs selected by sparse Canonical Correlation Analysis (sCCA). The values in the heatmap correspond to Pearson’s correlation coefficient. (B) Focus on cis-and trans-urocanate metabolites with boxplots of the log-normalized values. We also represent the cis/trans urocanate ratio. A red star indicates that the difference in mean between the 2 cities, Baoding (More Polluted) and Dalian (Less Polluted), is significant (q-value < 0.05, t-test withcorrection for multiple testing using Benjamini–Hochberg method). Figures were created using the R software: R Core Team (2017), R Foundation for Statistical Computing, Vienna, Austria. URL https://www.R-project.org/.
Figure 4 (A) Heatmap of cross-correlation between metabolites and PAHs selected by sparse Canonical Correlation Analysis (sCCA). The values in the heatmap correspond to Pearson’s correlation coefficient. (B) Focus on cis-and trans-urocanate metabolites with boxplots of the log-normalized values. We also represent the cis/trans urocanate ratio. A red star indicates that the difference in mean between the 2 cities, Baoding (More Polluted) and Dalian (Less Polluted), is significant (q-value < 0.05, t-test withcorrection for multiple testing using Benjamini–Hochberg method). Figures were created using the R software: R Core Team (2017), R Foundation for Statistical Computing, Vienna, Austria. URL https://www.R-project.org/.CC BY · PubMed Central
Figure 5 Heatmaps of the cross-correlation between OTU abundance and metabolites selected by sparse Canonical Correlation Analysis (sCCA), adjusted for city confounder. The values in the heatmap correspond to Pearson’s correlation coefficient. (A) bacterial OTU. (B) fungal OTU. Figures were created using the R software: R Core Team (2017), R Foundation for Statistical Computing, Vienna, Austria. URL https://www.R-project.org/.
Figure 5 Heatmaps of the cross-correlation between OTU abundance and metabolites selected by sparse Canonical Correlation Analysis (sCCA), adjusted for city confounder. The values in the heatmap correspond to Pearson’s correlation coefficient. (A) bacterial OTU. (B) fungal OTU. Figures were created using the R software: R Core Team (2017), R Foundation for Statistical Computing, Vienna, Austria. URL https://www.R-project.org/.CC BY · PubMed Central
Figure 6 (A) Cluster dendrogram of the hierarchial clustering performed on the consensus space constructed by MAXVAR-A model from the PAH, metabolites and Bacteria OTUs selected by sCCA. Individuals are colored by cities. Based on the height of the gap between 2 consecutive level of the dendrogram, we chose to construct 4 clusters of individuals. (B) Representation of hierarchical clustering on the MAXVAR-A consensus space, with colored convex hull around cluster. The two first component of the consensus space represent 45.9% of the total variability. The table in the upper-right of the figure represents the repartition of individuals between the 2 cities, Baoding (More Polluted) and Dalian (Less Polluted), for each cluster. Figures were created using the R software: R Core Team (2017), R Foundation for Statistical Computing, Vienna, Austria. URL https://www.R-project.org/.
Figure 6 (A) Cluster dendrogram of the hierarchial clustering performed on the consensus space constructed by MAXVAR-A model from the PAH, metabolites and Bacteria OTUs selected by sCCA. Individuals are colored by cities. Based on the height of the gap between 2 consecutive level of the dendrogram, we chose to construct 4 clusters of individuals. (B) Representation of hierarchical clustering on the MAXVAR-A consensus space, with colored convex hull around cluster. The two first component of the consensus space represent 45.9% of the total variability. The table in the upper-right of the figure represents the repartition of individuals between the 2 cities, Baoding (More Polluted) and Dalian (Less Polluted), for each cluster. Figures were created using the R software: R Core Team (2017), R Foundation for Statistical Computing, Vienna, Austria. URL https://www.R-project.org/.CC BY · PubMed Central
Figure 7 (A) Relative proportion of Spread Macules severity score in the consensus clusters. A score of 1 correspond to “no spread macules”, a score of 2 to “weak spread macules”, a score of 3 to “moderate spread macules” and a score of 4 to “severe spread macules”. (B) Characterization of consensus clusters by Spread Macules severity score using v-test statistic. In row we represent the consensus clusters and in column the location of the spread macule score on the face (cheek or forehead). A positive v-test value (in green) indicates that the severity score is in higher proportion in the cluster compare to the global population. A negative v-test value (in red) indicates that the severity score is in higher proportion in the cluster compare to the global population. The v-test value is considered significant if it reaches a threshold of 2 (black dotted vertical line on the plot). Figures were created using the R software: R Core Team (2017), R Foundation for Statistical Computing, Vienna, Austria. URL https://www.R-project.org/.
Figure 7 (A) Relative proportion of Spread Macules severity score in the consensus clusters. A score of 1 correspond to “no spread macules”, a score of 2 to “weak spread macules”, a score of 3 to “moderate spread macules” and a score of 4 to “severe spread macules”. (B) Characterization of consensus clusters by Spread Macules severity score using v-test statistic. In row we represent the consensus clusters and in column the location of the spread macule score on the face (cheek or forehead). A positive v-test value (in green) indicates that the severity score is in higher proportion in the cluster compare to the global population. A negative v-test value (in red) indicates that the severity score is in higher proportion in the cluster compare to the global population. The v-test value is considered significant if it reaches a threshold of 2 (black dotted vertical line on the plot). Figures were created using the R software: R Core Team (2017), R Foundation for Statistical Computing, Vienna, Austria. URL https://www.R-project.org/.CC BY · PubMed Central
Figure 8 Focus on the characterization of the consensus cluster 1 by PAHs, metabolites and bacteria OTUs using v-test statistic. A positive v-test value (in green) indicates that the variable has mean value in the cluster higher than the global population. A negative v-test value (in red indicates that the variable has an average lower in the cluster higher than the global population. Only the variables with a significant v-test value are represented. The y-axis text is colored by type of variable (blue for metabolites, green for PAHs and yellow for bacterial OTUs). Figures were created using the R software: R Core Team (2017), R Foundation for Statistical Computing, Vienna, Austria. URL https://www.R-project.org/.
Figure 8 Focus on the characterization of the consensus cluster 1 by PAHs, metabolites and bacteria OTUs using v-test statistic. A positive v-test value (in green) indicates that the variable has mean value in the cluster higher than the global population. A negative v-test value (in red indicates that the variable has an average lower in the cluster higher than the global population. Only the variables with a significant v-test value are represented. The y-axis text is colored by type of variable (blue for metabolites, green for PAHs and yellow for bacterial OTUs). Figures were created using the R software: R Core Team (2017), R Foundation for Statistical Computing, Vienna, Austria. URL https://www.R-project.org/.CC BY · PubMed Central

Verification

Claims the paper makes

The claims and statistics of this paper haven’t been checked yet.

Free: it reads the open-access text and checks the first 5 claims that cite a source we can check. Create a free account to check every claim.

A few free checks a day · papers already verified open instantly · results are public

Claims other papers make about this one

Each is checked against this paper’s own text: does it say what the citing paper says it does?

Self-check

Percentages, sums and reported differences re-computed from the paper’s own numbers.

The self-check needs the paper’s full text.

Citations

The citation lists are queued

They are fetched later and appear here then.

References 57 · Cited by 40

Metadata

Authors
Misra, N., Clavaud, C., Guinot, F., Bourokba, N., Nouveau, S., Mezzache, S., Palazzi, P., Appenzeller, B. M. R., Tenenhaus, A., Leung, M. H. Y., Lee, P. K. H., Bastien, P., Aguilar, L., & Cavusoglu, N.
Affiliations
  • L'Oréal (France) (FR)
  • Luxembourg Institute of Health (LU)
  • Centre National de la Recherche Scientifique (FR)
  • City University of Hong Kong (HK)
Corresponding author
Misra, Namita
Venue
Scientific Reports
Published
2021-09-15
Volume
11
Issue
1
Pages
18302-18302
ISSN
2045-2322 (ISSN-L)
OpenAlex
W3201175722
Cited by
40
References
57
Citations by year
2026: 4 · 2025: 9 · 2024: 11 · 2023: 11 · 2022: 5
FWCI
7.54
Type
journal article
Language
en
Open access
Licence
Locations
  • Scientific Reports (publishedVersion, cc-by)
  • Europe PMC (PubMed Central) (publishedVersion, other-oa)
  • PubMed Central (publishedVersion, cc-by)
  • PubMed (publishedVersion)
  • HAL (submittedVersion, other-oa)
  • DOAJ (DOAJ: Directory of Open Access Journals) (submittedVersion, cc-by-sa)
  • CityU Scholars (submittedVersion, cc-by)
Funders
L'Oreal USA
Topics
  • Health Sciences › Medicine › Dermatology › Dermatology and Skin Diseases
  • Health Sciences › Medicine › Dermatology › Skin Protection and Aging
  • Physical Sciences › Environmental Science › Health, Toxicology and Mutagenesis › Health, Environment, Cognitive Aging
Keywords
air pollution, skin microbiome, polycyclic aromatic hydrocarbons, PAH metabolites, hair contamination, acne, wrinkles, skin pigmentation, skin aging, epidermis, Baoding, Dalian, women
MeSH terms
Disease Susceptibility, Environmental Exposure, Environmental Pollution, Humans, Skin, Skin Diseases, Biomarkers, Genomics, Metagenome, Metabolomics, Metagenomics, Microbiota

About these checks

Registry, retraction, Cites and statistics results are computed, not judged, with one exception: a printed reference that no index lists is read once by a model before it counts as a citation error. Claims are extracted by a model and kept only when their quote appears verbatim in the text; each cited source is then checked, with a model’s help, for whether it says what the claim relies on. Those verdicts can be wrong — read the claim’s quote and the cited source before relying on one.

Statistics and arithmetic are recomputed, not judged.

Confidence bands are shown only for fields calibrated on our annotated test set. None is calibrated yet, so no band is shown.

What counts as a claim ›How we measure confidence ›How we check this ›

Are you an author, or do you see a problem with this page? Request a review

How to cite

Cite CoChat for the checks on this page, and the paper for its own findings.

This page
CoChat. (2026). Citation check: Multi-omics analysis to decipher the molecular link between chronic exposure to pollution and human skin dysfunction. https://app.cochat.ai/papers/10.1038/s41598-021-97572-1
The paper
Misra, N., Clavaud, C., Guinot, F., Bourokba, N., Nouveau, S., Mezzache, S., Palazzi, P., Appenzeller, B. M. R., Tenenhaus, A., Leung, M. H. Y., Lee, P. K. H., Bastien, P., Aguilar, L., & Cavusoglu, N. (2021). Multi-omics analysis to decipher the molecular link between chronic exposure to pollution and human skin dysfunction. Scientific Reports. https://doi.org/10.1038/s41598-021-97572-1

Data sources

Bibliographic data: Semantic Scholar, OpenAlex, Crossref.

Contains information from the Semantic Scholar Academic Graph Datasets, made available under the ODC Attribution License (ODC-BY 1.0).

Semantic Scholar’s data is described in: Kinney, R., et al. (2023). The Semantic Scholar Open Data Platform. arXiv:2301.10140.