

The DOI matches its Crossref record; 2 of the 2 references it cites were found in a registry or an index.
Evidence for the intermediate disturbance hypothesis and exponential decay in replacement in Streptococcus pneumoniae following use of conjugate vaccines
Abstract
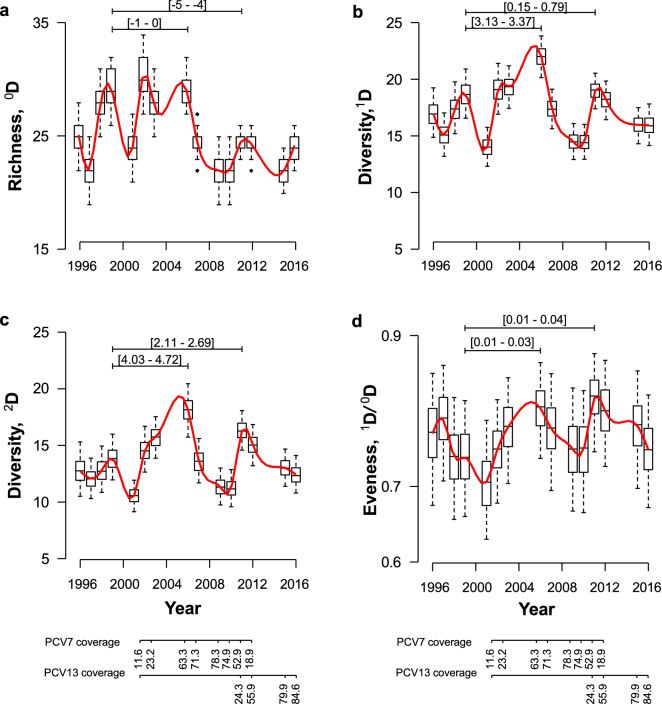
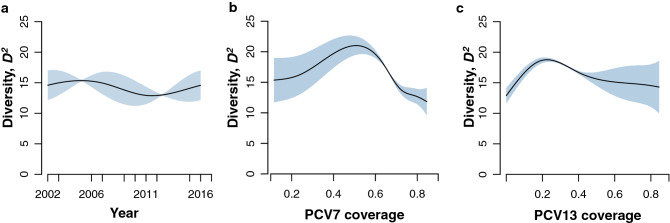
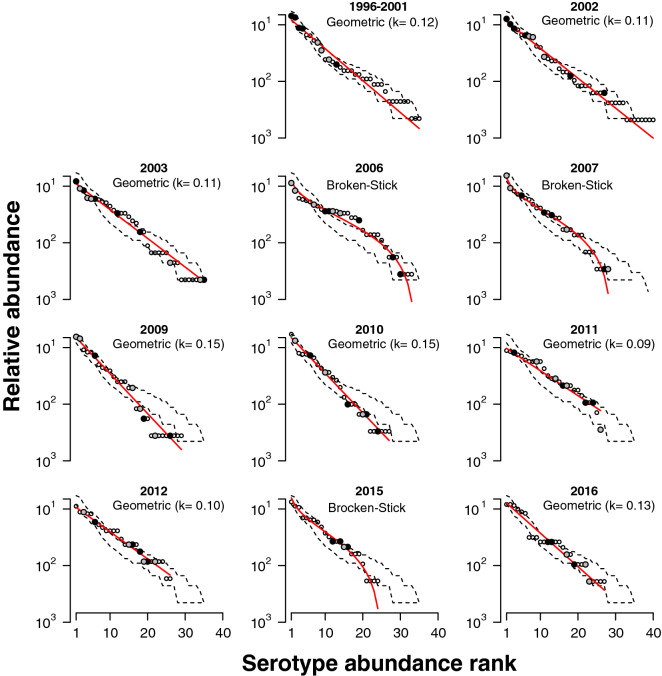
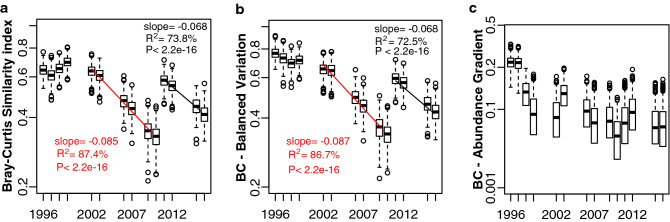
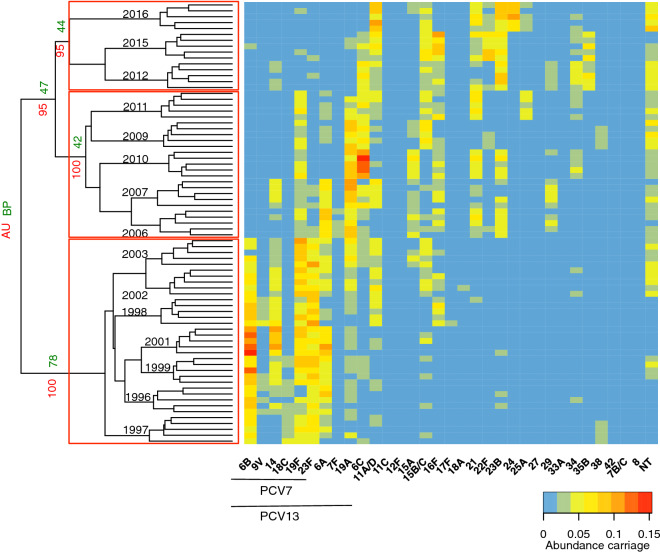
Understanding how pneumococci respond to pneumococcal conjugate vaccines (PCVs) is crucial to predict the impact of upcoming higher-valency vaccines. However, stages in pneumococcal community succession following disturbance are poorly understood as long-time series on carriage are scarce and mostly evaluated at end-point measurements. We used a 20-year cross-sectional dataset of pneumococci carried by Portuguese children, and methods from community ecology, to study community assembly and diversity following use of PCV7 and PCV13. Two successional stages were detected upon introduction of each PCV: one in which non-vaccine serotypes increased in abundance, fitted by a broken-stick model, and a second in which the community returned to the original structure, fitted by a geometric series, but with different serotype profile and a drop in richness as great as 24%. A peak in diversity was observed for levels of intermediate vaccine uptake (30–40%) in agreement with the intermediate disturbance hypothesis. Serotype replacement was fitted by an exponential decay model (R2 = 80%, P < 0.001). The half-life for replacement was 8 years for PCV7 and 10 years for PCV13. The structure of the pneumococcal community is resilient to vaccine pressure. The increasing loss of diversity, however, suggests it could eventually reach a threshold beyond which it may no longer recover.
Overview
The claims and statistics of this paper haven’t been checked yet.
Run the check — free, no account needed. It reads the open-access text and checks the sources it cites.
Integrity signals
Registry
Cites
Statistics
Figures
Verification
Claims the paper makes
The claims and statistics of this paper haven’t been checked yet.
Run the check — free, no account needed. It reads the open-access text and checks the sources it cites.
Claims other papers make about this one
Each is checked against this paper’s own text: does it say what the citing paper says it does?
The cited source says what the claim attributes to it.
In the citing paper
“which has been supported by recent evidence showing that moderate disturbance can maximize microbial diversity in human-associated microbial communities [34].”
From Severity-dependent alterations in oral microbiota and antibiotic resistance in children with dental fluorosis (2026) · cites this paper as [34]
Self-check
Percentages, sums and reported differences re-computed from the paper’s own numbers.
The self-check needs the paper’s full text.
Citations
Cites
The microbiota of the respiratory tract: gatekeeper to respiratory health
Man, W. H., de Steenhuijsen Piters, W. A. A., & Bogaert, D. (2017) · Nature Reviews Microbiology · doi:10.1038/nrmicro.2017.14 · Cited by 1,384
Variability and Diversity of Nasopharyngeal Microbiota in Children: A Metagenomic Analysis
Bogaert, D., Keijser, B., Huse, S., Rossen, J., Veenhoven, R., van Gils, E., Bruin, J., Montijn, R., Bonten, M., & Sanders, E. (2011) · PLoS ONE · doi:10.1371/journal.pone.0017035 · Cited by 454
Research works printed but not linked: 48
- Weiser, J. N., Ferreira, D. M. & Paton, J. C. Streptococcus pneumoniae: Transmission, colonization and invasion. Nat. Rev. Microbiol. 16, 355–367. https://doi.org/10.1038/s41579-018-0001-8 (2018). · DOI
- Sá-Leão, R. et al. High rates of transmission of and colonization by Streptococcus pneumoniae and Haemophilus influenzae within a day care center revealed in a longitudinal study. J. Clin. Microbiol. 46, 225–234. https://doi.org/10.1128/JCM.01551-07 (2008). · DOI
- Turner, P. et al. A longitudinal study of Streptococcus pneumoniae carriage in a cohort of infants and their mothers on the Thailand-Myanmar border. PLoS ONE 7, e38271. https://doi.org/10.1371/journal.pone.0038271 (2012). · DOI
- Almeida, S. T., Paulo, A. C., Froes, F., de Lencastre, H. & Sá-Leão, R. Dynamics of pneumococcal carriage in adults: A new look at an old paradigm. J. Infect. Dis. 223, 1590–1600. https://doi.org/10.1093/infdis/jiaa558 (2021). · DOI
- Bogaert, D., De Groot, R. & Hermans, P. W. Streptococcus pneumoniae colonisation: The key to pneumococcal disease. Lancet Infect. Dis. 4, 144–154. https://doi.org/10.1016/S1473-3099(04)00938-7 (2004). · DOI · Paper page
- Yahiaoui, R. Y. et al. Prevalence and antibiotic resistance of commensal Streptococcus pneumoniae in nine European countries. Future Microbiol. 11, 737–744. https://doi.org/10.2217/fmb-2015-0011 (2016). · DOI
- Ouldali, N. et al. Invasive pneumococcal disease incidence in children and adults in France during the pneumococcal conjugate vaccine era: An interrupted time-series analysis of data from a 17-year national prospective surveillance study. Lancet Infect. Dis. 21, 137–147. https://doi.org/10.1016/S1473-3099(20)30165-1 (2021). · DOI
- Wahl, B. et al. Burden of Streptococcus pneumoniae and Haemophilus influenzae type b disease in children in the era of conjugate vaccines: Global, regional, and national estimates for 2000–15. Lancet Glob. Health 6, e744–e757. https://doi.org/10.1016/S2214-109X(18)30247-X (2018). · DOI
- Advisory Committee on Immunization Practices. Preventing pneumococcal disease among infants and young children. Recommendations of the Advisory Committee on Immunization Practices (ACIP). MMWR Recomm. Rep. 49, 1–35 (2000).
- De Carvalho Gomes, H., Muscat, M., Monnet, D. L., Giesecke, J. & Lopalco, P. L. Use of seven-valent pneumococcal conjugate vaccine (PCV7) in Europe, 2001–2007. Euro Surveill. 14, 19159 (2009).
- Fitzwater, S. P., Chandran, A., Santosham, M. & Johnson, H. L. The worldwide impact of the seven-valent pneumococcal conjugate vaccine. Pediatr. Infect. Dis. J. 31, 501–508. https://doi.org/10.1097/INF.0b013e31824de9f6 (2012). · DOI
- Esposito, S. & Principi, N. Impacts of the 13-valent pneumococcal conjugate Vaccine in children. J. Immunol. Res. 2015, 591580. https://doi.org/10.1155/2015/591580 (2015). · DOI
- Levy, C. et al. Diversity of serotype replacement after pneumococcal conjugate vaccine implementation in Europe. J. Pediatr. 213, 252-253.e253. https://doi.org/10.1016/j.jpeds.2019.07.057 (2019). · DOI
- Gladstone, R. A. et al. Five winters of pneumococcal serotype replacement in UK carriage following PCV introduction. Vaccine 33, 2015–2021. https://doi.org/10.1016/j.vaccine.2015.03.012 (2015). · DOI
- Nunes, S. et al. The impact of private use of PCV7 in 2009 and 2010 on serotypes and antimicrobial resistance of Streptococcus pneumoniae carried by young children in Portugal: Comparison with data obtained since 1996 generating a 15-year study prior to PCV13 introduction. Vaccine 34, 1648–1656. https://doi.org/10.1016/j.vaccine.2016.02.045 (2016). · DOI
- Félix, S. et al. Impact of private use of the 13-valent pneumococcal conjugate vaccine (PCV13) on pneumococcal carriage among Portuguese children living in urban and rural regions. Vaccine 39, 4524–4533. https://doi.org/10.1016/j.vaccine.2021.06.035 (2021). · DOI
- Ladhani, S. N. et al. Rapid increase in non-vaccine serotypes causing invasive pneumococcal disease in England and Wales, 2000–17: A prospective national observational cohort study. Lancet Infect. Dis. 18, 441–451. https://doi.org/10.1016/S1473-3099(18)30052-5 (2018). · DOI
- Silva-Costa, C. et al. Dominance of vaccine serotypes in pediatric invasive pneumococcal infections in Portugal (2012–2015). Sci. Rep. 9, 6. https://doi.org/10.1038/s41598-018-36799-x (2019). · DOI
- Klugman, K. P. & Rodgers, G. L. Time for a third-generation pneumococcal conjugate vaccine. Lancet Infect. Dis. 21, 14–16. https://doi.org/10.1016/S1473-3099(20)30513-2 (2021). · DOI
- Begon, M. & Harper, L. J. Ecology: Individuals, Populations and Communities 2nd edn. (Blackwell Scientific Publications, 1990).
- Svensson, J. R., Lindegarth, M., Jonsson, P. R. & Pavia, H. Disturbance-diversity models: What do they really predict and how are they tested?. Proc. Biol. Sci. 279, 2163–2170. https://doi.org/10.1098/rspb.2011.2620 (2012). · DOI
- Connell, J. H. Diversity in tropical rain forests and coral reefs. Science 199, 1302–1310. https://doi.org/10.1126/science.199.4335.1302 (1978). · DOI
- Sheil, D. & Burslem, D. F. Defining and defending Connell’s intermediate disturbance hypothesis: A response to Fox. Trends Ecol. Evol. 28, 571–572. https://doi.org/10.1016/j.tree.2013.07.006 (2013). · DOI
- Fox, F. J. Intermediate levels of soil disturbance maximize Alpine plant diversity. Nature 293, 2. https://doi.org/10.1038/293564a0 (1981). · DOI
- Lipsitch, M. et al. Competition among Streptococcus pneumoniae for intranasal colonization in a mouse model. Vaccine 18, 2895–2901. https://doi.org/10.1016/s0264-410x(00)00046-3 (2000). · DOI
- Trzciński, K. et al. Effect of serotype on pneumococcal competition in a mouse colonization model. mBio 6, e00902-00915. https://doi.org/10.1128/mBio.00902-15 (2015). · DOI
- Hanage, W. P. et al. Evidence that pneumococcal serotype replacement in Massachusetts following conjugate vaccination is now complete. Epidemics 2, 80–84. https://doi.org/10.1016/j.epidem.2010.03.005 (2010). · DOI
- Chang, Q. et al. Stability of the pneumococcal population structure in Massachusetts as PCV13 was introduced. BMC Infect. Dis. 15, 68. https://doi.org/10.1186/s12879-015-0797-z (2015). · DOI
- Mika, M. et al. Influence of the pneumococcal conjugate vaccines on the temporal variation of pneumococcal carriage and the nasal microbiota in healthy infants: A longitudinal analysis of a case-control study. Microbiome 5, 85. https://doi.org/10.1186/s40168-017-0302-6 (2017). · DOI
- Løvlie, A., Vestrheim, D. F., Aaberge, I. S. & Steens, A. Changes in pneumococcal carriage prevalence and factors associated with carriage in Norwegian children, four years after introduction of PCV13. BMC Infect. Dis. 20, 29. https://doi.org/10.1186/s12879-019-4754-0 (2020). · DOI
- Valente, C. et al. Impact of the 13-valent pneumococcal conjugate vaccine on Streptococcus pneumoniae multiple serotype carriage. Vaccine 34, 4072–4078. https://doi.org/10.1016/j.vaccine.2016.06.017 (2016). · DOI
- Fattorini, S. A simple method to fit geometric series and broken stick models in community ecology and island biogeography. Acta Oecol. 28, 199–205. https://doi.org/10.1016/j.actao.2005.04.003 (2005). · DOI
- Wilson, B. J. Methods for fitting dominance/diversity curves. J. Veg. Sci. 2, 35–46. https://doi.org/10.2307/3235896 (1991). · DOI
- Magurran, A. E. Measuring Biological Diversity 260 (Blackwell Publishing, 2004).
- Jackson, R. C., Churchill, F. P. & Roden, E. E. Successional changes in bacterial assemblage structure during epilithic biofilm development. Ecology 82, 555–566. https://doi.org/10.2307/2679879 (2001). · DOI
- Lu, H. P. et al. Spatial heterogeneity of gut microbiota reveals multiple bacterial communities with distinct characteristics. Sci. Rep. 4, 6185. https://doi.org/10.1038/srep06185 (2014). · DOI
- Marks, L. R., Reddinger, R. M. & Hakansson, A. P. High levels of genetic recombination during nasopharyngeal carriage and biofilm formation in Streptococcus pneumoniae. mBio https://doi.org/10.1128/mBio.00200-12 (2012). · DOI
- Huang, S. S. et al. Continued impact of pneumococcal conjugate vaccine on carriage in young children. Pediatrics 124, e1-11. https://doi.org/10.1542/peds.2008-3099 (2009). · DOI
- Pessoa, D. et al. Comparative analysis of Streptococcus pneumoniae transmission in Portuguese and Finnish day-care centres. BMC Infect. Dis. 13, 180. https://doi.org/10.1186/1471-2334-13-180 (2013). · DOI
- Paulo, A. C. & Sá-Leão, R. Periodic cycles of pneumococcal serotypes carried by children before and after 7-valent pneumococcal conjugate vaccine. PLoS ONE 12, e0176723. https://doi.org/10.1371/journal.pone.0176723 (2017). · DOI
- Sørensen, U. B. Typing of pneumococci by using 12 pooled antisera. J. Clin. Microbiol. 31, 2097–2100 (1993). · DOI
- Simões, A. S., Valente, C., de Lencastre, H. & Sá-Leão, R. Rapid identification of noncapsulated Streptococcus pneumoniae in nasopharyngeal samples allowing detection of co-colonization and reevaluation of prevalence. Diagn. Microbiol. Infect. Dis. 71, 208–216. https://doi.org/10.1016/j.diagmicrobio.2011.07.009 (2011). · DOI
- Alberdi, A. & Gilbert, M. T. P. A guide to the application of Hill numbers to DNA-based diversity analyses. Mol. Ecol. Resour. 19, 804–817. https://doi.org/10.1111/1755-0998.13014 (2019). · DOI
- Ricotta, C. & Avena, G. C. An information-theoretical measure of taxonomic diversity. Acta Biotheor. 51, 35–41. https://doi.org/10.1023/a:1023000322071 (2003). · DOI
- Jost, L. Entropy and diversity. Oikos 113, 363–375. https://doi.org/10.1111/j.2006.0030-1299.14714.x (2006). · DOI · Paper page
- Wood, S. N. Generalized Additive Models: An Introduction with R (Chapman & Hall/CRC, 2006). · DOI · Paper page
- Wood, S. N., Pya, N. & Säfken, B. Smoothing parameter and model selection for general smooth models. J. Am. Stat. Assoc. 111, 1548–1563. https://doi.org/10.1080/01621459.2016.1180986 (2016). · DOI
- Baselga, A. Separating the two components of abundance-based dissimilarity: Balanced changes inabundance vs. abundance gradients. Method Ecol. Evol. 4, 552–557. https://doi.org/10.1111/2041-210X.12029 (2013). · DOI
Cited by
Sorted by citations
Xia, Y., Peng, S., Yu, J., Wang, Y., Ye, Y., Liu, M., Shang, L., Cui, X., Wang, P., & Ding, Z. (2026) · Journal of Oral Microbiology · doi:10.1080/20002297.2026.2714622
Metadata
- Authors
- Paulo, A. C., & Sá-Leão, R.
- Venue
- Scientific Reports
- Published
- 2022-05-07
- Volume
- 12
- Issue
- 1
- ISSN
- 2045-2322
- PMC
- PMC9079081
- Cited by
- 6
- References
- 2
- Language
- en
- Funders
- Fundação para a Ciência e a Tecnologia,Portugal (SFRH/PBD/99638/2014)
- Programa Operacional Temático Factores de Competitividade (LISBOA-01-0145-FEDER-007660)
About these checks
Registry, retraction, Cites and statistics results are computed, not judged, with one exception: a printed reference that no index lists is read once by a model before it counts as a citation error. Claims are extracted by a model and kept only when their quote appears verbatim in the text; each cited source is then checked, with a model’s help, for whether it says what the claim relies on. Those verdicts can be wrong — read the claim’s quote and the cited source before relying on one.
Statistics and arithmetic are recomputed, not judged.
Confidence bands are shown only for fields calibrated on our annotated test set. None is calibrated yet, so no band is shown.
What counts as a claim ›How we measure confidence ›How we check this ›
Are you an author, or do you see a problem with this page? Request a review
