

The DOI matches its Crossref record; the references it cites are not checked yet.
DNMT1/PKR double knockdowned HepG2 (HepG2-DP) cells have high hepatic function and differentiation ability
Open accessAbstract
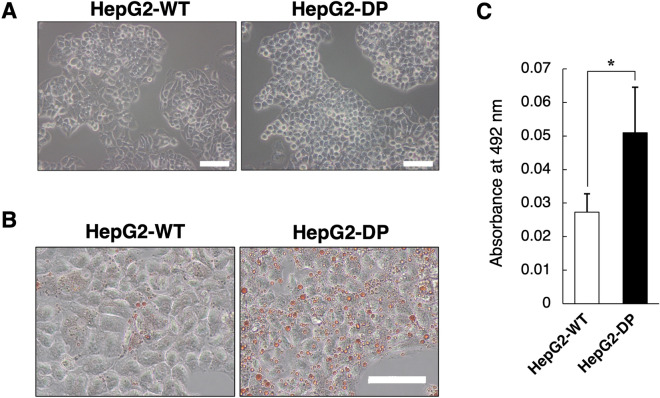
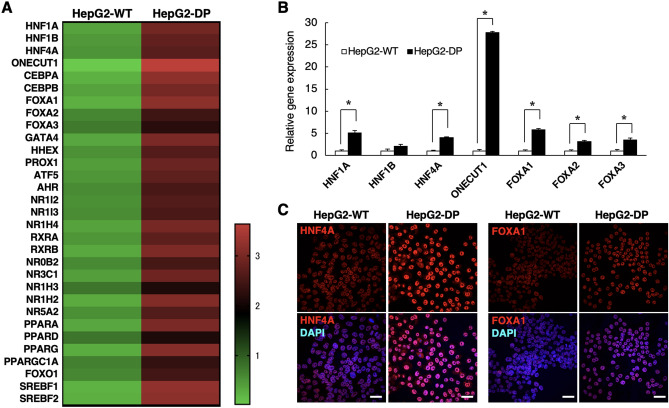
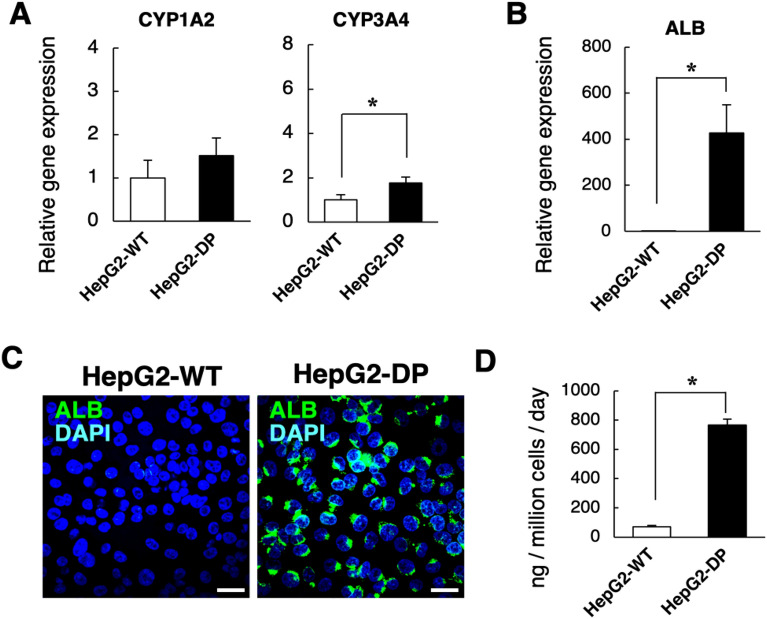
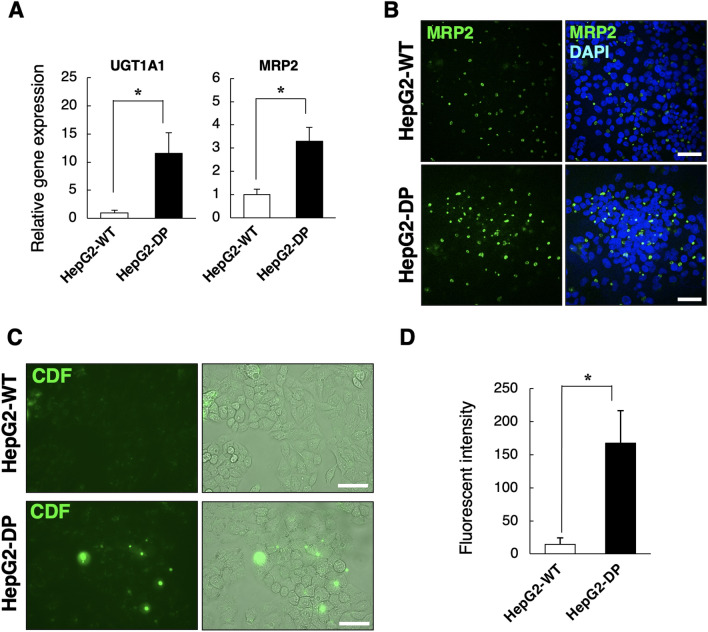
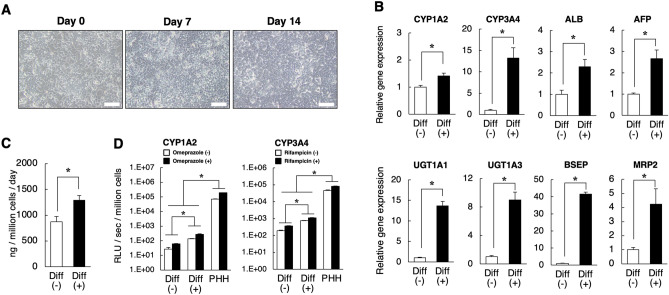
HepG2 cells are widely used as a human hepatocytes model, but their functions, including drug metabolism, are inferior to primary hepatocytes. We previously reported that the hepatic gene expressions in HepG2 cells were upregulated by treatment with zebularine, which is an inhibitor of DNA methylation, through the inhibition of both DNA methyltransferase 1 (DNMT1) and double-stranded RNA-dependent protein kinase (PKR). In this study, we established a new HepG2 cell subline, HepG2-DP cells, by stable double knockdown of DNMT1 and PKR and evaluated its function. Albumin production, expression of CYP1A2 genes, and accumulation of lipid droplets were increased in HepG2-DP cells compared with the original HepG2 cells. Comprehensive gene expression analysis of transcription factors revealed that the expression of important genes for hepatic function, such as HNF1β, HNF4α, ONECUT1, FOXA1, FOXA2, FOXA3, and various nuclear receptors, was upregulated in HepG2-DP cells. These results indicate that the newly established HepG2-DP cells are a highly functional hepatocyte cell line. In addition, we investigated whether HepG2-DP cells are able to mature by differentiation induction, since HepG2 cells are derived from hepatoblastoma. The gene expression of major CYPs and Phase II, III drug-metabolizing enzyme genes was significantly increased in HepG2-DP cells cultured in differentiation induction medium. These results suggest that HepG2-DP cells can be further matured by the induction of differentiation and could therefore be applied to studies of drug metabolism and pharmacokinetics.
Overview
The claims and statistics of this paper haven’t been checked yet.
Run the check — free, no account needed. It reads the open-access text and checks the sources it cites.
Integrity signals
Registry
Cites
Statistics
Figures
Verification
Claims the paper makes
The claims and statistics of this paper haven’t been checked yet.
Run the check — free, no account needed. It reads the open-access text and checks the sources it cites.
Claims other papers make about this one
Each is checked against this paper’s own text: does it say what the citing paper says it does?
The cited source doesn’t support the claim as written.
In the citing paper
“A HepG2-DP cell line with stable double knockout of DNMT1 and PKR was established, characterized by increased expression of CYP3A4 and albumin and the formation of functional bile ducts, confirming the key role of these targets in the regulation of hepatospecific functions [167].”
From The HepG2 Cell Line as a Model for Studying Metabolic Dysfunction-Associated Steatotic Liver Disease (2026) · cites this paper as [167]
Checked by a reasoning model — may be wrong.
Experimental — accuracy not yet measured
Self-check
Percentages, sums and reported differences re-computed from the paper’s own numbers.
The self-check needs the paper’s full text.
Citations
The citation lists are queued
They are fetched later and appear here then.
References 33 · Cited by 4
Research works printed but not linked: 30
- Martignoni, M., Groothuis, G. M. & de Kanter, R. Species differences between mouse, rat, dog, monkey and human CYP-mediated drug metabolism, inhibition and induction. Expert. Opin. Drug Metab. Toxicol. 2, 875–894 (2006). · DOI · Paper page
- Brandon, E. F. et al. Validation of in vitro cell models used in drug metabolism and transport studies; genotyping of cytochrome P450, phase II enzymes and drug transporter polymorphisms in the human hepatoma (HepG2), ovarian carcinoma (IGROV-1) and colon carcinoma (CaCo-2, LS180) cell lines. Toxicol. Appl. Pharmacol. 211, 1–10 (2006). · DOI
- Lin, J. et al. Comparative analysis of phase I and II enzyme activities in 5 hepatic cell lines identifies Huh-7 and HCC-T cells with the highest potential to study drug metabolism. Arch. Toxicol. 86, 87–95 (2012). · DOI
- Gerets, H. H. et al. Characterization of primary human hepatocytes, HepG2 cells, and HepaRG cells at the mRNA level and CYP activity in response to inducers and their predictivity for the detection of human hepatotoxins. Cell Biol. Toxicol. 28, 69–87 (2012). · DOI · Paper page
- Nakamura, K. et al. Evaluation of drug toxicity with hepatocytes cultured in a micro-space cell culture system. J. Biosci. Bioeng. 111(1), 78–84 (2011). · DOI
- Nakamura, K. et al. Expression of albumin and cytochrome P450 enzymes in HepG2 cells cultured with a nanotechnology-based culture plate with microfabricated scaffold. J. Toxicol. Sci. 36(5), 625–633 (2011). · DOI
- Takahashi, Y. et al. 3D spheroid cultures improve the metabolic gene expression profiles of HepaRG cells. Biosci. Rep. 35(3), e00208 (2015). · DOI · Paper page
- Oshikata-Miyazaki, A. & Takezawa, T. Development of an oxygenation culture method for activating the liver-specific functions of HepG2 cells utilizing a collagen vitrigel membrane chamber. Cytotechnology 68(5), 1801–1811 (2016). · DOI
- Takezawa, T. & Uzu, M. HepG2-NIAS cells, a new subline of HepG2 cells that can enhance not only CYP3A4 activity but also expression of drug transporters and form bile canaliculus-like networks by the oxygenation culture via a collagen vitrigel membrane. J. Toxicol. Sci. 47(1), 39–50 (2022). · DOI
- Xuan, J., Chen, S., Ning, B., Tolleson, W. H. & Guo, L. Development of HepG2-derived cells expressing cytochrome P450s for assessing metabolism-associated drug-induced liver toxicity. Chem. Biol. Interact. 255, 63–73 (2016). · DOI · Paper page
- Nakamura, K., Aizawa, K., Aung, K. H., Yamauchi, J. & Tanoue, A. Zebularine upregulates expression of CYP genes through inhibition of DNMT1 and PKR in HepG2 cells. Sci. Rep. 7, 41093 (2017). · DOI · Paper page
- Zhou, L. et al. Zebularine: A novel DNA methylation inhibitor that forms a covalent complex with DNA methyltransferases. J. Mol. Biol. 321(4), 591–599 (2002). · DOI
- Müller, M., Roelofsen, H. & Jansen, P. L. Secretion of organic anions by hepatocytes: Involvement of homologues of the multidrug resistance protein. Semin. Liver Dis. 16(2), 211–220 (1996). · DOI
- Keppler, D., Leier, I. & Jedlitschky, G. Transport of glutathione conjugates and glucuronides by the multidrug resistance proteins MRP1 and MRP2. Biol. Chem. 378(8), 787–791 (1997).
- Guo, L. et al. Similarities and differences in the expression of drug-metabolizing enzymes between human hepatic cell lines and primary human hepatocytes. Drug Metab. Dispos. 39(3), 528–538 (2011). · DOI · Paper page
- Mizuno, S. et al. Expression of DNA methyltransferases DNMT1, 3A, and 3B in normal hematopoiesis and in acute and chronic myelogenous leukemia. Blood 97(5), 1172–1179 (2001). · DOI
- Lam, T. W. et al. Correlative analysis of DNA methyltransferase expression and promoter hypermethylation of tumor suppressor genes in hepatocellular carcinoma. Cancer Genom. Proteom. 3(3–4), 271–277 (2006).
- Luczak, M. W. & Jagodziński, P. P. The role of DNA methylation in cancer development. Folia Histochem. Cytobiol. 44(3), 143–154 (2006).
- Taylor, S. S., Haste, N. M. & Ghosh, G. PKR and eIF2alpha: Integration of kinase dimerization, activation, and substrate docking. Cell 122(6), 823–825 (2005). · DOI
- Balachandran, S. & Barber, G. N. PKR in innate immunity, cancer, and viral oncolysis. Methods Mol. Biol. 383, 277–301 (2007).
- Chang, Q. et al. Sustained JNK1 activation is associated with altered histone H3 methylations in human liver cancer. J. Hepatol. 50(2), 323–333 (2009). · DOI
- Jump, D. B. et al. Fatty acid regulation of hepatic gene transcription. J. Nutr. 135(11), 2503–2506 (2005). · DOI
- Marten, N. W., Hsiang, C. H., Yu, L., Stollenwerk, N. S. & Straus, D. S. Functional activity of hepatocyte nuclear factor-1 is specifically decreased in amino acid-limited hepatoma cells. Biochim. Biophys. Acta 1447(2–3), 160–174 (1999). · DOI
- Rushmore, T. H. & Kong, A. N. Pharmacogenomics, regulation and signaling pathways of phase I and II drug metabolizing enzymes. Curr. Drug Metab. 3(5), 481–490 (2002). · DOI
- Yano, S., Wang, J., Kabayama, S. & Hara, T. Electrolyzed hydrogen water protects against ethanol-induced cytotoxicity by regulating aldehyde metabolism-associated enzymes in the hepatic cell line HepG2. Antioxidants (Basel). 10(5), 801 (2021). · DOI
- Aden, D. P., Fogel, A., Plotkin, S., Damjanov, I. & Knowles, B. B. Controlled synthesis of HBsAg in a differentiated human liver carcinoma-derived cell line. Nature 282, 615–616 (1979). · DOI
- López-Terrada, D., Cheung, S. W., Finegold, M. J. & Knowles, B. B. HepG2 is a hepatoblastoma-derived cell line. Hum. Pathol. 40, 1512–1515 (2009). · DOI
- Ramaiahgari, S. C. et al. A 3D in vitro model of differentiated HepG2 cell spheroids with improved liver-like properties for repeated dose high-throughput toxicity studies. Arch. Toxicol. 88(5), 1083–1095 (2014).
- Li, Y. et al. Developmental stage-specific hepatocytes induce maturation of HepG2 cells by rebuilding the regulatory circuit. Mol. Med. 21(1), 285–295 (2015). · DOI
- Inada, H. et al. Direct reprogramming of human umbilical vein- and peripheral blood-derived endothelial cells into hepatic progenitor cells. Nat. Commun. 11(1), 5292 (2020). · DOI
Metadata
- Authors
- Tanaka-yachi, R., Aizawa, K., Shimizu, K., Akutsu, H., & Nakamura, K.
- Affiliations
- National Research Institute for Child Health and Development (JP)
- Corresponding author
- Nakamura, Kazuaki
- Venue
- Scientific Reports
- Published
- 2022-12-07
- Volume
- 12
- Issue
- 1
- Pages
- 21173-21173
- ISSN
- 2045-2322 (ISSN-L)
- PMC
- PMC9729623
- OpenAlex
- W4311581076
- Cited by
- 4
- References
- 33
- Citations by year
- 2026: 2 · 2025: 2
- FWCI
- 0.30
- Type
- journal article
- Language
- en
- Open access
- gold
- doi.org
- Locations
- Scientific Reports (publishedVersion, cc-by)
- Research Square (acceptedVersion, cc-by)
- PubMed Central (publishedVersion, cc-by)
- PubMed (publishedVersion)
- DOAJ (DOAJ: Directory of Open Access Journals) (submittedVersion, cc-by-sa)
- Funders
- Japan Agency for Medical Research and Development (JP21be0304501)
- Topics
- Health Sciences › Medicine › Hepatology › Liver physiology and pathology
- Life Sciences › Pharmacology, Toxicology and Pharmaceutics › Pharmacology › Drug-Induced Hepatotoxicity and Protection
- Life Sciences › Pharmacology, Toxicology and Pharmaceutics › Pharmacology › Pharmacogenetics and Drug Metabolism
- Keywords
- HepG2 cells, DNMT1, PKR, hepatocyte differentiation, zebularine, DNA methylation inhibition, liver function, CYP1A2, drug metabolism, transcription factors, HNF4α, HNF1B, nuclear receptors, lipid droplets, hepatocyte cell lines
- MeSH terms
- Cell Differentiation, Humans
About these checks
Registry, retraction, Cites and statistics results are computed, not judged, with one exception: a printed reference that no index lists is read once by a model before it counts as a citation error. Claims are extracted by a model and kept only when their quote appears verbatim in the text; each cited source is then checked, with a model’s help, for whether it says what the claim relies on. Those verdicts can be wrong — read the claim’s quote and the cited source before relying on one.
Statistics and arithmetic are recomputed, not judged.
Confidence bands are shown only for fields calibrated on our annotated test set. None is calibrated yet, so no band is shown.
What counts as a claim ›How we measure confidence ›How we check this ›
Are you an author, or do you see a problem with this page? Request a review
How to cite
Cite CoChat for the checks on this page, and the paper for its own findings.
- This page
- CoChat. (2026). Citation check: DNMT1/PKR double knockdowned HepG2 (HepG2-DP) cells have high hepatic function and differentiation ability. https://app.cochat.ai/papers/10.1038/s41598-022-25777-z
- The paper
- Tanaka-yachi, R., Aizawa, K., Shimizu, K., Akutsu, H., & Nakamura, K. (2022). DNMT1/PKR double knockdowned HepG2 (HepG2-DP) cells have high hepatic function and differentiation ability. Scientific Reports. https://doi.org/10.1038/s41598-022-25777-z
