

The DOI matches its Crossref record; 3 of the 3 references it cites were found in a registry or an index.
A GIS-based framework to assess heatwave vulnerability and impact scenarios in urban systems
Open accessAbstract
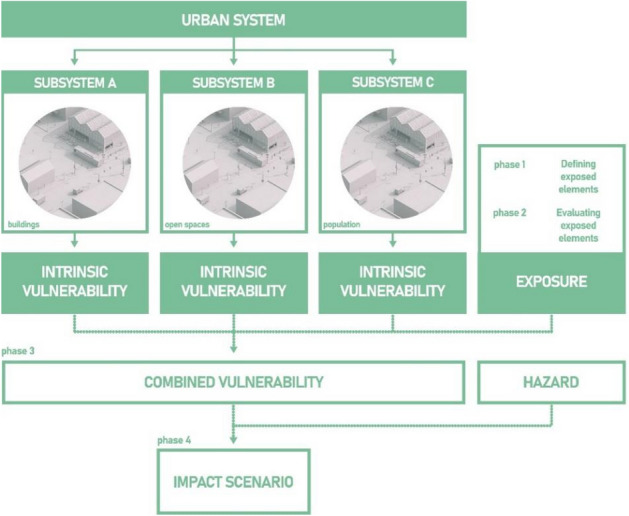
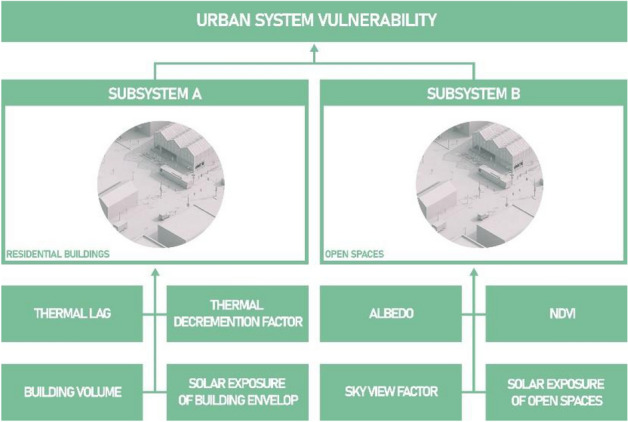
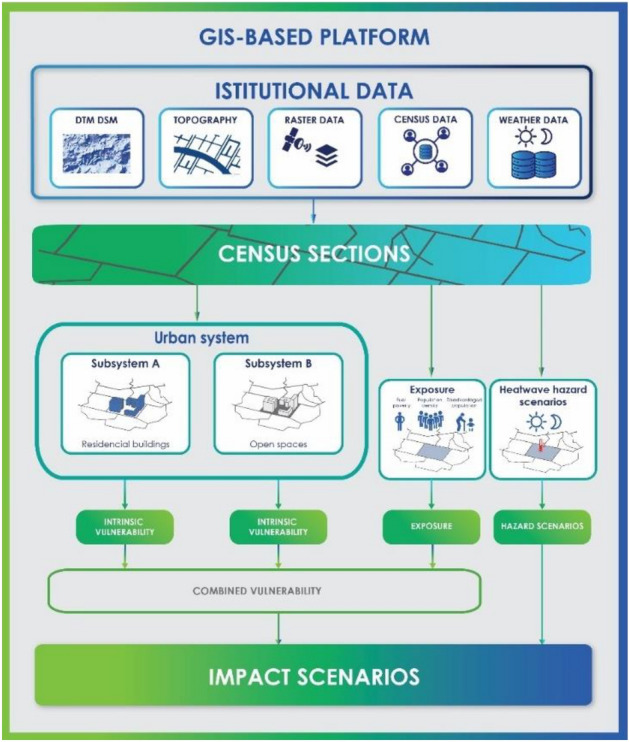
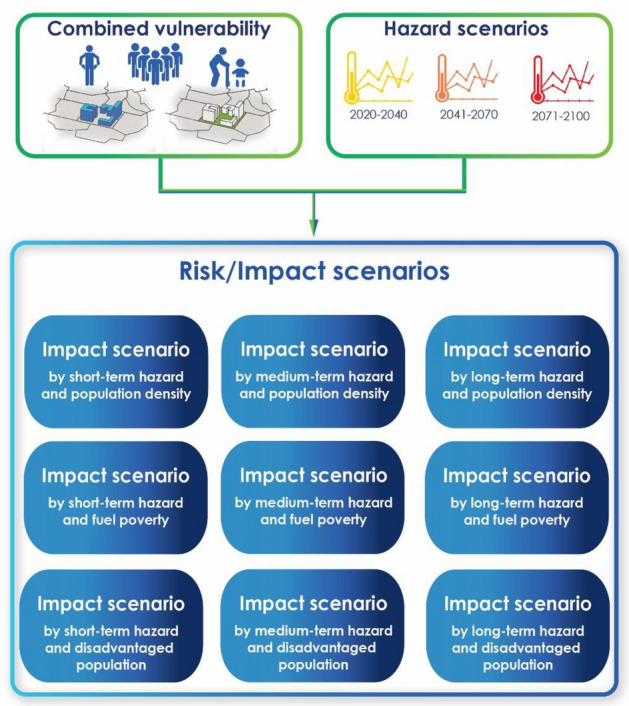
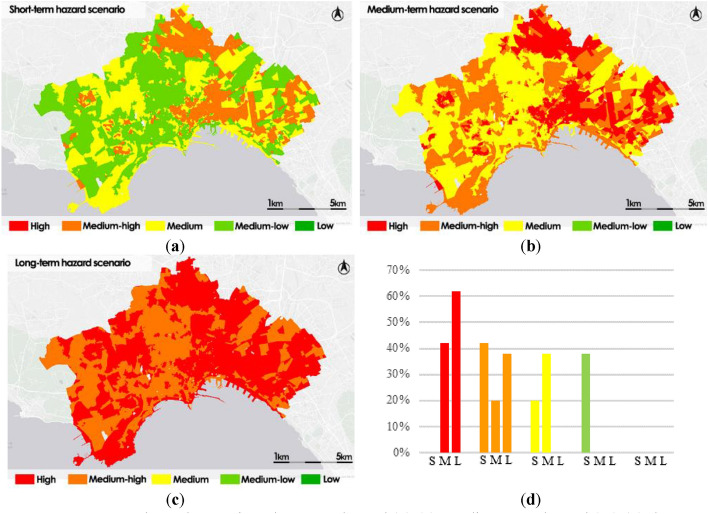
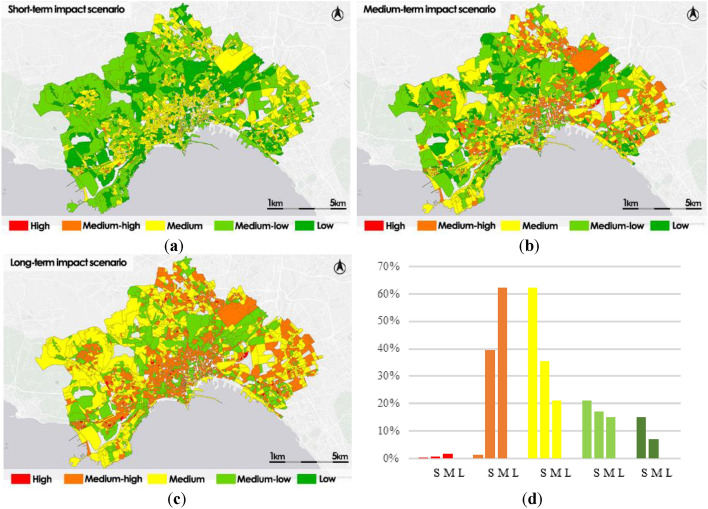
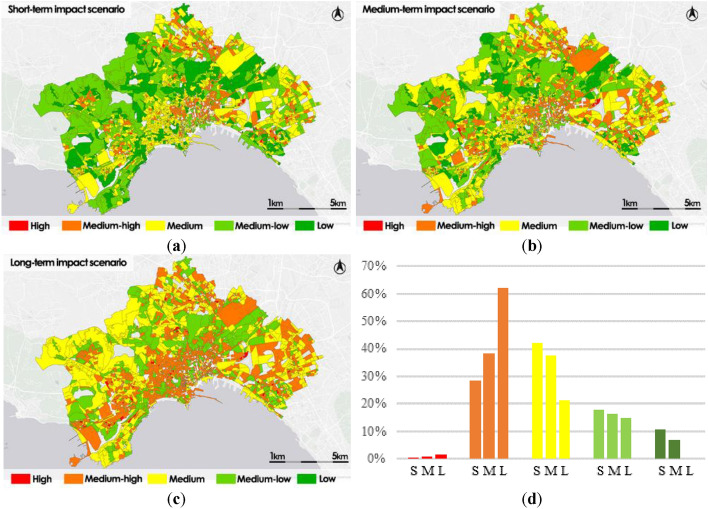
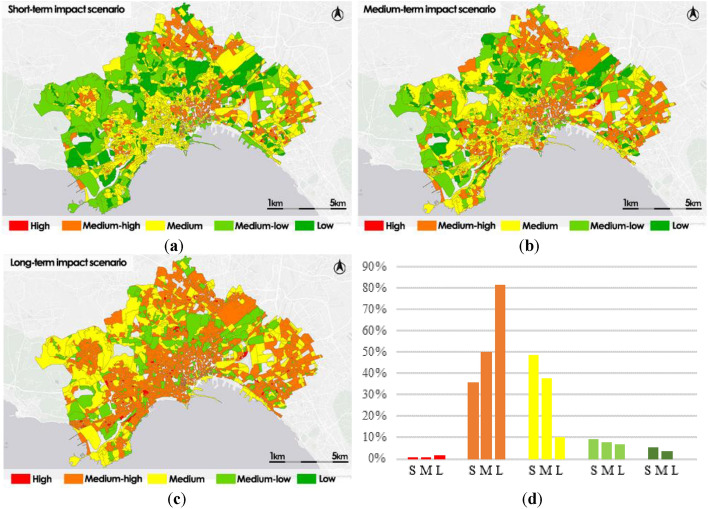
In this work, we propose a GIS-based platform aimed at the analysis of heatwave scenarios risks produced in urbanised environments, applied to assess vulnerability and impact heatwave scenarios. Our framework implements a hierarchical model that represents a good trade-off between forecast accuracy and portability in different urban fabrics, apart from the spatial scale of the data, using topographic and remote sensing spatial data provided by institutional agencies. The framework has been applied to two study areas: the dense city of Naples (Italy) and the intermediately populated city of Avellino (Italy) in order to evaluate its accuracy performances and portability in different urban fabrics. Our framework can be used by urban planners and decision makers as a tool to locate potential risk zones where it is necessary to implement climate-resilient solutions.
Overview
The claims and statistics of this paper haven’t been checked yet.
Run the check — free, no account needed. It reads the open-access text and checks the sources it cites.
Integrity signals
Registry
Cites
Statistics
Figures
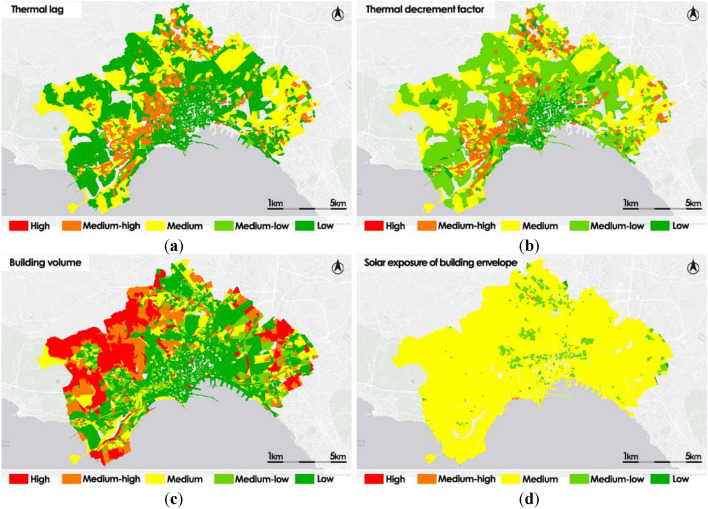
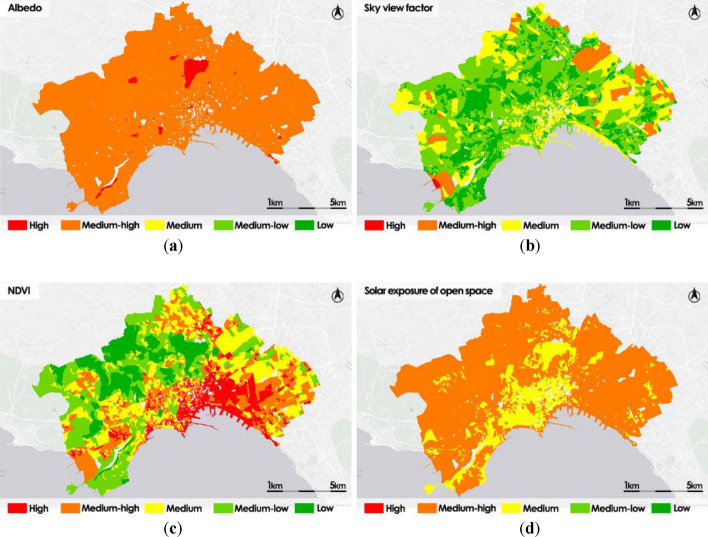
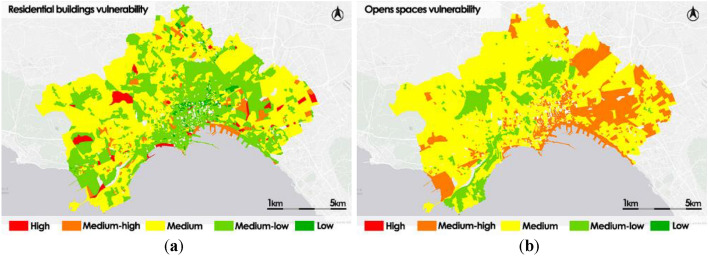
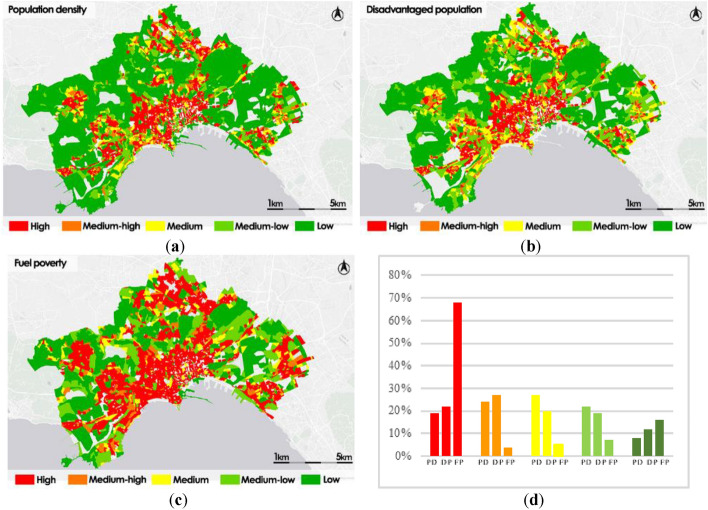
Verification
Claims the paper makes
The claims and statistics of this paper haven’t been checked yet.
Run the check — free, no account needed. It reads the open-access text and checks the sources it cites.
Claims other papers make about this one
Each is checked against this paper’s own text: does it say what the citing paper says it does?
The cited source says what the claim attributes to it.
In the citing paper
“In this sense, GIS- and remote-sensing-based frameworks are often used to combine thermal indicators with environmental and demographic layers to cause urban heat vulnerability or risk maps [5, 6].”
From GPU-Accelerated Deep Learning for Heatwave Prediction and Urban Heat Risk Assessment (2026) · cites this paper as [6]
Self-check
Percentages, sums and reported differences re-computed from the paper’s own numbers.
The self-check needs the paper’s full text.
Citations
Cites
Watts, N., Amann, M., Arnell, N., Ayeb-Karlsson, S., Beagley, J., Belesova, K., Boykoff, M., Byass, P., Cai, W., Campbell-Lendrum, D., et al. (2021) · The Lancet · doi:10.1016/s0140-6736(20)32290-x · Cited by 1,943
Lemonsu, A., Viguié, V., Daniel, M., & Masson, V. (2015) · Urban Climate · doi:10.1016/j.uclim.2015.10.007 · Cited by 319
A Case-Only Study of Vulnerability to Heat Wave–Related Mortality in New York City (2000–2011)
Madrigano, J., Ito, K., Johnson, S., Kinney, P. L., & Matte, T. (2015) · Environmental Health Perspectives · doi:10.1289/ehp.1408178 · Cited by 230
Research works printed but not linked: 17
- Disher, B., Edwards, B., Lawler, T., Radford, D. Measuring heatwaves and their impacts. In: Air Pollution Sources, Statistics and Health Effects. Encyclopedia of Sustainability Science and Technology Series (eds Goodsite, M. E., Johnson, M. S. & Hertel, O.). (Springer, New York, NY, 2021). https://doi.org/10.1007/978-1-0716-0596-7_1102 · DOI
- Kumar, D., Alam, M. & Sanjayan, J. Building adaptation to extreme heatwaves. In: Engineering for Extremes. Springer Tracts in Civil Engineering, (eds Stewart, M. G. & Rosowsky, D. V.) (Springer, Cham, 2022). https://doi.org/10.1007/978-3-030-85018-0_9 · DOI
- Macnee, R. G. D. & Tokai, A. Heatwave vulnerability and exposure mapping for Osaka City. Environ. Syst. Decis. Jpn. 36, 368–376. https://doi.org/10.1007/s10669-016-9607-4 (2016). · DOI
- Wolf, T. & McGregor, G. The development of a heatwave vulnerability index for London, United Kingdom. Weather Clim. Extremes 1, 59–68 (2013). · DOI
- Bao, J., Li, X. & Yu, C. The construction and validation of the heat vulnerability index, review. Int. J. Environ. Res Public Health 12, 7220–7234. https://doi.org/10.3390/ijerph120707220 (2015). · DOI
- Fazey, I. et al. A three-tiered approach to participatory vulnerability assessment in the Solomon Islands. Glob. Environ. Chang. 20(4), 713–728 (2010). · DOI
- Ludena, C.E. & Yoon, S.W. in Local Vulnerability Indicators and Adaptation to Climate Change: A survey. Technical Note N°. 857. (Inter-American Development Bank, Washington DC, (IDB-TN857), 2015). · DOI
- Posey, J. The determinants of vulnerability and adaptive capacity at the municipal level: Evidence from floodplain management programs in the United States. Glob. Environ. Chang. 19(4), 482–493 (2009). · DOI
- Yoo, G., Hwang, J. H. & Choi, C. Development and application of a methodology for vulnerability assessment of climate change in coastal cities. Ocean Coast. Manag. 54(7), 524–534 (2011). · DOI
- Apreda, C., D’Ambrosio, V. & Di Martino, F. A climate vulnerability and impact assessment model for complex urban systems. Environ. Sci. Policy Italy https://doi.org/10.1016/j.envsci.2018.12.016 (2019). · DOI
- D’Ambrosio, V. & Di Martino, F. The METROPOLIS research. Experimental models and decision-making processes for the adaptive environmental design in climate change article history. UPLanD J. Urban Plan. Landsc. Environ. Des. 1(1), 187–217. https://doi.org/10.6092/2531-9906/5038 (2016). · DOI
- Huang, S. et al. A commentary review on the use of normalized difference vegetation index (NDVI) in the era of popular remote sensing. J. For. Res. 32, 1–6. https://doi.org/10.1007/s11676-020-01155-1 (2021). · DOI
- Spano D., Mereu V., Bacciu V., Marras S., Trabucco A., Adinolf M., Barbato G., Bosello F., Breil M., Chiriacò M. V., Coppini G., Essenfelder A., Galluccio G., Lovato T., Marzi S., Masina S., Mercogliano P., Mysiak J., Noce S., Pal J., Reder A., Rianna G., Rizzo A., Santini M., Sini E., Staccione A., Villani V., Zavatarelli M. (2020), “Analisi del rischio. I cambiamenti climatici in Italia”. https://doi.org/10.25424/CMCC/ANALISI_DEL_RISCHIO · DOI
- Zollo, A. L., Rillo, V., Bucchignani, E., Montesarchio, M. & Mercogliano, P. Extreme temperature and precipitation events over Italy: Assessment of high-resolution simulations with COSMO-CLM and future scenarios. Int. J. Climatol. 36(2), 987–1004 (2015). · DOI
- ISTAT, National Institute of Statistics (2015), Proceedings of the 9th General Census of industry and services and Census of non-profit institutions”, 5 – The census sections – Rome, Italy
- Cardona, O. D., van Aalst, M. K., Birkmann, J., Fordham, M., McGregor, G., Perez, R., Pulwarty, R .S., Schipper, E. L. F. & Sinh, B. T. (2012) Determinants of risk: Exposure and vulnerability. In: Managing the Risks of Extreme Events and Disasters to Advance Climate Change Adaptation, (eds Field C. B., Barros V., Stocker T. F., Qin D., Dokken D. J., Ebi K. L., Mastrandrea M. D., Mach K. J., Plattner G. -K., Allen S. K., Tignor M. & Midgley P. M., A Special Report of Working Groups I and II of the IPCC, Publisher: Cambridge University Press, Cambridge, UK, and New York, NY, USA; pp. 65–108. · DOI · Paper page
- Thompson, R. et al. Heatwave mortality in summer 2020 in England: An observational study. Int. J. Environ. Res. Public Health 19(10), 6123 (2022). · DOI
Cited by
Sorted by citations
GPU-Accelerated Deep Learning for Heatwave Prediction and Urban Heat Risk Assessment
Alihodžić, A. (2026) · arXiv · doi:10.48550/arxiv.2605.16435
“Because of this, urban heat analysis should not be based solely on temperature predictions but should also incorporate exposure and vulnerability factors [3–6].”
Metadata
- Authors
- D’Ambrosio, V., Di Martino, F., & Miraglia, V.
- Affiliations
- University of Naples Federico II (IT)
- Venue
- Scientific Reports
- Published
- 2023-08-11
- Volume
- 13
- Issue
- 1
- Pages
- 13073-13073
- ISSN
- 2045-2322 (ISSN-L)
- PMC
- PMC10421934
- OpenAlex
- W4385761506
- Cited by
- 24
- References
- 3
- Citations by year
- 2026: 10 · 2025: 9 · 2024: 4 · 2023: 1
- FWCI
- 2.00
- Type
- journal article
- Language
- en
- Open access
- gold
- doi.org
- Locations
- Scientific Reports (publishedVersion, cc-by)
- PubMed Central (publishedVersion, cc-by)
- PubMed (publishedVersion)
- DOAJ (DOAJ: Directory of Open Access Journals) (submittedVersion, cc-by-sa)
- Topics
- Physical Sciences › Environmental Science › Environmental Engineering › Urban Heat Island Mitigation
- Physical Sciences › Environmental Science › Health, Toxicology and Mutagenesis › Climate Change and Health Impacts
- Physical Sciences › Environmental Science › Global and Planetary Change › Climate Change and Environmental Impact
- Keywords
- heat waves, urban heat, heatwave vulnerability, hierarchical models, urban climate risk, climate-resilient urban planning, risk zoning, Naples, Avellino, remote sensing data, topographic data
About these checks
Registry, retraction, Cites and statistics results are computed, not judged, with one exception: a printed reference that no index lists is read once by a model before it counts as a citation error. Claims are extracted by a model and kept only when their quote appears verbatim in the text; each cited source is then checked, with a model’s help, for whether it says what the claim relies on. Those verdicts can be wrong — read the claim’s quote and the cited source before relying on one.
Statistics and arithmetic are recomputed, not judged.
Confidence bands are shown only for fields calibrated on our annotated test set. None is calibrated yet, so no band is shown.
What counts as a claim ›How we measure confidence ›How we check this ›
Are you an author, or do you see a problem with this page? Request a review
