

The DOI matches its Crossref record; 21 of the 21 references it cites were found in a registry or an index.
Data-driven prediction of the equivalent sand-grain roughness
Abstract
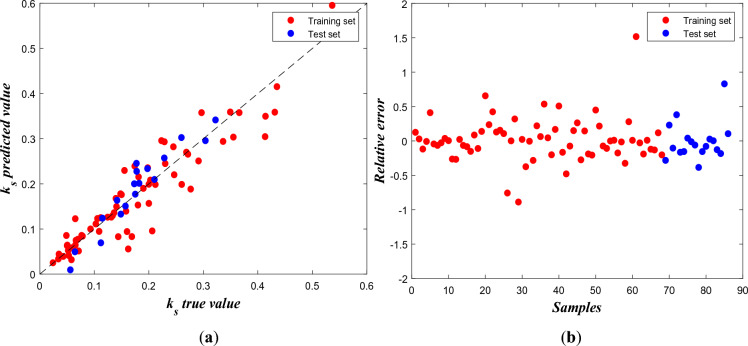
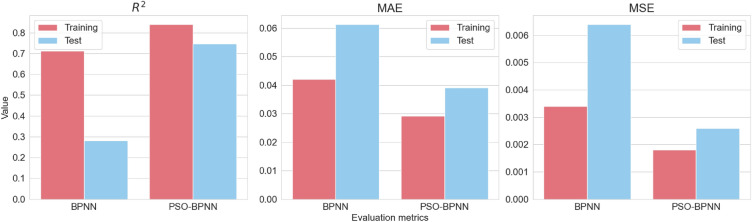
Surface roughness affects the near-wall fluid velocity profile and surface drag, and is commonly quantified by the equivalent sand-grain roughness $${k}_{s}$$ k s . It is essential to estimate $${k}_{s}$$ k s for accurate fluid dynamic problem modeling. While numerous roughness correlation formulas have been proposed to predict $${k}_{s}$$ k s in the fully rough regime, most of them are restricted to certain roughness types, with various geometric parameters considered in each case, leading to ongoing disagreements regarding its parameterization and lack of universality. In this study, a Particle Swarm Optimized Backpropagation (PSO-BP) method is proposed to predict $${k}_{s}$$ k s based on the selected surface parameters from previous DNS, LES, and experimental results for flow behavior over various surface roughness. The PSO-BP model’s ability to predict $${k}_{s}$$ k s in the fully rough region is evaluated and compared with both the existing roughness correction formulas as well as the traditional BP model. An optimized polynomial function is also proposed to serve as a ‘white box’ for predicting $${k}_{s}$$ k s . It turns out that the PSO-BP method has better performance in the evaluation metrics compared to other methods, yielding a Mean Absolute Error (MAE) of 0.0390, a Mean Squared Error (MSE) of 0.0026 and a Mean Absolute Percentage Error (MAPE) of 28.12%. This novel approach for estimating $${k}_{s}$$ k s has practical applicability and holds promise for improving the precision and efficiency of calculations related to equivalent sand-grain roughness, and thus provides more accurate and effective solutions for CFD and other engineering applications.
Overview
The claims and statistics of this paper haven’t been checked yet.
Run the check — free, no account needed. It reads the open-access text and checks the sources it cites.
Integrity signals
Registry
Cites
Statistics
Figures
Verification
Claims the paper makes
The claims and statistics of this paper haven’t been checked yet.
Run the check — free, no account needed. It reads the open-access text and checks the sources it cites.
Claims other papers make about this one
Each is checked against this paper’s own text: does it say what the citing paper says it does?
The check wasn’t confident either way, so it gives no verdict — never disputed.
In the citing paper
“In the context of climate change, where growing seasons are extending in temperate zones 37 , this roughness blind spot leads to a systemic under-prediction of flood hazards during summer monsoon events 38 .”
From AI-driven digital twinning quantifies the trade-off between flood conveyance and riparian stability under climate extremes (2026) · cites this paper as [38]
Experimental — accuracy not yet measured
Self-check
Percentages, sums and reported differences re-computed from the paper’s own numbers.
The self-check needs the paper’s full text.
Citations
Cites
Kennedy, J., & Eberhart, R. (2002) · Proceedings of ICNN'95 - International Conference on Neural Networks · doi:10.1109/icnn.1995.488968 · Cited by 58,192
A review on turbulent flow over rough surfaces: Fundamentals and theories
Kadivar, M., Tormey, D., & McGranaghan, G. (2021) · International Journal of Thermofluids · doi:10.1016/j.ijft.2021.100077 · Cited by 374
Predicting the Drag of Rough Surfaces
Chung, D., Hutchins, N., Schultz, M. P., & Flack, K. A. (2021) · Annual Review of Fluid Mechanics · doi:10.1146/annurev-fluid-062520-115127 · Cited by 345
1996 IEEE International Conference on Evolutionary Computation Proceedings
Ieee, C. (1996) · Cited by 282
Chan, L., MacDonald, M., Chung, D., Hutchins, N. T., & Ooi, A. S. H. (2015) · Journal of Fluid Mechanics · doi:10.1017/jfm.2015.172 · Cited by 211
Toward a Universal Roughness Correlation
Forooghi, P., Stroh, A., Magagnato, F., Jakirlic, S. Z., & Frohnapfel, B. (2017) · Journal of Fluids Engineering · doi:10.1115/1.4037280 · Cited by 162
St and cf Augmentation for Real Turbine Roughness With Elevated Freestream Turbulence
Bons, J. P. (2002) · Journal of Turbomachinery · doi:10.1115/1.1505851 · Cited by 149
Surface correlations of hydrodynamic drag for transitionally rough engineering surfaces
Thakkar, M., Busse, A., & Sandham, N. D. (2016) · Journal of Turbulence · doi:10.1080/14685248.2016.1258119 · Cited by 112
Flack, K. A., Schultz, M. P., & Barros, J. M. (2019) · Flow Turbulence and Combustion · doi:10.1007/s10494-019-00077-1 · Cited by 97
Flack, K. A. (2018) · Journal of Fluid Mechanics · doi:10.1017/jfm.2018.154 · Cited by 94
Cited by
Shin, J. H., Go, S. H., & Park, J. H. (2026) · Scientific Reports · doi:10.1038/s41598-026-63704-8
Metadata
- Authors
- Ma, H., Li, Y., Yang, X., & Ye, L.
- Venue
- Scientific Reports
- Published
- 2023-11-04
- Volume
- 13
- Issue
- 1
- ISSN
- 2045-2322
- PMC
- PMC10625589
- Cited by
- 13
- References
- 21
- Language
- en
- Licence
- creativecommons.org/licenses/by/4.0 (tdm)
- creativecommons.org/licenses/by/4.0 (vor)
About these checks
Registry, retraction, Cites and statistics results are computed, not judged, with one exception: a printed reference that no index lists is read once by a model before it counts as a citation error. Claims are extracted by a model and kept only when their quote appears verbatim in the text; each cited source is then checked, with a model’s help, for whether it says what the claim relies on. Those verdicts can be wrong — read the claim’s quote and the cited source before relying on one.
Statistics and arithmetic are recomputed, not judged.
Confidence bands are shown only for fields calibrated on our annotated test set. None is calibrated yet, so no band is shown.
What counts as a claim ›How we measure confidence ›How we check this ›
Are you an author, or do you see a problem with this page? Request a review
Data sources
Bibliographic data: Semantic Scholar, OpenAlex, Crossref.
Contains information from the Semantic Scholar Academic Graph Datasets, made available under the ODC Attribution License (ODC-BY 1.0).
Semantic Scholar’s data is described in: Kinney, R., et al. (2023). The Semantic Scholar Open Data Platform. arXiv:2301.10140.
