

The DOI matches its Crossref record; 79 of the 79 references it cites were found in a registry or an index.
A GRU–CNN model for auditory attention detection using microstate and recurrence quantification analysis
Open accessAbstract
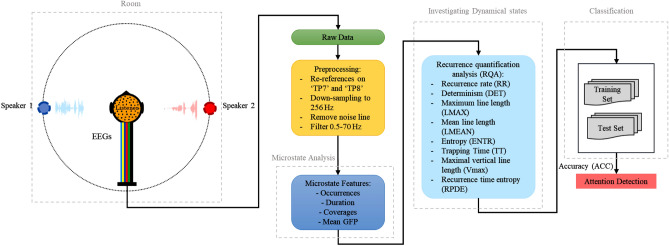
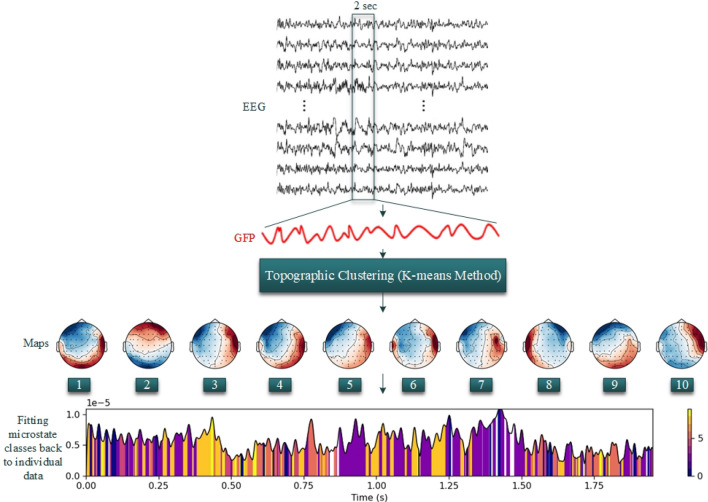
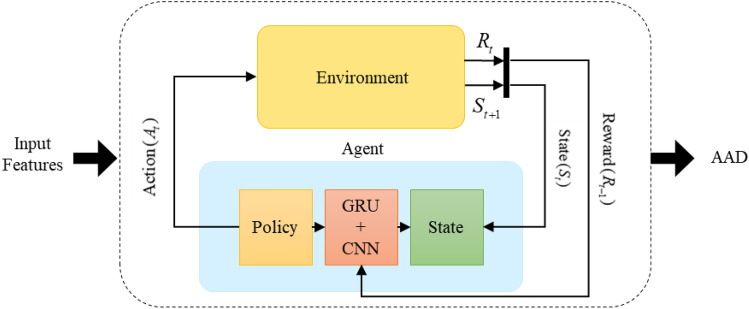
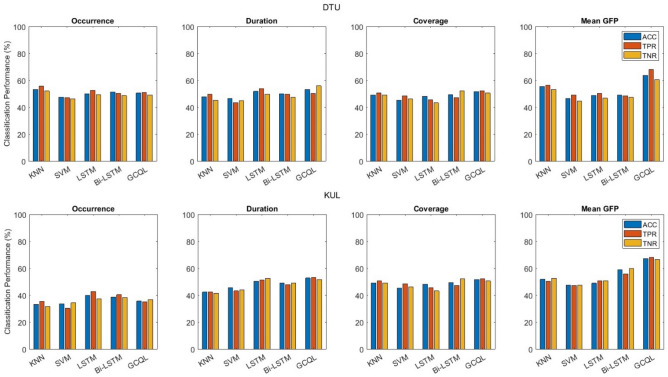
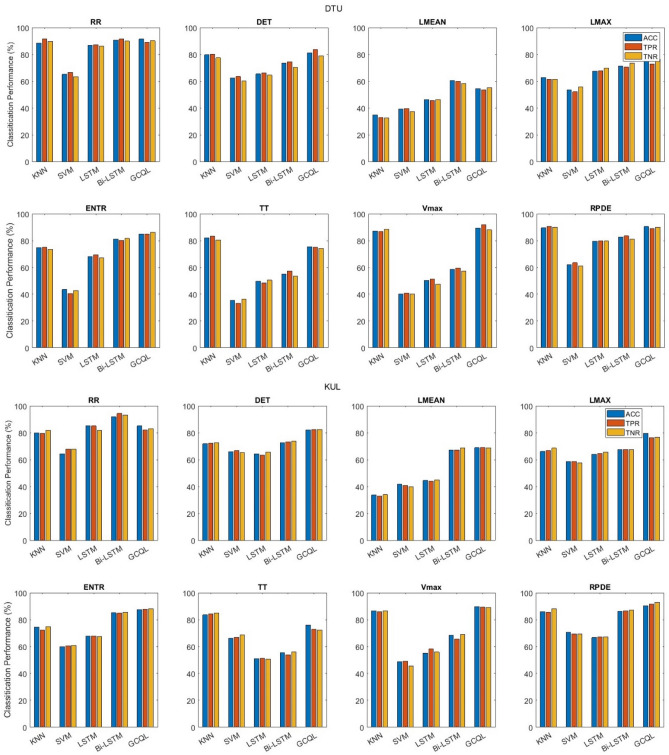
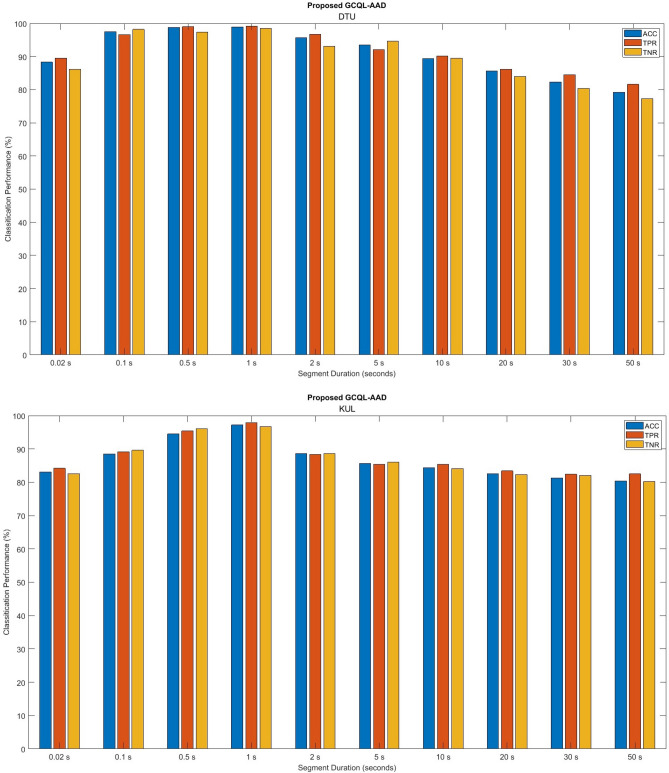
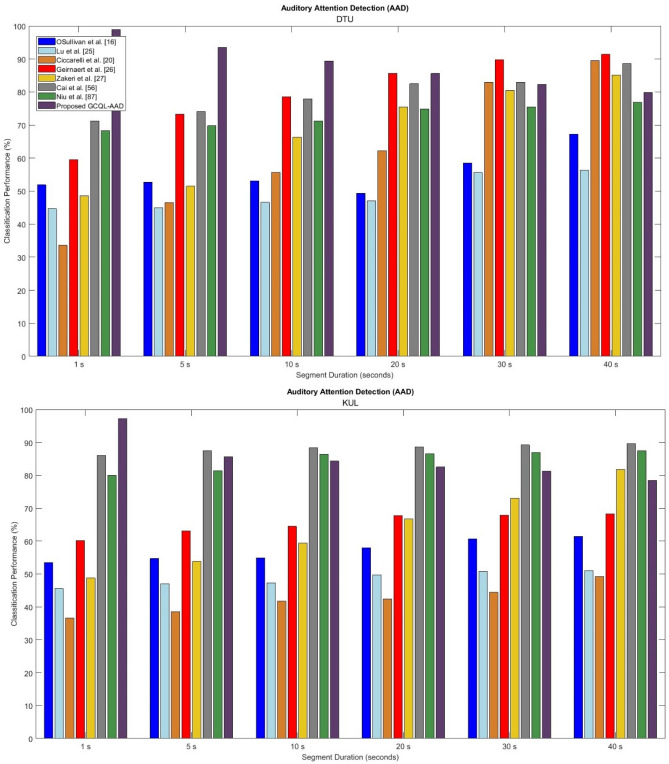
Attention as a cognition ability plays a crucial role in perception which helps humans to concentrate on specific objects of the environment while discarding others. In this paper, auditory attention detection (AAD) is investigated using different dynamic features extracted from multichannel electroencephalography (EEG) signals when listeners attend to a target speaker in the presence of a competing talker. To this aim, microstate and recurrence quantification analysis are utilized to extract different types of features that reflect changes in the brain state during cognitive tasks. Then, an optimized feature set is determined by employing the processes of significant feature selection based on classification performance. The classifier model is developed by hybrid sequential learning that employs Gated Recurrent Units (GRU) and Convolutional Neural Network (CNN) into a unified framework for accurate attention detection. The proposed AAD method shows that the selected feature set achieves the most discriminative features for the classification process. Also, it yields the best performance as compared with state-of-the-art AAD approaches from the literature in terms of various measures. The current study is the first to validate the use of microstate and recurrence quantification parameters to differentiate auditory attention using reinforcement learning without access to stimuli.
Overview
The claims and statistics of this paper haven’t been checked yet.
Run the check — free, no account needed. It reads the open-access text and checks the sources it cites.
Integrity signals
Registry
Cites
Statistics
Figures
Verification
Claims the paper makes
The claims and statistics of this paper haven’t been checked yet.
Run the check — free, no account needed. It reads the open-access text and checks the sources it cites.
Claims other papers make about this one
Each is checked against this paper’s own text: does it say what the citing paper says it does?
The check wasn’t confident either way, so it gives no verdict — never disputed.
In the citing paper
“While T-MSCs solely encourage tumor progression, naive MSCs simultaneously prevent and promote tumor progression [72, 73].”
From Mesenchymal stromal cells in bone marrow niche of patients with multiple myeloma: a double-edged sword (2025) · cites this paper as [73]
Experimental — accuracy not yet measured
Self-check
Percentages, sums and reported differences re-computed from the paper’s own numbers.
The self-check needs the paper’s full text.
Citations
Cites
Hochreiter, S., & Schmidhuber, J. (1997) · Neural Computation · doi:10.1162/neco.1997.9.8.1735 · Cited by 102,318
Learning long-term dependencies with gradient descent is difficult
Bengio, Y., Simard, P., & Frasconi, P. (1994) · IEEE Transactions on Neural Networks · doi:10.1109/72.279181 · Cited by 8,542
An Introduction to Kernel and Nearest-Neighbor Nonparametric Regression
Altman, N. (1992) · The American Statistician · doi:10.1080/00031305.1992.10475879 · Cited by 5,657
Yang (2021) · doi:10.1038/s41598-020-79139-8 · Cited by 5,035
Some Experiments on the Recognition of Speech, with One and with Two Ears
Cherry, E. C. (1953) · The Journal of the Acoustical Society of America · doi:10.1121/1.1907229 · Cited by 4,774
MNE software for processing MEG and EEG data
Gramfort, A., Luessi, M., Larson, E., Engemann, D. A., Strohmeier, D., Brodbeck, C. J., Parkkonen, L. T., & Hämäläinen, M. (2013) · NeuroImage · doi:10.1016/j.neuroimage.2013.10.027 · Cited by 2,062
Selective cortical representation of attended speaker in multi-talker speech perception
Mesgarani, N., & Chang, E. F. (2012) · Nature · doi:10.1038/nature11020 · Cited by 1,012
Segmentation of brain electrical activity into microstates: model estimation and validation
Pascual-Marqui, R. D., Michel, C. M., & Lehmann, D. (1995) · IEEE Transactions on Biomedical Engineering · doi:10.1109/10.391164 · Cited by 991
EEG alpha map series: brain micro-states by space-oriented adaptive segmentation
Lehmann, D., Ozaki, H., & Pal, I. (1987) · Electroencephalography and Clinical Neurophysiology · doi:10.1016/0013-4694(87)90025-3 · Cited by 961
Attentional Selection in a Cocktail Party Environment Can Be Decoded from Single-Trial EEG
O’Sullivan, J., Power, A. J., Mesgarani, N., Rajaram, S., Foxe, J. J., Shinn‐Cunningham, B. G., Slaney, M., Shamma, S., & Lalor, E. C. (2014) · Cerebral Cortex · doi:10.1093/cercor/bht355 · Cited by 829
Research works printed but not linked: 12
- D. E. Broadbent, Perception and communication. Elsevier, (2013).
- Kallenberg, M., Desain, P. & Gielen, S. Auditory selective attention as a method for a brain computer interface. Nijmegen CNS. 2(1), 1–6 (2006).
- Das, N., Zegers, J., Francart, T. & Bertrand, A. EEG-informed speaker extraction from noisy recordings in neuro-steered hearing aids: Linear versus deep learning methods. BioRxiv https://doi.org/10.1101/2020.01.22.915181 (2020). · DOI
- Mesgarani, N. & Chang, E. F. Selective cortical representation of attended speaker in multi-talker speech perception. J. Nat. 485(7397), 233–236 (2012). · DOI
- Lu, Y., Wang, M., Zhang, Q. & Han, Y. Identification of auditory object-specific attention from single-trial electroencephalogram signals via entropy measures and machine learning. Entropy 20(5), 386 (2018). · DOI
- O’sullivan, J. A. et al. Attentional selection in a cocktail party environment can be decoded from single-trial EEG. J. Cerebral Cortex 25(7), 1697–1706 (2015). · DOI
- L. Deckers, N. Das, A. Ansari, A. Bertrand, and T. Francart, EEG-based detection of the attended speaker and the locus of auditory attention with convolutional neural networks. BioRxiv, 475673, (2018)
- Wong, D. D. et al. A comparison of regularization methods in forward and backward models for auditory attention decoding. J. Front. Neurosci. 12, 352049 (2018).
- Ciccarelli, G. et al. Comparison of two-talker attention decoding from EEG with nonlinear neural networks and linear methods. J. Sci. Rep. 9(1), 11538 (2019). · DOI
- Baghdadi, G., Amiri, M., Falotico, E. & Laschi, C. Recurrence quantification analysis of EEG signals for tactile roughness discrimination. J. Int. J. Mach. Learn. Cybern. 12, 1115–1136 (2021). · DOI
- V. Vapnik, The nature of statistical learning theory. Springer science & business media, (2013)
- Zhu, W., Zeng, N. & Wang, N. Sensitivity, specificity, accuracy, associated confidence interval and ROC analysis with practical SAS implementations. NESUG Proceed. Health Care Life Sci. Baltimore Maryland 19, 67 (2010).
Cited by
Sorted by citations
Seifi, N., Ghoodjani, E., Majd, S. S., Maleki, A., & Khamoushi, S. (2025) · Computer and decision making. · doi:10.59543/comdem.v2i.11029 · Cited by 62
Generative artificial intelligence for distributed learning to enhance smart grid communication
Mohammadabadi, S. M. S., Entezami, M., Moghaddam, A. K., Orangian, M., & Nejadshamsi, S. (2024) · International Journal of Intelligent Networks · doi:10.1016/j.ijin.2024.05.007 · Cited by 45
Kamrani, S., Naseramini, R., Khani, P., Razavi, Z. S., Afkhami, H., Atashzar, M. R., Nasri, F., Alavimanesh, S., Saeidi, F., & Ronaghi, H. (2025) · Cancer Cell International · doi:10.1186/s12935-025-03741-x · Cited by 27
“While T-MSCs solely encourage tumor progression, naive MSCs simultaneously prevent and promote tumor progression [72, 73].”
EskandariNasab, M., Hamdi, S. M., & Boubrahimi, S. F. (2024) · The Astrophysical Journal Supplement Series · doi:10.3847/1538-4365/ad7c4a · Cited by 27
Self-citationRahmani, M., Mohajelin, F., Khaleghi, N., Sheykhivand, S., & Danishvar, S. (2024) · Sensors · doi:10.3390/s24113598 · Cited by 23
Metadata
- Authors
- EskandariNasab, M., Raeisi, Z., Lashaki, R. A., & Najafi, H.
- Affiliations
- Utah State University (US)
- University of Tabriz (IR)
- Iran University of Science and Technology (IR)
- Corresponding author
- EskandariNasab, MohammadReza
- Venue
- Scientific Reports
- Published
- 2024-04-17
- Volume
- 14
- Issue
- 1
- Pages
- 8861-8861
- ISSN
- 2045-2322 (ISSN-L)
- PMC
- PMC11024110
- OpenAlex
- W4394881920
- Cited by
- 55
- References
- 79
- Citations by year
- 2026: 8 · 2025: 20 · 2024: 27
- FWCI
- 13.36
- Type
- journal article
- Language
- en
- Open access
- gold
- doi.org
- Locations
- Scientific Reports (publishedVersion, cc-by)
- Research Square (acceptedVersion, cc-by)
- PubMed Central (publishedVersion, cc-by)
- PubMed (publishedVersion)
- DOAJ (DOAJ: Directory of Open Access Journals) (submittedVersion, cc-by-sa)
- Topics
- Life Sciences › Neuroscience › Cognitive Neuroscience › EEG and Brain-Computer Interfaces
- Physical Sciences › Computer Science › Artificial Intelligence › Emotion and Mood Recognition
- Life Sciences › Neuroscience › Cognitive Neuroscience › Neuroscience and Music Perception
- Keywords
- auditory attention detection, EEG microstates, recurrence quantification analysis, gated recurrent unit, convolutional neural networks, feature selection, competing talkers, brain state dynamics, reinforcement learning
- MeSH terms
- Machine Learning, Attention, Brain, Brain Mapping, Electroencephalography, Humans, Neural Networks, Computer
About these checks
Registry, retraction, Cites and statistics results are computed, not judged, with one exception: a printed reference that no index lists is read once by a model before it counts as a citation error. Claims are extracted by a model and kept only when their quote appears verbatim in the text; each cited source is then checked, with a model’s help, for whether it says what the claim relies on. Those verdicts can be wrong — read the claim’s quote and the cited source before relying on one.
Statistics and arithmetic are recomputed, not judged.
Confidence bands are shown only for fields calibrated on our annotated test set. None is calibrated yet, so no band is shown.
What counts as a claim ›How we measure confidence ›How we check this ›
Are you an author, or do you see a problem with this page? Request a review
How to cite
Cite CoChat for the checks on this page, and the paper for its own findings.
- This page
- CoChat. (2026). Citation check: A GRU–CNN model for auditory attention detection using microstate and recurrence quantification analysis. https://app.cochat.ai/papers/10.1038/s41598-024-58886-y
- The paper
- EskandariNasab, M., Raeisi, Z., Lashaki, R. A., & Najafi, H. (2024). A GRU–CNN model for auditory attention detection using microstate and recurrence quantification analysis. Scientific Reports. https://doi.org/10.1038/s41598-024-58886-y
