

The DOI matches its Crossref record; 6 of the 6 references it cites were found in a registry or an index.
L-ascorbate prevents non-alcoholic steatohepatitis-based hepatocarcinogenesis in Sod1/Prdx4 double-knockout mice
Open accessPublished version of a preprint
Abstract
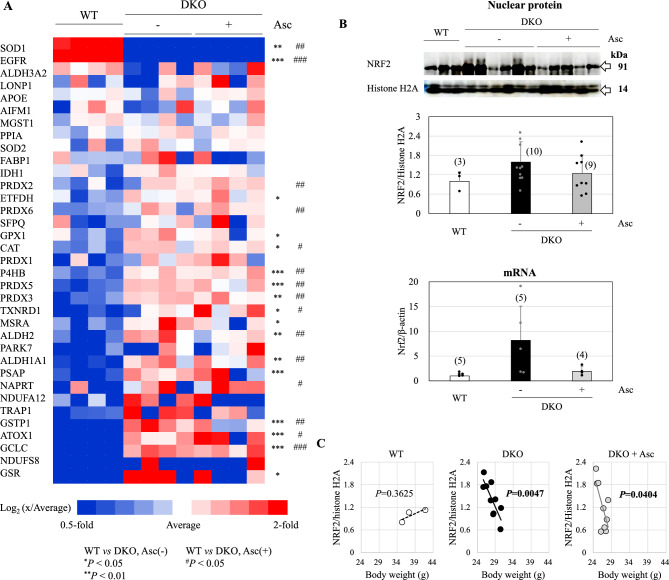
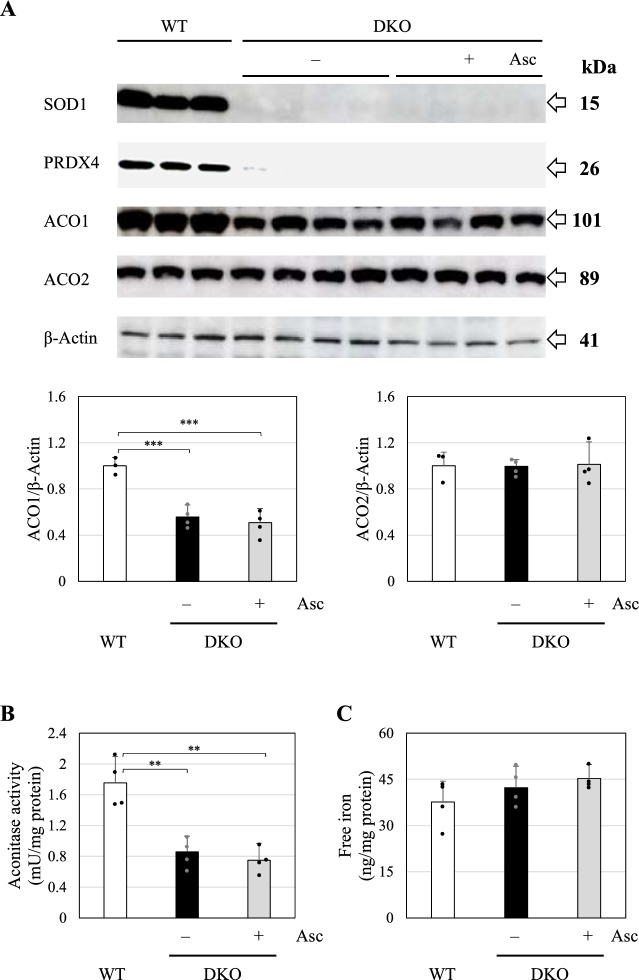
Superoxide dismutase 1 (Sod1) and peroxiredoxin 4 (Prdx4) double knockout (DKO) causes symptoms similar to non-alcoholic steatohepatitis (NASH) even at younger ages. This study revealed that DKO mice exhibited high mortality, and surviving DKO mice developed hepatocellular carcinoma within the first year of life. Administration of physiological doses of L-ascorbate (Asc; 1.5 mg/mL) in drinking water reduced mortality and effectively prevented tumor development. Oxidative stress due to SOD1 deficiency and endoplasmic reticulum stress due to PRDX4 deficiency may promote NASH, ultimately leading to hepatocarcinogenesis. Analyses of liver tissues from 8-month-old DKO mice revealed that Asc supplementation robustly suppressed upregulation of amino acid metabolic pathways observed in DKO mice. These findings suggest that upregulation of amino acid metabolic pathways may be important for the hepatocarcinogenesis. An iron-regulatory protein and aconitase activity were decreased in DKO mice regardless of Asc status. Furthermore, precancerous lesions were more reactive to a ferroptosis-specific antibody than tumor lesions. These results suggest that Asc supplementation and aberrant iron metabolism selectively induce the death of cells that lead to tumorigenic proliferation at the precancerous stage. Adequate intake of Asc in daily life may improve the tumorigenic process promoted by hepatic steatosis due to oxidative insult.
Overview
The claims and statistics of this paper haven’t been checked yet.
Run the check — free, no account needed. It reads the open-access text and checks the sources it cites.
Integrity signals
Registry
Cites
Statistics
Figures
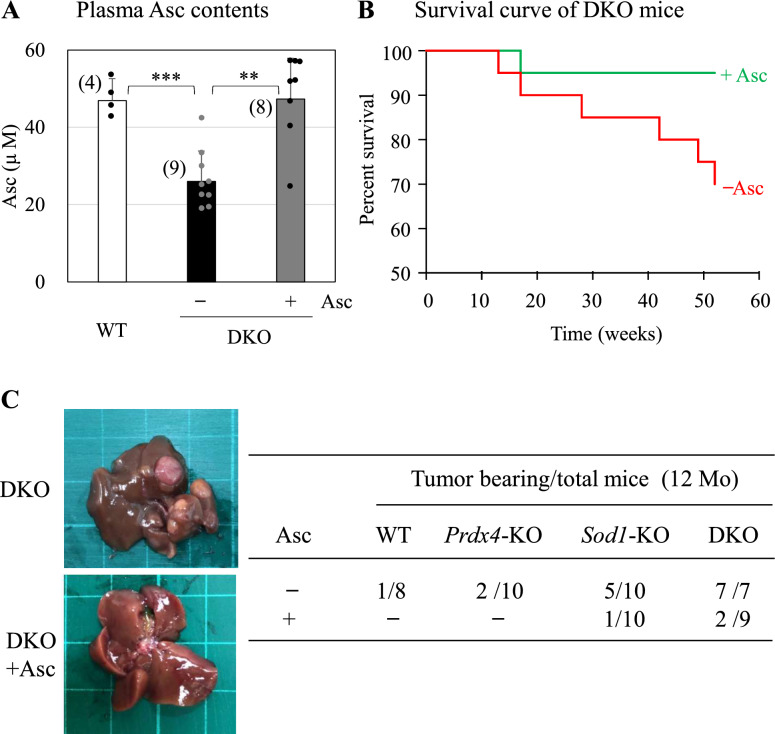
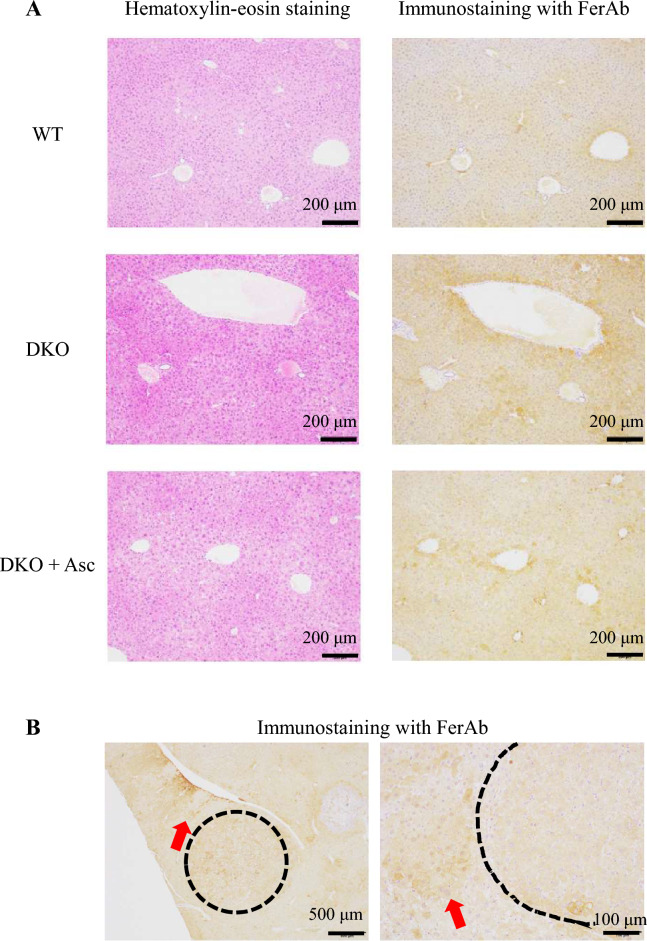
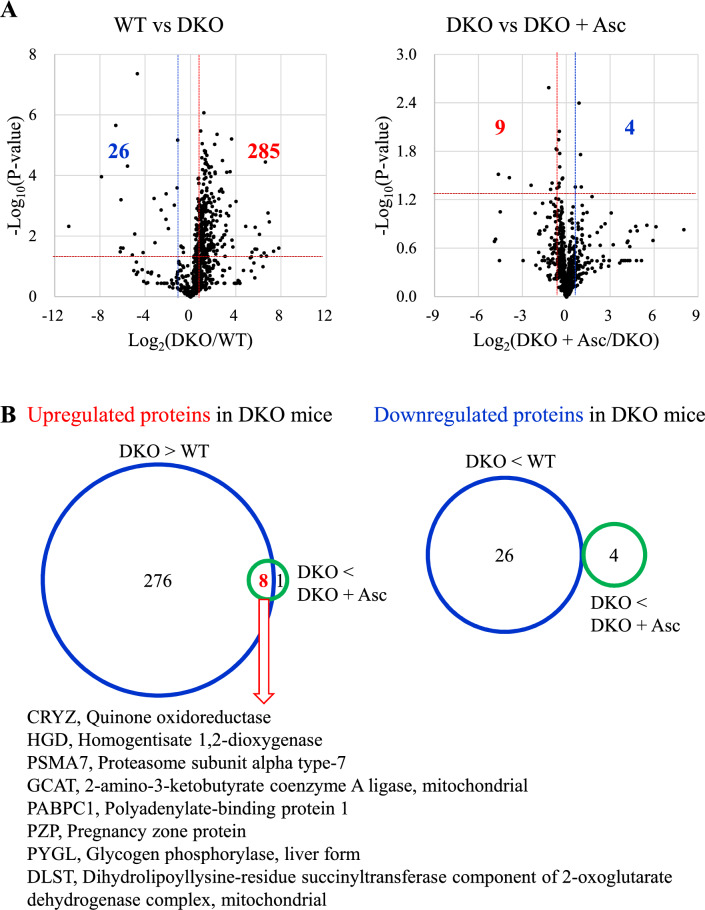
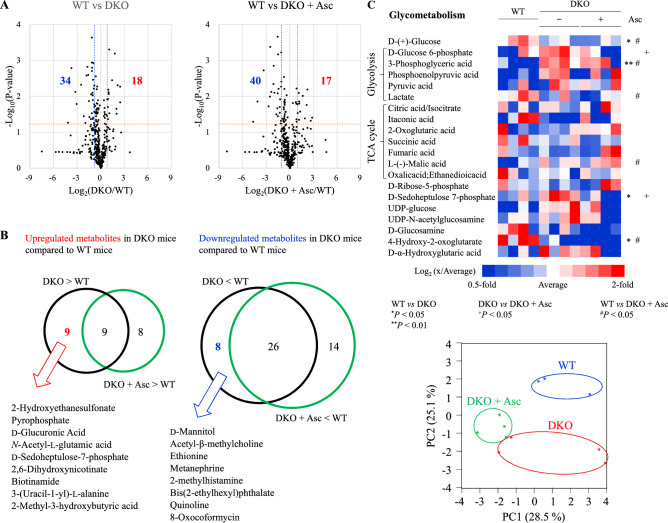
Verification
Claims the paper makes
The claims and statistics of this paper haven’t been checked yet.
Run the check — free, no account needed. It reads the open-access text and checks the sources it cites.
Self-check
Percentages, sums and reported differences re-computed from the paper’s own numbers.
The self-check needs the paper’s full text.
Citations
Cites
Global quantification of mammalian gene expression control
Schwanhäusser, B., Busse, D., Li, N., Dittmar, G., Schuchhardt, J., Wolf, J., Chen, W., & Selbach, M. (2011) · Nature · doi:10.1038/nature10098 · Cited by 6,566 · cited 1×
“An intensity-based absolute quantification algorithm was used to calculate the protein quantification values 53 .”
Oxygen sensing by metazoans: the central role of the HIF hydroxylase pathway.
Kaelin, W. G., & Ratcliffe, P. J. (2008) · Molecular Cell · doi:10.1016/j.molcel.2008.04.009 · Cited by 3,251 · cited 1×
“For instance, Asc-dependent prolyl hydroxylation can suppress HIF1α, a master regulator of the hypoxia pathway 45,46 , and Asc-dependent TET-mediated DNA demethylation could epigenetically activate tumor-suppressor genes 47,48 .”
Elchuri, S., Oberley, T. D., Qi, W., Eisenstein, R. S., Jackson Roberts, L., Van Remmen, H., Epstein, C. J., & Huang, T.-T. (2005) · Oncogene · doi:10.1038/sj.onc.1208207 · Cited by 667
Metabolic reprogramming in liver fibrosis
Horn, P., & Tacke, F. (2024) · Cell Metabolism · doi:10.1016/j.cmet.2024.05.003 · Cited by 432 · cited 2×
“Ferroptosis, an iron-dependent, non-apoptotic form of cell death, is thought to contribute to NASH 3,25 .”
Adaptive immunity: an emerging player in the progression of NAFLD
Sutti, S., & Albano, E. (2020) · Nature Reviews Gastroenterology & Hepatology · doi:10.1038/s41575-019-0210-2 · Cited by 374
Aconitases: non-redox iron-sulfur proteins sensitive to reactive species
Castro, L., Tórtora, V., Mansilla, S., & Radi, R. (2019) · Accounts of Chemical Research · doi:10.1021/acs.accounts.9b00150 · Cited by 146
Research works printed but not linked: 49
- Goh, G. B. & McCullough, A. J. Natural history of nonalcoholic fatty liver disease. Dig. Dis. Sci. 61, 1226–1233. https://doi.org/10.1007/s10620-016-4095-4 (2016). · DOI
- Ioannou, G. N. Epidemiology and risk-stratification of NAFLD-associated HCC. J. Hepatol. 75, 1476–1484. https://doi.org/10.1016/j.jhep.2021.08.012 (2021). · DOI · Paper page
- Shen, X., Yu, Z., Wei, C., Hu, C. & Chen, J. Iron metabolism and ferroptosis in nonalcoholic fatty liver disease: What is our next step?. Am. J. Physiol. Endocrinol. Metab. 326, E767–E775. https://doi.org/10.1152/ajpendo.00260.2023 (2024). · DOI
- Marengo, A., Rosso, C. & Bugianesi, E. Liver cancer: Connections with obesity, fatty liver, and cirrhosis. Annu. Rev. Med. 67, 103–117. https://doi.org/10.1146/annurev-med-090514-013832 (2016). · DOI
- Kohlhepp, M. S., Liu, H., Tacke, F. & Guillot, A. The contradictory roles of macrophages in non-alcoholic fatty liver disease and primary liver cancer-Challenges and opportunities. Front. Mol. Biosci. 10, 1129831. https://doi.org/10.3389/fmolb.2023.1129831 (2023). · DOI · Paper page
- Chen, Z., Tian, R., She, Z., Cai, J. & Li, H. Role of oxidative stress in the pathogenesis of nonalcoholic fatty liver disease. Free Radic. Biol. Med. 15, 116–141. https://doi.org/10.1016/j.freeradbiomed.2020.02.025 (2020). · DOI
- Fridovich, I. Superoxide radical and superoxide dismutases. Annu. Rev. Biochem. 64, 97–112. https://doi.org/10.1146/annurev.bi.64.070195.000525 (1995). · DOI · Paper page
- Uchiyama, S., Shimizu, T. & Shirasawa, T. CuZn-SOD deficiency causes ApoB degradation and induces hepatic lipid accumulation by impaired lipoprotein secretion in mice. J. Biol. Chem. 281, 31713–31719. https://doi.org/10.1074/jbc.M603422200 (2006). · DOI
- Erker, L. et al. Effect of the reduction of superoxide dismutase 1 and 2 or treatment with alpha-tocopherol on tumorigenesis in Atm-deficient mice. Free Radic. Biol. Med. 41, 590–600. https://doi.org/10.1016/j.freeradbiomed.2006.04.032 (2006). · DOI
- Wang, M. & Kaufman, R. J. The impact of the endoplasmic reticulum protein-folding environment on cancer development. Nat. Rev. Cancer 14, 581–597. https://doi.org/10.1038/nrc3800 (2014). · DOI
- Luna-Marco, C., Ubink, A., Kopsida, M. & Heindryckx, F. Endoplasmic reticulum stress and metabolism in hepatocellular carcinoma. Am. J. Pathol. 193, 1377–1388. https://doi.org/10.1016/j.ajpath.2022.09.012 (2023). · DOI
- Sekiya, M., Hiraishi, A., Touyama, M. & Sakamoto, K. Oxidative stress induced lipid accumulation via SREBP1c activation in HepG2 cells. Biochem. Biophys. Res. Commun. 375, 602–607. https://doi.org/10.1016/j.bbrc.2008.08.068 (2008). · DOI
- Sato, Y. et al. Synergistic cooperation of PDI family members in peroxiredoxin 4-driven oxidative protein folding. Sci. Rep. 3, 2456. https://doi.org/10.1038/srep02456 (2013). · DOI
- Fujii, J., Ochi, H. & Yamada, S. A comprehensive review of peroxiredoxin 4, a redox protein evolved in oxidative protein folding coupled with hydrogen peroxide detoxification. Free Radic. Biol. Med. 227, 336–354. https://doi.org/10.1016/j.freeradbiomed.2024.12.015 (2024). · DOI
- Zito, E., Chin, K. T., Blais, J., Harding, H. P. & Ron, D. ERO1-beta, a pancreas-specific disulfide oxidase, promotes insulin bio-genesis and glucose homeostasis. J. Cell Biol. 188, 821–832. https://doi.org/10.1083/jcb.200911086 (2010). · DOI
- Zito, E., Hansen, H. G., Yeo, G. S., Fujii, J. & Ron, D. Endoplasmic reticulum thiol oxidase deficiency leads to ascorbic acid depletion and noncanonical scurvy in mice. Mol. Cell 48, 39–51. https://doi.org/10.1016/j.molcel.2012.08.010 (2012). · DOI
- Nabeshima, A. et al. Peroxiredoxin 4 protects against nonalcoholic steatohepatitis and type 2 diabetes in a nongenetic mouse model. Antioxid. Redox Signal. 19, 1983–1998. https://doi.org/10.1089/ars.2012.4946 (2013). · DOI
- Guo, X. et al. The association of peroxiredoxin 4 with the initiation and progression of hepatocellular carcinoma. Antioxid. Redox Signal. 30, 1271–1284. https://doi.org/10.1089/ars.2017.7426 (2019). · DOI
- Homma, T. et al. Double knockout of peroxiredoxin 4 (Prdx4) and superoxide dismutase 1 (Sod1) in mice results in severe liver failure. Oxid. Med. Cell. Longev. 2018, 2812904. https://doi.org/10.1155/2018/2812904 (2018). · DOI
- Njus, D., Kelley, P. M., Tu, Y. J. & Schlegel, H. B. Ascorbic acid: The chemistry underlying its antioxidant properties. Free Radic. Biol. Med. 159, 37–43. https://doi.org/10.1016/j.freeradbiomed.2020.07.013 (2020). · DOI
- Sentman, M. L. et al. Phenotypes of mice lacking extracellular superoxide dismutase and copper- and zinc-containing superoxide dismutase. J. Biol. Chem. 281, 6904–6909. https://doi.org/10.1074/jbc.M510764200 (2006). · DOI
- Iuchi, Y. et al. Elevated oxidative stress in erythrocytes due to a SOD1 deficiency causes anaemia and triggers autoantibody production. Biochem. J. 402, 219–227. https://doi.org/10.1042/BJ20061386 (2007). · DOI
- Kobayashi, S., Harada, Y., Homma, T., Yokoyama, C. & Fujii, J. Characterization of a rat monoclonal antibody raised against ferroptotic cells. J. Immunol. Methods 489, 112912. https://doi.org/10.1016/j.jim.2020.112912 (2021). · DOI
- Yamamoto, M., Kensler, T. W. & Motohashi, H. The Keap1-Nrf2 system: A thiol-based sensor-effector apparatus for maintaining redox homeostasis. Physiol. Rev. 98, 1169–1203. https://doi.org/10.1152/physrev.00023.2017 (2018). · DOI · Paper page
- Davies, K. J. Protein damage and degradation by oxygen radicals. I. general aspects. J. Biol. Chem. 262, 9895–9901 (1987).
- Demasi, M. et al. Redox regulation of the proteasome via S-glutathionylation. Redox Biol. 2, 44–51. https://doi.org/10.1016/j.redox.2013.12.003 (2013). · DOI
- Stockwell, B. R. Ferroptosis turns 10: Emerging mechanisms, physiological functions, and therapeutic applications. Cell 185, 2401–2421. https://doi.org/10.1016/j.cell.2022.06.003 (2022). · DOI
- Motooka, Y. & Toyokuni, S. Ferroptosis as ultimate target of cancer therapy. Antioxid. Redox Signal. 39, 206–223. https://doi.org/10.1089/ars.2022.0048 (2023). · DOI
- Rouault, T. A. The role of iron regulatory proteins in mammalian iron homeostasis and disease. Nat. Chem. Biol. 2, 406–414. https://doi.org/10.1038/nchembio807 (2006). · DOI · Paper page
- Klaunig, J. E. & Kamendulis, L. M. The role of oxidative stress in carcinogenesis. Annu. Rev. Pharmacol. Toxicol. 44, 239–267. https://doi.org/10.1146/annurev.pharmtox.44.101802.121851 (2004). · DOI
- Cameron, E. & Pauling, L. Supplemental ascorbate in the supportive treatment of cancer: Prolongation of survival times in terminal human cancer. Proc. Natl. Acad. Sci. USA 73, 3685–3689. https://doi.org/10.1073/pnas.73.10.3685 (1976). · DOI · Paper page
- Reczek, C. R. & Chandel, N. S. Cancer. Revisiting vitamin C and cancer. Science 350, 1317–1318. https://doi.org/10.1126/science.aad8671 (2015). · DOI
- Chen, Q. et al. Ascorbate in pharmacologic concentrations selectively generates ascorbate radical and hydrogen peroxide in extracellular fluid in vivo. Proc. Natl. Acad. Sci. USA 104, 8749–8754. https://doi.org/10.1073/pnas.0702854104 (2007). · DOI · Paper page
- Villagran, M., Ferreira, J., Martorell, M. & Mardones, L. The role of vitamin C in cancer prevention and therapy: A literature review. Antioxidants 10, 1894. https://doi.org/10.3390/antiox10121894 (2021). · DOI
- Ghanem, A. et al. Ascorbate kills breast cancer cells by rewiring metabolism via redox imbalance and energy crisis. Free Radic. Biol. Med. 163, 196–209. https://doi.org/10.1016/j.freeradbiomed.2020.12.012 (2021). · DOI
- Pozzer, D., Invernizzi, R. W., Blaauw, B., Cantoni, O. & Zito, E. Ascorbic acid route to the endoplasmic reticulum: Function and role in disease. Antioxid. Redox Signal. 34, 845–855. https://doi.org/10.1089/ars.2019.7912 (2021). · DOI
- Takagi, T. et al. Elevated ER stress exacerbates dextran sulfate sodium-induced colitis in PRDX4-knockout mice. Free Radic. Biol. Med. 134, 153–164. https://doi.org/10.1016/j.freeradbiomed.2018.12.024 (2019). · DOI
- Hwang, J. et al. SOD1 suppresses pro-inflammatory immune responses by protecting against oxidative stress in colitis. Redox Biol. 37, 101760. https://doi.org/10.1016/j.redox.2020.101760 (2020). · DOI
- Walter, P. & Ron, D. The unfolded protein response: from stress pathway to homeostatic regulation. Science 334, 1081–1086. https://doi.org/10.1126/science.1209038 (2011). · DOI
- Hrycay, E. G. & Bandiera, S. M. Involvement of cytochrome P450 in reactive oxygen species formation and cancer. Adv. Pharmacol. 74, 35–84. https://doi.org/10.1016/bs.apha.2015.03.003 (2015). · DOI
- McGettrick, A. F. & O’Neill, L. A. J. The role of HIF in immunity and inflammation. Cell Metab. 32, 524–536. https://doi.org/10.1016/j.cmet.2020.08.002 (2020). · DOI · Paper page
- Mikkelsen, S. U., Gillberg, L., Lykkesfeldt, J. & Grønbæk, K. The role of vitamin C in epigenetic cancer therapy. Free Radic. Biol. Med. 170, 179–193. https://doi.org/10.1016/j.freeradbiomed.2021.03.017 (2021). · DOI
- Berretta, M. et al. Multiple effects of ascorbic acid against chronic diseases: Updated evidence from preclinical and clinical studies. Antioxidants 9, 1182. https://doi.org/10.3390/antiox9121182 (2020). · DOI
- Homma, T. et al. Defective biosynthesis of ascorbic acid in Sod1-deficient mice results in lethal damage to lung tissue. Free Radic. Biol. Med. 162, 255–265. https://doi.org/10.1016/j.freeradbiomed.2020.10.023 (2021). · DOI
- Matsuoka, Y., Yamato, M., Yamasaki, T., Mito, F. & Yamada, K. Rapid and convenient detection of ascorbic acid using a fluorescent nitroxide switch. Free Radic. Biol. Med. 53, 2112–2118. https://doi.org/10.1016/j.freeradbiomed.2012.09.032 (2012). · DOI
- Osaki, T., Sugiyama, D., Magari, Y., Souri, M. & Ichinose, A. Rapid immunochromatographic test for detection of anti-factor XIII A subunit antibodies can diagnose 90 % of cases with autoimmune haemorrhaphilia XIII/13. Thromb. Haemost. 113, 1347–1356. https://doi.org/10.1160/TH14-09-0745 (2015). · DOI
- Homma, T., Fujiwara, H., Osaki, T., Fujii, S. & Fujii, J. Consequences of a peroxiredoxin 4 (Prdx4) deficiency on learning and memory in mice. Biochem. Biophys. Res. Commun. 621, 32–38. https://doi.org/10.1016/j.bbrc.2022.06.096 (2022). · DOI
- Kobayashi, S. et al. Carnosine dipeptidase II (CNDP2) protects cells under cysteine insufficiency by hydrolyzing glutathione-related peptides. Free Radic. Biol. Med. 174, 12–27. https://doi.org/10.1016/j.freeradbiomed.2021.07.036 (2021). · DOI
- Okuda, S. et al. jPOSTrepo: An international standard data repository for proteomes. Nucleic Acids Res. 45, D1107–D1111. https://doi.org/10.1093/nar/gkw1080 (2017). · DOI
Metadata
- Authors
- Osaki, T., Homma, T., Maeda, Y., Yamada, K.-I., Yokoyama, C., Toyokuni, S., & Fujii, J.
- Affiliations
- Yamagata University (JP)
- Nagoya University (JP)
- Kyushu University (JP)
- Osaka Metropolitan University (JP)
- Center for Low-temperature Plasma Sciences, Nagoya University (JP)
- Corresponding author
- Osaki, Tsukasa
- Venue
- Scientific Reports
- Published
- 2025-12-22
- Volume
- 15
- Issue
- 1
- Pages
- 44312-44312
- ISSN
- 2045-2322 (ISSN-L)
- PMC
- PMC12722311
- OpenAlex
- W7116748878
- Cited by
- 0
- References
- 6
- FWCI
- 0.00
- Type
- journal article
- Language
- en
- Open access
- gold
- doi.org
- Licence
- Locations
- Scientific Reports (publishedVersion, cc-by-nc-nd)
- Research Square (acceptedVersion, cc-by)
- PubMed (publishedVersion)
- PubMed Central (publishedVersion, cc-by-nc-nd)
- DOAJ (DOAJ: Directory of Open Access Journals) (submittedVersion, cc-by-sa)
- Funders
- Japan Society for the Promotion of Science (KAKENHI (23K06410), KAKENHI (JP19H05462), KAKENHI (24K10074))
- Japan Science and Technology Agency (CREST (JPMJCR19H4))
- Yamagata University (YU-COE program (S6))
- Topics
- Life Sciences › Biochemistry, Genetics and Molecular Biology › Molecular Biology › Cancer and biochemical research
- Health Sciences › Medicine › Biochemistry (medical) › Antioxidant Activity and Oxidative Stress
- Life Sciences › Biochemistry, Genetics and Molecular Biology › Molecular Biology › Redox biology and oxidative stress
- Keywords
- L-ascorbate, nonalcoholic steatohepatitis, hepatocarcinogenesis, hepatocellular carcinoma, superoxide dismutase 1, peroxiredoxin 4, oxidative stress, endoplasmic reticulum stress, amino acid metabolism, iron metabolism, aconitase, iron regulatory proteins, ferroptosis, precancerous lesions, hepatic steatosis, vitamin C supplementation
- MeSH terms
- Superoxide Dismutase-1, Animals, Ascorbic Acid, Carcinoma, Hepatocellular, Liver, Liver Neoplasms, Male, Mice, Knockout, Oxidative Stress, Mice, Peroxiredoxins, Endoplasmic Reticulum Stress, Carcinogenesis, Non-alcoholic Fatty Liver Disease
About these checks
Registry, retraction, Cites and statistics results are computed, not judged, with one exception: a printed reference that no index lists is read once by a model before it counts as a citation error. Claims are extracted by a model and kept only when their quote appears verbatim in the text; each cited source is then checked, with a model’s help, for whether it says what the claim relies on. Those verdicts can be wrong — read the claim’s quote and the cited source before relying on one.
Statistics and arithmetic are recomputed, not judged.
Confidence bands are shown only for fields calibrated on our annotated test set. None is calibrated yet, so no band is shown.
What counts as a claim ›How we measure confidence ›How we check this ›
Are you an author, or do you see a problem with this page? Request a review
