

The DOI matches its Crossref record; 40 of the 40 references it cites were found in a registry or an index.
A combined approach for single-cell mRNA and intracellular protein expression analysis
Open accessAbstract
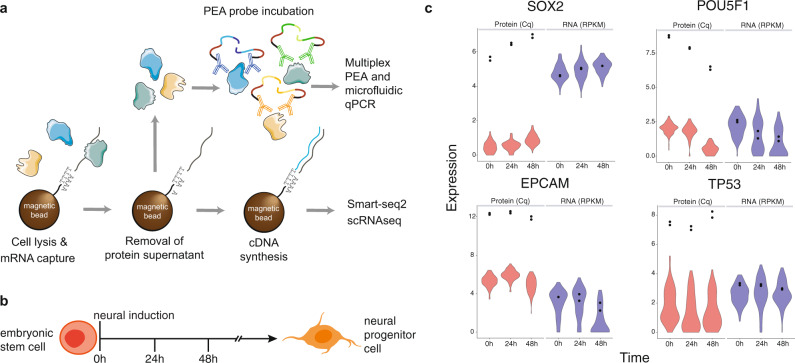
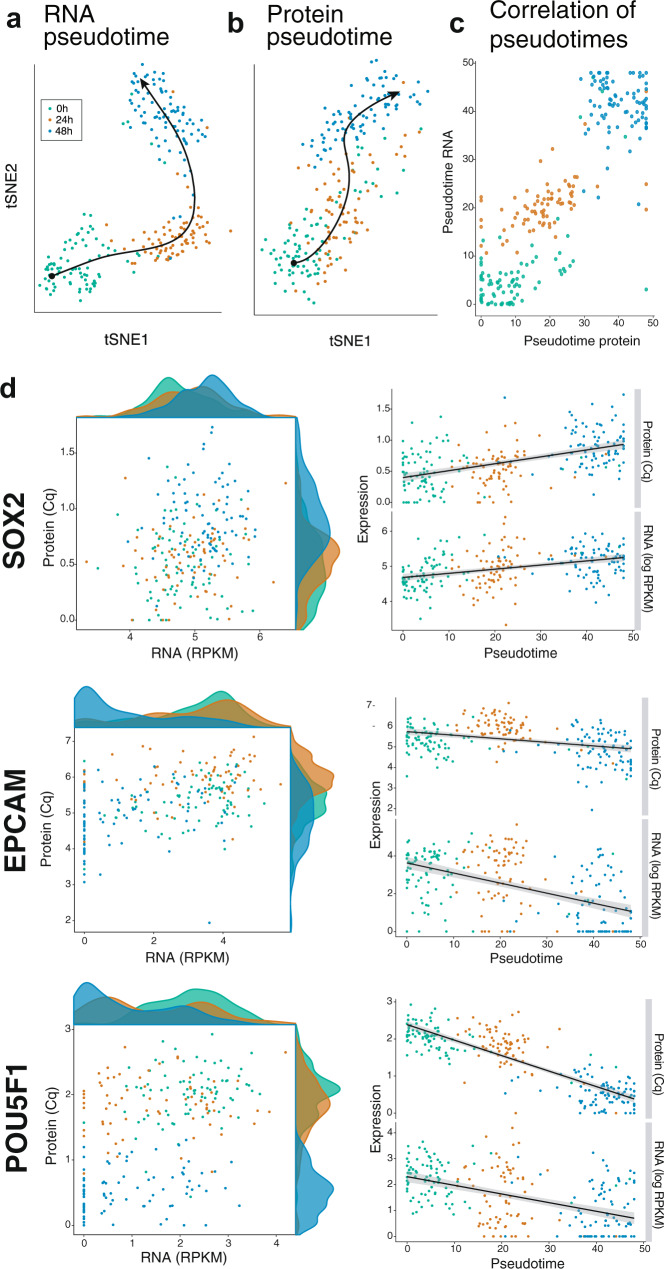
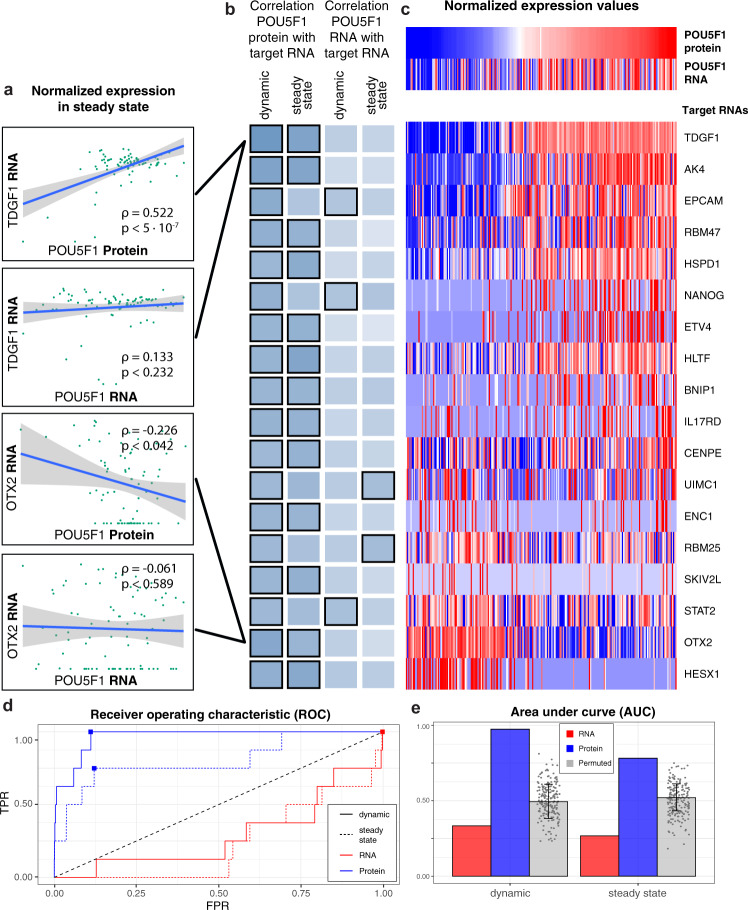
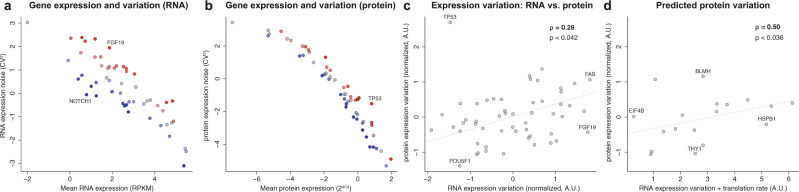
Combined measurements of mRNA and protein expression in single cells enable in-depth analysis of cellular states. We present SPARC, an approach that combines single-cell RNA-sequencing with proximity extension essays to simultaneously measure global mRNA and 89 intracellular proteins in individual cells. We show that mRNA expression fails to accurately reflect protein abundance at the time of measurement, although the direction of changes is in agreement during neuronal differentiation. Moreover, protein levels of transcription factors better predict their downstream effects than do their corresponding transcripts. Finally, we highlight that protein expression variation is overall lower than mRNA variation, but relative protein variation does not reflect the mRNA level. Our results demonstrate that mRNA and protein measurements in single cells provide different and complementary information regarding cell states. SPARC presents a state-of-the-art co-profiling method that overcomes current limitations in throughput and protein localization, including removing the need for cell fixation.
Overview
The claims and statistics of this paper haven’t been checked yet.
Run the check — free, no account needed. It reads the open-access text and checks the sources it cites.
Integrity signals
Registry
Cites
Statistics
Figures
Verification
Claims the paper makes
The claims and statistics of this paper haven’t been checked yet.
Run the check — free, no account needed. It reads the open-access text and checks the sources it cites.
Claims other papers make about this one
Each is checked against this paper’s own text: does it say what the citing paper says it does?
The cited source says what the claim attributes to it.
In the citing paper
“For example, mRNA abundance from transcriptomics alone is insufficient to infer protein abundance [Chen et al., 2020; Reimegård et al., 2021]”
From Cell signaling pathways discovery from multi-modal data (2025) · cites this paper as Reimegård et al., 2021
Self-check
Percentages, sums and reported differences re-computed from the paper’s own numbers.
The self-check needs the paper’s full text.
Citations
Cites
Enrichr: a comprehensive gene set enrichment analysis web server 2016 update
Kuleshov, M. V., Jones, M. R., Rouillard, A. D., Fernandez, N. F., Duan, Q., Wang, Z., Koplev, S., Jenkins, S. L., Jagodnik, K. M., Lachmann, A., et al. (2016) · Nucleic Acids Research · doi:10.1093/nar/gkw377 · Cited by 10,799
Global quantification of mammalian gene expression control
Schwanhäusser, B., Busse, D., Li, N., Dittmar, G., Schuchhardt, J., Wolf, J., Chen, W., & Selbach, M. (2011) · Nature · doi:10.1038/nature10098 · Cited by 6,566 · cited 1×
“05); and (2) reported as bound by POU5F1 in vicinity of the TSS by the curated set of ChIP-seq data described in the section below.”
BackgroundScenic: single-cell regulatory network inference and clustering.
Aibar, S., González-Blas, C. B., Moerman, T., Huynh-Thu, V. A., Imrichova, H., Hulselmans, G., Rambow, F., Marine, J.-C., Geurts, P., Aerts, J., et al. (2017) · Nature Methods · doi:10.1038/nmeth.4463 · Cited by 6,520
La Manno, G., Soldatov, R., Zeisel, A., Braun, E., Hochgerner, H., Petukhov, V., Lidschreiber, K., Kastriti, M. E., Lönnerberg, P., Furlan, A., et al. (2018) · Nature · doi:10.1038/s41586-018-0414-6 · Cited by 4,118
On the Dependency of Cellular Protein Levels on mRNA Abundance
Liu, Y., Beyer, A., & Aebersold, R. (2016) · Cell · doi:10.1016/j.cell.2016.03.014 · Cited by 3,221
Simultaneous epitope and transcriptome measurement in single cells
Stoeckius, M., Hafemeister, C., Stephenson, W., Houck-Loomis, B., Chattopadhyay, P. K., Swerdlow, H., Satija, R., & Smibert, P. (2017) · Nature Methods · doi:10.1038/nmeth.4380 · Cited by 3,098
Nature, Nurture, or Chance: Stochastic Gene Expression and Its Consequences
Raj, A., & van Oudenaarden, A. (2008) · Cell · doi:10.1016/j.cell.2008.09.050 · Cited by 2,593
Smart-seq2 for sensitive full-length transcriptome profiling in single cells
Picelli, S., Björklund, Å. K., Faridani, O. R., Sagasser, S., Winberg, G., & Sandberg, R. (2013) · Nature Methods · doi:10.1038/nmeth.2639 · Cited by 2,358
Assarsson, E., Lundberg, M., Holmquist, G., Björkesten, J., Bucht Thorsen, S., Ekman, D., Eriksson, A., Rennel Dickens, E., Ohlsson, S., Edfeldt, G., et al. (2014) · PLoS ONE · doi:10.1371/journal.pone.0095192 · Cited by 1,874
Stochastic mRNA Synthesis in Mammalian Cells
Raj, A., Peskin, C. S., Tranchina, D., Vargas, D. Y., & Tyagi, S. (2006) · PLoS Biology · doi:10.1371/journal.pbio.0040309 · Cited by 1,737
Cited by
Sorted by citations
Methods and applications for single-cell and spatial multi-omics
Vandereyken, K., Sifrim, A., Thienpont, B., & Voet, T. (2023) · Nature Reviews Genetics · doi:10.1038/s41576-023-00580-2 · Cited by 1,244
Single-cell proteomics enabled by next-generation sequencing or mass spectrometry
Bennett, H. M., Stephenson, W., Rose, C. M., & Darmanis, S. (2023) · Nature Methods · doi:10.1038/s41592-023-01791-5 · Cited by 351
Proteomics technologies for cancer liquid biopsies
Ding, Z., Wang, N., Ji, N., & Chen, Z. (2022) · Molecular Cancer · doi:10.1186/s12943-022-01526-8 · Cited by 260
Advances in single-cell omics and multiomics for high-resolution molecular profiling
Lim, J., Park, C., Kim, M., Kim, H., Kim, J., & Lee, D.-S. (2024) · Experimental & Molecular Medicine · doi:10.1038/s12276-024-01186-2 · Cited by 193
Joint single-cell measurements of nuclear proteins and RNA in vivo
Chung, H., Parkhurst, C. N., Magee, E. M., Phillips, D., Habibi, E., Chen, F., Yeung, B. Z., Waldman, J., Artis, D., & Regev, A. (2021) · Nature Methods · doi:10.1038/s41592-021-01278-1 · Cited by 144
Metadata
- Authors
- Reimegård, J., Tarbier, M., Danielsson, M., Schuster, J., Baskaran, S., Panagiotou, S., Dahl, N., Friedländer, M. R., & Gallant, C. J.
- Affiliations
- Uppsala University (SE)
- Stockholm University (SE)
- Corresponding author
- Gallant, Caroline J.
- ORCID
- Venue
- Communications Biology
- Published
- 2021-05-25
- Volume
- 4
- Issue
- 1
- Pages
- 624-624
- ISSN
- 2399-3642 (ISSN-L)
- PMC
- PMC8149646
- OpenAlex
- W3164706810
- Cited by
- 129
- References
- 39
- Citations by year
- 2026: 25 · 2025: 26 · 2024: 22 · 2023: 23 · 2022: 28 · 2021: 5
- FWCI
- 6.12
- Type
- journal article
- Language
- en
- Open access
- gold
- doi.org
- Locations
- Communications Biology (publishedVersion, cc-by)
- PubMed Central (publishedVersion, cc-by)
- PubMed (publishedVersion)
- Uppsala University Publications (Uppsala University) (submittedVersion, other-oa)
- DOAJ (DOAJ: Directory of Open Access Journals) (submittedVersion, cc-by-sa)
- Funders
- Vetenskapsrådet (2017-05229)
- Topics
- Life Sciences › Biochemistry, Genetics and Molecular Biology › Molecular Biology › Single-cell and spatial transcriptomics
- Life Sciences › Biochemistry, Genetics and Molecular Biology › Molecular Biology › RNA Research and Splicing
- Life Sciences › Biochemistry, Genetics and Molecular Biology › Molecular Biology › Gene Regulatory Network Analysis
- Keywords
- single-cell transcriptomics, single-cell proteomics, proximity extension assay, SPARC, intracellular protein expression, neuronal differentiation, transcription factor activity, mRNA-protein correlation, protein localization
- MeSH terms
- Humans, Proteins, RNA, Messenger, Transcription, Genetic, Sequence Analysis, RNA, Gene Expression Profiling, Proteomics, Single-Cell Analysis
About these checks
Registry, retraction, Cites and statistics results are computed, not judged, with one exception: a printed reference that no index lists is read once by a model before it counts as a citation error. Claims are extracted by a model and kept only when their quote appears verbatim in the text; each cited source is then checked, with a model’s help, for whether it says what the claim relies on. Those verdicts can be wrong — read the claim’s quote and the cited source before relying on one.
Statistics and arithmetic are recomputed, not judged.
Confidence bands are shown only for fields calibrated on our annotated test set. None is calibrated yet, so no band is shown.
What counts as a claim ›How we measure confidence ›How we check this ›
Are you an author, or do you see a problem with this page? Request a review
