

The DOI matches its Crossref record; 4 of the 4 references it cites were found in a registry or an index.
Multivariate information theory uncovers synergistic subsystems of the human cerebral cortex
Abstract
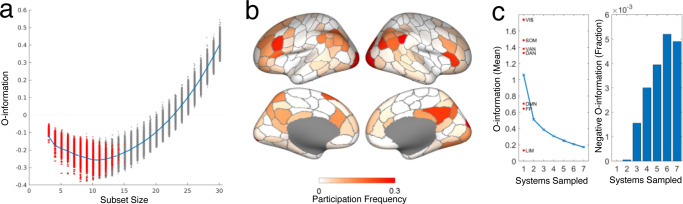
One of the most well-established tools for modeling the brain is the functional connectivity network, which is constructed from pairs of interacting brain regions. While powerful, the network model is limited by the restriction that only pairwise dependencies are considered and potentially higher-order structures are missed. Here, we explore how multivariate information theory reveals higher-order dependencies in the human brain. We begin with a mathematical analysis of the O-information, showing analytically and numerically how it is related to previously established information theoretic measures of complexity. We then apply the O-information to brain data, showing that synergistic subsystems are widespread in the human brain. Highly synergistic subsystems typically sit between canonical functional networks, and may serve an integrative role. We then use simulated annealing to find maximally synergistic subsystems, finding that such systems typically comprise ≈10 brain regions, recruited from multiple canonical brain systems. Though ubiquitous, highly synergistic subsystems are invisible when considering pairwise functional connectivity, suggesting that higher-order dependencies form a kind of shadow structure that has been unrecognized by established network-based analyses. We assert that higher-order interactions in the brain represent an under-explored space that, accessible with tools of multivariate information theory, may offer novel scientific insights.
Overview
The claims and statistics of this paper haven’t been checked yet.
Run the check — free, no account needed. It reads the open-access text and checks the sources it cites.
Integrity signals
Registry
Cites
Statistics
Figures
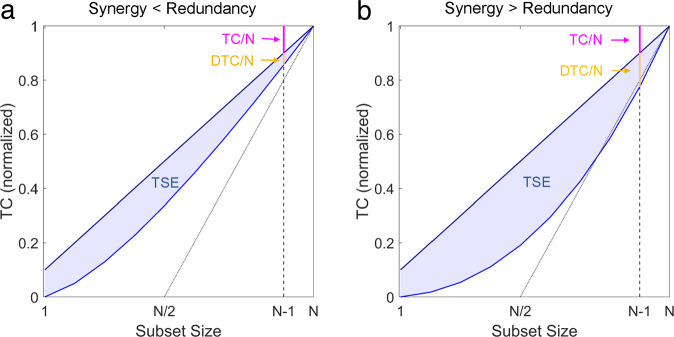
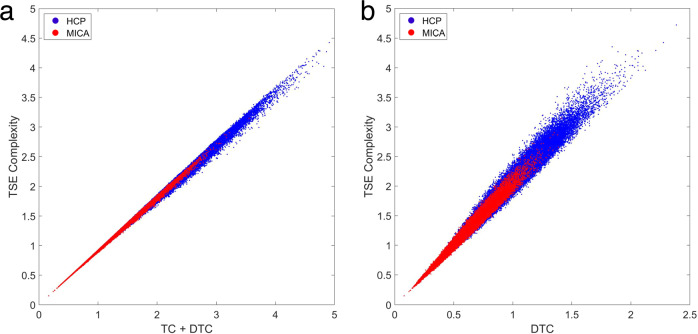
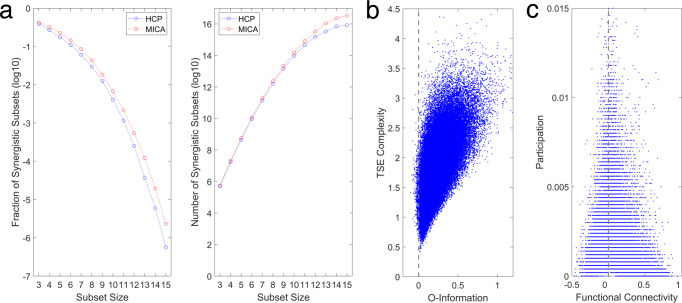
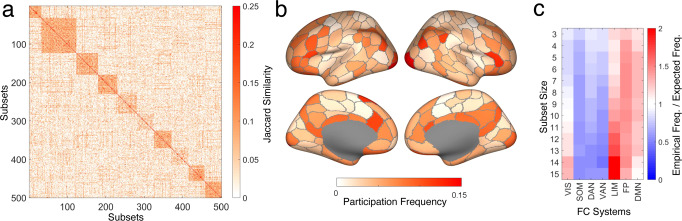
Verification
Claims the paper makes
The claims and statistics of this paper haven’t been checked yet.
Run the check — free, no account needed. It reads the open-access text and checks the sources it cites.
Claims other papers make about this one
Each is checked against this paper’s own text: does it say what the citing paper says it does?
In the citing paper
“our analyses of real fMRI recordings with Gaussian PID confirm that previous reports of synergy in cross-area brain interactions are genuine and not due to biased estimates”
From Sampling bias corrections for discrete and Gaussian partial information decompositions (2026) · cites this paper as [99]
Self-check
Percentages, sums and reported differences re-computed from the paper’s own numbers.
The self-check needs the paper’s full text.
Citations
Cites
Breakdown of cortical effective connectivity during sleep
Massimini, M., Ferrarelli, F., Huber, R., Esser, S. K., Singh, H., & Tononi, G. (2005) · Science · doi:10.1126/science.1117256 · Cited by 1,534
Rethinking segregation and integration: contributions of whole-brain modelling
Deco, G., Tononi, G., Boly, M., & Kringelbach, M. L. (2015) · Nature reviews. Neuroscience · doi:10.1038/nrn3963 · Cited by 658
Towards a new approach to reveal dynamical organization of the brain using topological data analysis
Saggar, M., Sporns, O., Gonzalez-Castillo, J., Bandettini, P. A., Carlsson, G., Glover, G., & Reiss, A. L. (2018) · Nature Communications · doi:10.1038/s41467-018-03664-4 · Cited by 253
Self-citationConsciousness and complexity: a consilience of evidence
Sarasso, S., Casali, A. G., Casarotto, S., Rosanova, M., Sinigaglia, C., & Massimini, M. (2021) · Neuroscience of Consciousness · doi:10.1093/nc/niab023 · Cited by 171
Research works printed but not linked: 90
- Barabási, A. L., Pósfai, M. Network Science (Cambridge University Press, 2016).
- Menczer, F., Fortunato, S. & Davis, C. A. A First Course in Network Science (Cambridge University Press, 2020). · DOI
- Sporns, O. & Kötter, R. Motifs in brain networks. PLOS Biol. 2, e369 (2004). · DOI
- Watts, D. J. & Strogatz, S. H. Collective dynamics of ‘small-world’ networks. Nature 393, 440–442 (1998). · DOI · Paper page
- Fortunato, S. Community detection in graphs. Phys. Rep. 486, 75–174 (2010). · DOI · Paper page
- Betzel, R. F. Community detection in network neuroscience. https://arxiv.org/abs/2011.06723 (2020). · arXiv
- Battiston, F. et al. Networks beyond pairwise interactions: structure and dynamics. Phys. Rep. 874, 1–92 (2020). · DOI
- Battiston, F. et al. The physics of higher-order interactions in complex systems. Nat. Phys. 17, 1093–1098 (2021) · DOI
- Tononi, G., Sporns, O. & Edelman, G. M. A measure for brain complexity: relating functional segregation and integration in the nervous system. Proc. Natl Acad. Sci. USA 91, 5033–5037 (1994). · DOI · Paper page
- Tononi, G., Edelman, G. M. & Sporns, O. Complexity and coherency: integrating information in the brain. Trends Cogn. Sci. 2, 474–484 (1998). · DOI
- Tononi, G. & Edelman, G. M. Schizophrenia and the mechanisms of conscious integration. Brain Res. Rev. 31, 391–400 (2000). · DOI
- Timme, N. M. et al. High-degree neurons feed cortical computations. PLOS Comput. Biol. 12, e1004858 (2016). · DOI
- Faber, S. P., Timme, N. M., Beggs, J. M. & Newman, E. L. Computation is concentrated in rich clubs of local cortical networks. Netw. Neurosci. 3, 1–21 (2018).
- Sherrill, S. P., Timme, N. M., Beggs, J. M. & Newman, E. L. Partial information decomposition reveals that synergistic neural integration is greater downstream of recurrent information flow in organotypic cortical cultures. PLOS Comput. Biol. 17, e1009196 (2021). · DOI
- Sherrill, S. P., Timme, N. M., Beggs, J. M. & Newman, E. L. Correlated activity favors synergistic processing in local cortical networks in vitro at synaptically relevant timescales. Netw. Neurosci. 4, 678–697 (2020). · DOI
- Scagliarini, T., Marinazzo, D., Guo, Y., Stramaglia, S. & Rosas, F. E. Quantifying high-order interdependencies on individual patterns via the local O-information: theory and applications to music analysis. Phys. Rev. Res. 4, 013184 (2022). · DOI
- Varley, T. F., Sporns, O., Schaffelhofer, S., Scherberger, H. & Dann, B. Information-processing dynamics in neural networks of macaque cerebral cortex reflect cognitive state and behavior. Proc. Natl Acad. Scie. USA 120, e2207677120 (2023). · DOI
- Rosas, F. E. et al. Reconciling emergences: an information-theoretic approach to identify causal emergence in multivariate data. PLOS Comput. Biol. 16, e1008289 (2020). · DOI
- Varley, T., Sporns, O., Puce, A. & Beggs, J. Differential effects of propofol and ketamine on critical brain dynamics. PLOS Comput. Biol. 16, e1008418 (2020). · DOI
- Luppi, A. I. et al. A synergistic workspace for human consciousness revealed by integrated information Decomposition. https://doi.org/10.1101/2020.11.25.398081 (2020). · DOI
- Luppi, A. I. et al. A synergistic core for human brain evolution and cognition. Nat. Neurosci. 25, 771–782 (2022). · DOI · Paper page
- Gatica, M. et al. High-order interdependencies in the aging brain. Brain Connect. 1, 734–744 (2021). · DOI
- Luppi, A. I. et al. What it is like to be a bit: an integrated information decomposition account of emergent mental phenomena. Neurosci. Conscious. 2021, niab027 (2021). · DOI
- Rosas, F., Mediano, P. A. M., Gastpar, M. & Jensen, H. J. Quantifying high-order interdependencies via multivariate extensions of the mutual information. Phys. Rev. E 100, 032305 (2019). · DOI
- Lizier, J. T., Flecker, B. & Williams, P. L. Towards a synergy-based approach to measuring information modification. https://arxiv.org/abs/1303.3440 (2013). · DOI
- Newman, E. L., Varley, T. F., Parakkattu, V. K., Sherrill, S. P. & Beggs, J. M. Revealing the dynamics of neural information processing with multivariate information decomposition. Entropy 24, 930 (2022). · DOI
- Williams, P. L. & Beer, R. D. Nonnegative decomposition of multivariate information. https://arxiv.org/abs/1004.2515 (2010). · arXiv
- Gutknecht, A. J., Wibral, M. & Makkeh, A. Bits and pieces: understanding information decomposition from part-whole relationships and formal logic. Proc. R Soc. A Math. Phys. Eng. Sci. 477, 20210110 (2021). · DOI
- Kolchinsky, A. A novel approach to the partial information decomposition. Entropy 24, 403 (2022). · DOI
- Kay, J. W., Schulz, J. M. & Phillips, W. A. A comparison of partial information decompositions using data from real and simulated layer 5b pyramidal cells. Entropy 24, 1021 (2022). · DOI
- James, R. G., Ellison, C. J. & Crutchfield, J. P. Anatomy of a bit: information in a time series observation. Chaos: Interdiscip. J. Nonlinear Sci. 21, 037109 (2011). · DOI
- Shine, J. M. Neuromodulatory influences on integration and segregation in the brain. Trends Cogn. Sci. 23, 572–583 (2019). · DOI
- Casali, A. G. et al. A theoretically based index of consciousness independent of sensory processing and behavior. Sci. Transl. Med. 5, 198ra105–198ra105 (2013). · DOI · Paper page
- Luppi, A. I. et al. Consciousness-specific dynamic interactions of brain integration and functional diversity. Nat. Commun. 10, 1–12 (2019). · DOI · Paper page
- Luppi, A. I. et al. LSD alters dynamic integration and segregation in the human brain. NeuroImage 227, 117653 (2021). · DOI
- McGhee, G. R. Theoretical morphology: the concept and its applications. Short. Courses Paleontol. 4, 87–102 (1991). · DOI
- Avena-Koenigsberger, A., Goñi, J., Solé, R. & Sporns, O. Network morphospace. J. R. Soc. Interface 12, 20140881 (2015). · DOI
- Varley, T. F., Denny, V., Sporns, O. & Patania, A. Topological analysis of differential effects of ketamine and propofol anaesthesia on brain dynamics. R. Soc. Open Sci. 8, 201971 (2021). · DOI
- Cover, T. M. & Thomas, J. A. Elements of Information Theory (Wiley, 2012).
- Shannon, C. E. A mathematical theory of communication. Bell Syst. Tech. J. 27, 379–423 (1948). · DOI · Paper page
- Friston, K. J. Functional and effective connectivity in neuroimaging: a synthesis. Hum. Brain Mapp. 2, 56–78 (1994). · DOI · Paper page
- van Diessen, E. et al. Opportunities and methodological challenges in EEG and MEG resting state functional brain network research. Clin. Neurophysiol. 126, 1468–1481 (2015). · DOI · Paper page
- Ursino, M., Ricci, G., Magosso, E. Transfer entropy as a measure of brain connectivity: a critical analysis with the help of neural mass models. Front. Comput. Neurosci. 14, 45 (2020). · DOI
- Barnett, L., Muthukumaraswamy, S. D., Carhart-Harris, R. L. & Seth, A. K. Decreased directed functional connectivity in the psychedelic state. NeuroImage 209, 116462 (2020). · DOI
- Fornito, A., Zalesky, A., Bullmore, E. Fundamentals of Brain Network Analysis (Academic Press, 2016).
- Sporns, O. Networks of the Brain (The MIT Press, 2010). · DOI
- Abdallah, S. A. & Plumbley, M. D. A measure of statistical complexity based on predictive information with application to finite spin systems. Phys. Lett. A 376, 275–281 (2012). · DOI
- Williams, P. L. & Beer, R. D. Generalized measures of information transfer. https://arxiv.org/abs/1102.1507 (2011). · arXiv
- Stramaglia, S., Scagliarini, T., Daniels, B. C. & Marinazzo, D. Quantifying dynamical high-order interdependencies from the O-information: an application to neural spiking dynamics. Front. Physiol. 11, 595736 (2021). · DOI
- Sporns, O., Tononi, G. & Edelman, G. M. Theoretical neuroanatomy and the connectivity of the cerebral cortex. Behav. Brain Res. 135, 69–74 (2002). · DOI
- Ay, N., Olbrich, E., Bertschinger, N. & Jost, J. A unifying framework for complexity measures of finite systems. ECCS’06 : Proceedings of the European Conference on Complex Systems 2006. (2006).
- Scagliarini, T. et al. Gradients of O-information: low-order descriptors of high-order dependencies. http://arxiv.org/abs/2207.03581 (2022). · arXiv
- Van Essen, D. C. et al. The WU-Minn human connectome project: an overview. NeuroImage 80, 62–79 (2013). · DOI · Paper page
- Royer, J. et al. An open MRI dataset for multiscale neuroscience. Sci. Data 9, 569 (2021). · DOI
- Schaefer, A. et al. Local-global parcellation of the human cerebral cortex from intrinsic functional connectivity MRI. Cereb. Cortex 28, 3095–3114 (2018). · DOI · Paper page
- Colenbier, N. et al. Disambiguating the role of blood flow and global signal with partial information decomposition. NeuroImage 213, 116699 (2020). · DOI
- Yeo, B. T. et al. The organization of the human cerebral cortex estimated by intrinsic functional connectivity. J. Neurophysiol. 106, 1125–1165 (2011). · DOI · Paper page
- Griffith, V. & Harel, J. Irreducibility is minimum synergy among parts. https://arxiv.org/abs/1311.7442 (2013). · arXiv
- Santoro, A., Battiston, F., Petri, G., & Amico, E. Higher-order organization of multivariate time series. Nat. Phys. 19, 221–229(2023). · DOI
- Zamani Esfahlani, F. et al. High-amplitude cofluctuations in cortical activity drive functional connectivity. Proc. Natl Acad. Sci. USA 117, 28393–28401 (2020). · DOI
- Faskowitz, J., Esfahlani, F. Z., Jo, Y., Sporns, O. & Betzel, R. F. Edge-centric functional network representations of human cerebral cortex reveal overlapping system-level architecture. Nat. Neurosci. 23, 1644–1654 (2020). · DOI
- Betzel, R. F., Cutts, S. A., Greenwell, S., Faskowitz, J. & Sporns, O. Individualized event structure drives individual differences in whole-brain functional connectivity. NeuroImage 252, 118993 (2022). · DOI
- Varley, T. F., Pope, M., Puxeddu, M. G., Faskowitz, J. & Sporns, O. Partial entropy decomposition reveals higher-order structures in human brain activity. http://arxiv.org/abs/2301.05307 (2023). · DOI · Paper page
- Ince, R. A. A. The partial entropy decomposition: decomposing multivariate entropy and mutual information via pointwise common surprisal. https://arxiv.org/abs/1702.01591 (2017). · DOI
- Finn, C. & Lizier, J. T. Generalised measures of multivariate information content. Entropy 22, 216 (2020). · DOI
- Varley, T. F. Decomposing past and future: integrated information decomposition based on shared probability mass exclusions. https://arxiv.org/abs/2202.12992 (2022). · arXiv
- Timme, N. M. et al. Criticality maximizes complexity in neural tissue. Front. Physiol. 7, 425 (2016). · DOI
- Rosas, F. E. et al. Disentangling high-order mechanisms and high-order behaviours in complex systems. Nat. Phys. 18, 476–477 (2022). · DOI
- Varley, T. F. & Kaminski, P. Untangling Synergistic Effects of Intersecting Social Identities with Partial Information Decomposition. Entropy 24, 1387 (2022). · DOI
- Sizemore, A. E., Phillips-Cremins, J., Ghrist, R. & Bassett, D. S. The importance of the whole: topological data analysis for the network neuroscientist. Netw. Neurosci. 3, 656–673 (2019). · DOI
- Billings, J., Saggar, M., Hlinka, J., Keilholz, S. & Petri, G. Simplicial and topological descriptions of human brain dynamics. Netw. Neurosci. 5, 549–568 (2021).
- Stolz, B. J., Emerson, T., Nahkuri, S., Porter, M. A. & Harrington, H. A. Topological data analysis of task-based fMRI data from experiments on schizophrenia. J. Phys. Complex. 2, 035006 (2021). · DOI
- Varley, T. F. & Hoel, E. Emergence as the conversion of information: a unifying theory. Philos. Trans. R. Soc. A: Math., Phys. Eng. Sci. 380, 20210150 (2022). · DOI
- Wollstadt, P., Schmitt, S. & Wibral, M. A rigorous information-theoretic definition of redundancy and relevancy in feature selection based on partial information decomposition. https://arxiv.org/abs/2105.04187 (2021). · arXiv
- Novelli, L., Wollstadt, P., Mediano, P., Wibral, M. & Lizier, J. T. Large-scale directed network inference with multivariate transfer entropy and hierarchical statistical testing. Netw. Neurosci. 3, 827–847 (2019). · DOI
- Liu, T. T., Nalci, A. & Falahpour, M. The global signal in fMRI: nuisance or information? NeuroImage 150, 213–229 (2017). · DOI
- Novelli, L. & Razi, A. A mathematical perspective on edge-centric functional connectivity. http://arxiv.org/abs/2106.10631 (2021). · arXiv
- Lizier, J. T. JIDT: an information-theoretic toolkit for studying the dynamics of complex systems. https://arxiv.org/pdf/1408.3270.pdf (2014). · DOI
- Bossomaier, T., Barnett, L., Harré, M. & Lizier. J. T. An Introduction to Transfer Entropy: Information Flow in Complex Systems (Springer, 2016). · DOI
- Faes, L. et al. A new framework for the time- and frequency-domain assessment of high-order interactions in networks of random processes. IEEE Trans. Signal. Process. 70 (IEEE, 2022). · DOI
- Hlinkaa, J., Paluša, M., Vejmelkaa, M., Mantini, D. & Corbetta, M. Functional connectivity in resting-state fMRI: Is linear correlation sufficient? NeuroImage 54, 2218–2225 (2011). · DOI
- Liégeois, R., Yeo, B. T. T. & Van De Ville, D. Interpreting null models of resting-state functional MRI dynamics: not throwing the model out with the hypothesis. NeuroImage 243, 118518 (2021). · DOI
- Schulz, M. A. et al. Different scaling of linear models and deep learning in UKBiobank brain images versus machine-learning datasets. Nat. Commun. 11, 4238 (2020). · DOI · Paper page
- Barrett, A. B. Exploration of synergistic and redundant information sharing in static and dynamical Gaussian systems. Phys. Rev. E 91, 052802 (2015). · DOI
- Sporns, O., Faskowitz, J., Teixeira, A. S., Cutts, S. A. & Betzel, R. F. Dynamic expression of brain functional systems disclosed by fine-scale analysis of edge time series. Netw. Neurosci. 5, 405–433 (2021). · DOI
- Glasser, M. F. et al. The minimal preprocessing pipelines for the Human Connectome Project. NeuroImage 80, 105–124 (2013). · DOI · Paper page
- Robinson, E. C. et al. MSM: a new flexible framework for Multimodal Surface Matching. NeuroImage 100, 414–426 (2014). · DOI · Paper page
- Parkes, L., Fulcher, B., Yücel, M. & Fornito, A. An evaluation of the efficacy, reliability, and sensitivity of motion correction strategies for resting-state functional MRI. NeuroImage 171, 415–436 (2018). · DOI
- Cruces, R. R. et al. Micapipe: a pipeline for multimodal neuroimaging and connectome analysis. Neuroimage 263, 119612 (2022). · DOI
- Metropolis, N., Rosenbluth, A. W., Rosenbluth, M. N., Teller, A. H. & Teller, E. Equation of state calculations by fast computing machines. J. Chem. Phys. 21, 1087–1092 (1953). · DOI · Paper page
Cited by
Sorted by citations
The complex brain: connectivity, dynamics, information
Sporns, O. (2022) · Trends in Cognitive Sciences · doi:10.1016/j.tics.2022.08.002 · Cited by 94
Self-citationSampling bias corrections for discrete and Gaussian partial information decompositions
Lorenz, G. M., Engel, N. M., Koçillari, L., Celotto, M., Orsenigo, D., Curreli, S., Malerba, S. B., Engel, A. K., Kayser, C., Fellin, T., et al. (2026) · Patterns · doi:10.1016/j.patter.2026.101619 · Cited by 9
Metadata
- Authors
- Varley, T. F., Pope, M., Faskowitz, J., & Sporns, O.
- ORCID
- Varley, Thomas F.
- Venue
- Communications Biology
- Published
- 2023-04-24
- Volume
- 6
- Issue
- 1
- ISSN
- 2399-3642
- PMC
- PMC10125999
- Cited by
- 101
- References
- 4
- Language
- en
- Update notices
- correction (2023-06-07)
- Funders
- National Science Foundation (1735095)
About these checks
Registry, retraction, Cites and statistics results are computed, not judged, with one exception: a printed reference that no index lists is read once by a model before it counts as a citation error. Claims are extracted by a model and kept only when their quote appears verbatim in the text; each cited source is then checked, with a model’s help, for whether it says what the claim relies on. Those verdicts can be wrong — read the claim’s quote and the cited source before relying on one.
Statistics and arithmetic are recomputed, not judged.
Confidence bands are shown only for fields calibrated on our annotated test set. None is calibrated yet, so no band is shown.
What counts as a claim ›How we measure confidence ›How we check this ›
Are you an author, or do you see a problem with this page? Request a review
