

The DOI matches its Crossref record; 33 of the 33 references it cites were found in a registry or an index.
Predicting monoclonal antibody binding sequences from a sparse sampling of all possible sequences
Open accessPublished version of a preprint
Abstract
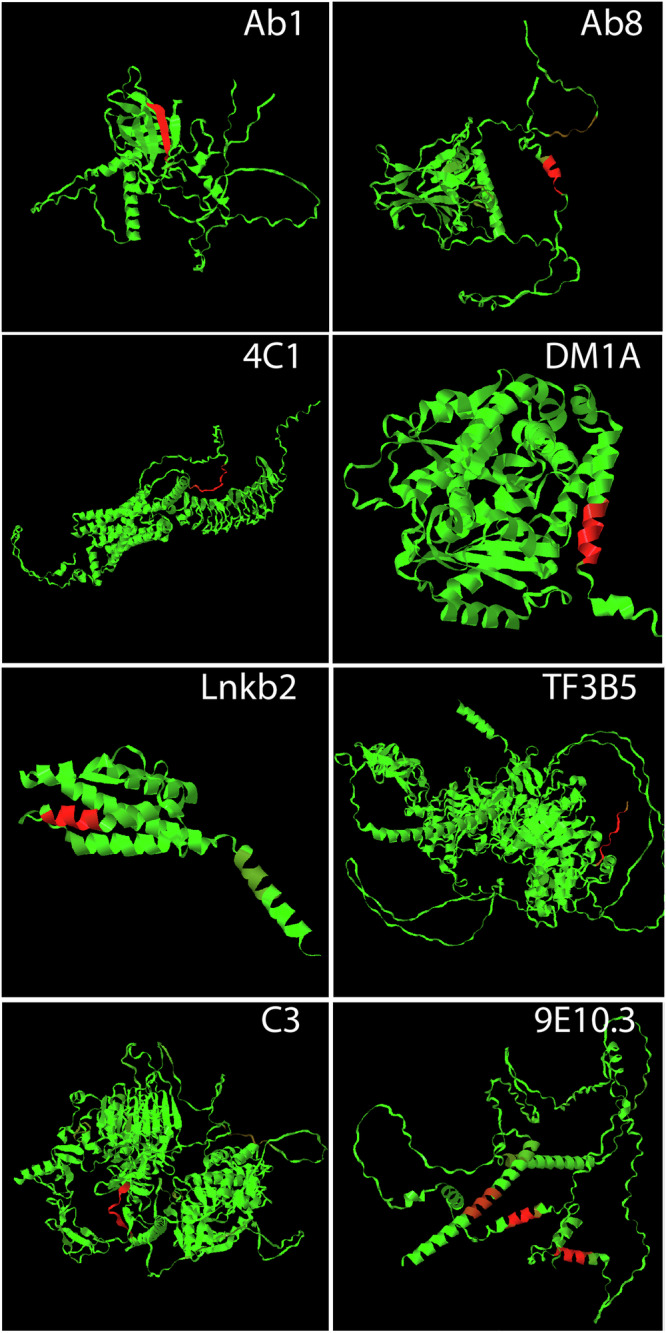
Previous work has shown that binding of target proteins to a sparse, unbiased sample of all possible peptide sequences is sufficient to train a machine learning model that can then predict, with statistically high accuracy, target binding to any possible peptide sequence of similar length. Here, highly sequence-specific molecular recognition is explored by measuring binding of 8 monoclonal antibodies (mAbs) with specific linear cognate epitopes to an array containing 121,715 near-random sequences about 10 residues in length. Network models trained on resulting sequence-binding values are used to predict the binding of each mAb to its cognate sequence and to an in silico generated one million random sequences. The model always ranks the binding of the cognate sequence in the top 100 sequences, and for 6 of the 8 mAbs, the cognate sequence ranks in the top ten. Practically, this approach has potential utility in selecting highly specific mAbs for therapeutics or diagnostics. More fundamentally, this demonstrates that very sparse random sampling of a large amino acid sequence spaces is sufficient to generate comprehensive models predictive of highly specific molecular recognition.
Overview
The claims and statistics of this paper haven’t been checked yet.
Run the check — free, no account needed. It reads the open-access text and checks the sources it cites.
Integrity signals
Registry
Cites
Statistics
Figures



Verification
Claims the paper makes
The claims and statistics of this paper haven’t been checked yet.
Run the check — free, no account needed. It reads the open-access text and checks the sources it cites.
Self-check
Percentages, sums and reported differences re-computed from the paper’s own numbers.
The self-check needs the paper’s full text.
Citations
Cites
Highly accurate protein structure prediction with AlphaFold
Jumper, J., Evans, R., Pritzel, A., Green, T., Figurnov, M., Ronneberger, O., Tunyasuvunakool, K., Bates, R., Žídek, A., Potapenko, A., et al. (2021) · Nature · doi:10.1038/s41586-021-03819-2 · Cited by 43,764
A survey on Image Data Augmentation for Deep Learning
Shorten, C., & Khoshgoftaar, T. M. (2019) · Journal of Big Data · doi:10.1186/s40537-019-0197-0 · Cited by 13,203
Atlas of Protein Sequence and Structure, 1966.
Hersh, R. T., Eck, R. V., & Dayhoff, M. O. (1967) · Systematic Zoology · doi:10.2307/2412074 · Cited by 1,779
Text Data Augmentation for Deep Learning
Shorten, C., Khoshgoftaar, T. M., & Furht, B. (2021) · Journal of Big Data · doi:10.1186/s40537-021-00492-0 · Cited by 1,740
Dickson, M. A., Hahn, W. C., Ino, Y., Ronfard, V., Wu, J. Y., Weinberg, R. A., Louis, D. N., Li, F. P., & Rheinwald, J. G. (2000) · Molecular and Cellular Biology · doi:10.1128/mcb.20.4.1436-1447.2000 · Cited by 1,104
The Immune Epitope Database and Analysis Resource in Epitope Discovery and Synthetic Vaccine Design
Fleri, W., Paul, S., Dhanda, S. K., Mahajan, S., Xu, X., Peters, B., & Sette, A. (2017) · Frontiers in Immunology · doi:10.3389/fimmu.2017.00278 · Cited by 500
An overview of bioinformatics tools for epitope prediction: Implications on vaccine development
Soria-Guerra, R. E., Nieto-Gomez, R., Govea-Alonso, D. O., & Rosales-Mendoza, S. (2015) · Journal of Biomedical Informatics · doi:10.1016/j.jbi.2014.11.003 · Cited by 445
Deep Dive into Machine Learning Models for Protein Engineering
Xu, Y., Verma, D., Sheridan, R. P., Liaw, A., Ma, J., Marshall, N. M., McIntosh, J., Sherer, E. C., Svetnik, V., & Johnston, J. M. (2020) · Journal of Chemical Information and Modeling · doi:10.1021/acs.jcim.0c00073 · Cited by 208
High-resolution Mapping of Linear Antibody Epitopes Using Ultrahigh-density Peptide Microarrays
Buus, S., Rockberg, J., Forsström, B., Nilsson, P., Uhlen, M., & Schafer-Nielsen, C. (2012) · Molecular & Cellular Proteomics · doi:10.1074/mcp.m112.020800 · Cited by 199
Catapano, A. L., & Papadopoulos, N. J. (2013) · Atherosclerosis · doi:10.1016/j.atherosclerosis.2013.01.044 · Cited by 160
Research works printed but not linked: 4
- Johnston, K. E. et al. Machine Learning for Protein Engineering. Preprint at https://arxiv.org/abs/2305.16634 (2023). · arXiv
- Reichert, J. M. Antibody Therapeutics Approved or in Regulatory Review in the EU or US. Antibody society, https://www.antibodysociety.org/resources/approved-antibodies/ (2023).
- SA, F. Chapter 4, Specificity and Cross-Reactivity. In Immunology and Evolution of Infectious Disease (Princeton University Press, 2002).
- Dayhoff, M. O. A model of evolutionary change in proteins. Atlas Protein Sequence Struct. 5, 89–99 (1972).
Metadata
- Authors
- Bisarad, P., Kelbauskas, L., Singh, A., Taguchi, A. T., Trenchevska, O., & Woodbury, N. W.
- Affiliations
- Barrow Neurological Institute (US)
- Arizona State University (US)
- Corresponding author
- Woodbury, Neal W.
- Venue
- Communications Biology
- Published
- 2024-08-12
- Volume
- 7
- Issue
- 1
- Pages
- 979-979
- ISSN
- 2399-3642 (ISSN-L)
- PMC
- PMC11319732
- OpenAlex
- W4401510896
- Cited by
- 5
- References
- 33
- Citations by year
- 2026: 1 · 2025: 2 · 2024: 2
- FWCI
- 0.68
- Type
- journal article
- Language
- en
- Open access
- gold
- doi.org
- Licence
- cc-by
- creativecommons.org/licenses/by/4.0 (tdm)
- creativecommons.org/licenses/by/4.0 (vor)
- Locations
- Communications Biology (publishedVersion, cc-by)
- Research Square (acceptedVersion, cc-by)
- PubMed Central (publishedVersion, cc-by)
- PubMed (publishedVersion)
- DOAJ (DOAJ: Directory of Open Access Journals) (submittedVersion)
- Funders
- Arizona State University (NA)
- Topics
- Life Sciences › Biochemistry, Genetics and Molecular Biology › Molecular Biology › vaccines and immunoinformatics approaches
- Life Sciences › Immunology and Microbiology › Immunology › Monoclonal and Polyclonal Antibodies Research
- Physical Sciences › Chemistry › Organic Chemistry › Chemical Synthesis and Analysis
- Keywords
- monoclonal antibodies, epitope prediction, network models, binding prediction, linear epitopes
- MeSH terms
- Machine Learning, Amino Acid Sequence, Antibodies, Monoclonal, Epitopes, Binding Sites, Antibody, Computer Simulation, Humans, Protein Binding
About these checks
Registry, retraction, Cites and statistics results are computed, not judged, with one exception: a printed reference that no index lists is read once by a model before it counts as a citation error. Claims are extracted by a model and kept only when their quote appears verbatim in the text; each cited source is then checked, with a model’s help, for whether it says what the claim relies on. Those verdicts can be wrong — read the claim’s quote and the cited source before relying on one.
Statistics and arithmetic are recomputed, not judged.
Confidence bands are shown only for fields calibrated on our annotated test set. None is calibrated yet, so no band is shown.
What counts as a claim ›How we measure confidence ›How we check this ›
Are you an author, or do you see a problem with this page? Request a review
How to cite
Cite CoChat for the checks on this page, and the paper for its own findings.
- This page
- CoChat. (2026). Citation check: Predicting monoclonal antibody binding sequences from a sparse sampling of all possible sequences. https://app.cochat.ai/papers/10.1038/s42003-024-06650-3
- The paper
- Bisarad, P., Kelbauskas, L., Singh, A., Taguchi, A. T., Trenchevska, O., & Woodbury, N. W. (2024). Predicting monoclonal antibody binding sequences from a sparse sampling of all possible sequences. Communications Biology. https://doi.org/10.1038/s42003-024-06650-3
Data sources
Bibliographic data: Semantic Scholar, OpenAlex, Crossref.
Contains information from the Semantic Scholar Academic Graph Datasets, made available under the ODC Attribution License (ODC-BY 1.0).
Semantic Scholar’s data is described in: Kinney, R., et al. (2023). The Semantic Scholar Open Data Platform. arXiv:2301.10140.
