Student or educator? Sign up with your school email and get 6 months of Pro free.
Cited by 2Microtubule and mitosis dynamicsGenomics and Chromatin DynamicsProtein Structure and Dynamics

The DOI matches its Crossref record; 59 of the 59 references it cites were found in a registry or an index.

Insects evolved a monomeric histone-fold domain in the CENP-T protein family

Open access
Sankaranarayanan, Sundar Ram, Ulmer, Jonathan, Mørch, Anna, Ali-Ahmad, Ahmad, Sekulić, Nikolina, Drinnenberg, Ines Anna·2025·EMBO Reports

Published version of a preprint

Abstract

The histone-fold domain (HFD) is a conserved protein interaction module that requires stabilization through a handshake interaction with an HFD partner. All HFD proteins known to date form obligate dimers to shield the extensive hydrophobic residues along the HFD. Here, we find that the lepidopteran kinetochore protein CENP-T is soluble as a monomer. We attribute this stability to a structural rearrangement, which leads to the repositioning of the HFD helix α3. This brings a conserved two-helical extension closer to the histone fold, where it takes over the position and function of the CENP-T partner CENP-W. This change has no effect on the DNA-binding ability of the lepidopteran CENP-T. Our analysis suggests that the monomeric HFD originated in the last common ancestor of insects, with a possible second independent origin in Acariformes, both of which lack CENP-W. Our study highlights an unexpected structural variation in a protein module as conserved and optimized as the HFD, providing a unique perspective on the evolution of protein structure and the forces driving it.

Overview

The claims and statistics of this paper haven’t been checked yet.

Run the check — free, no account needed. It reads the open-access text and checks the sources it cites.

A few free checks a day · papers already verified open instantly · results are public

Integrity signals

Registry

Crossref · 10.1038/s44319-025-00603-5

Cites

59 of 59 references verified0 citation errors · 0 not checkable

Statistics

Figures

Image 1
CC BY · PubMed Central
Image 2
CC BY · PubMed Central
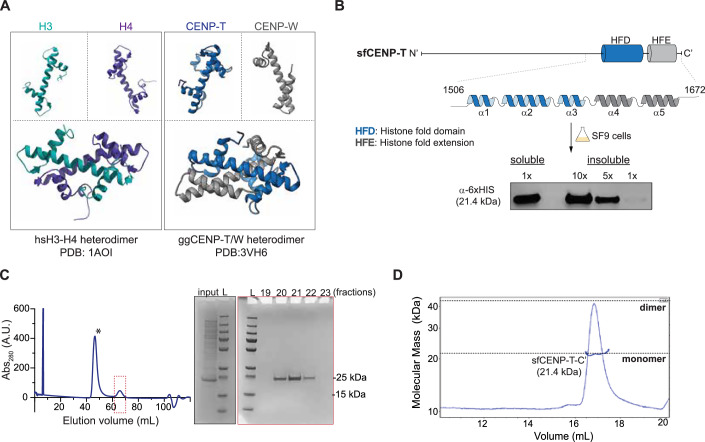
Figure 1 Lepidopteran CENP-T is a soluble monomeric protein. (A) The organization of helices of a canonical HFD monomer and their physiological heterodimeric state illustrated from the known structures of histones H3-H4 from humans (PDB: 1AO1) and CENP-TW from chicken (PDB:3vh6). (B) (Top) Line diagram of sfCENP-T with the relative positions of the histone-fold domain (HFD) and the histone fold extension (HFE) marked by blue and gray cylinders, respectively. The linear structure of each of these domains is expanded. (Bottom) Analysis of soluble and insoluble fractions of SF9 cells expressing the C-terminal fragment of 6xHis-sfCENP-T1147–1314 by western blot analysis. (C) The elute from the affinity purification step for 6xHis-sfCENP-T1147-1314 fragment was further purified to homogeneity by size-exclusion chromatography (SEC). The plot depicts the SEC elution profile with the x and y axes indicating elution volume and absorbance at 280 nm, respectively. The peak fractions marked by an asterisk and a dotted red box were visualized by SDS-PAGE stained with Coomassie Blue (also see Fig. EV1A). The analysis of the peak marked with the asterisk is presented in the expanded version in Fig. EV1A. Input: a fraction of the elute from the affinity purification step for 6xHis-sfCENP- T1147-1314 fragment loaded into the SEC column. L molecular weight marker. (D) Multi-angle Light Scattering coupled with SEC (SEC-MALS) of the 6xHis-sfCENP-T1147-1314 fragment reveals the monomeric state of the protein (21.2 kDa). The molecular weight inferred from MALS is represented as a blue line overlaid on the SEC peak for this protein. Source data are available online for this figure.
Figure 1 Lepidopteran CENP-T is a soluble monomeric protein. (A) The organization of helices of a canonical HFD monomer and their physiological heterodimeric state illustrated from the known structures of histones H3-H4 from humans (PDB: 1AO1) and CENP-TW from chicken (PDB:3vh6). (B) (Top) Line diagram of sfCENP-T with the relative positions of the histone-fold domain (HFD) and the histone fold extension (HFE) marked by blue and gray cylinders, respectively. The linear structure of each of these domains is expanded. (Bottom) Analysis of soluble and insoluble fractions of SF9 cells expressing the C-terminal fragment of 6xHis-sfCENP-T1147–1314 by western blot analysis. (C) The elute from the affinity purification step for 6xHis-sfCENP-T1147-1314 fragment was further purified to homogeneity by size-exclusion chromatography (SEC). The plot depicts the SEC elution profile with the x and y axes indicating elution volume and absorbance at 280 nm, respectively. The peak fractions marked by an asterisk and a dotted red box were visualized by SDS-PAGE stained with Coomassie Blue (also see Fig. EV1A). The analysis of the peak marked with the asterisk is presented in the expanded version in Fig. EV1A. Input: a fraction of the elute from the affinity purification step for 6xHis-sfCENP- T1147-1314 fragment loaded into the SEC column. L molecular weight marker. (D) Multi-angle Light Scattering coupled with SEC (SEC-MALS) of the 6xHis-sfCENP-T1147-1314 fragment reveals the monomeric state of the protein (21.2 kDa). The molecular weight inferred from MALS is represented as a blue line overlaid on the SEC peak for this protein. Source data are available online for this figure.CC BY · PubMed Central
Figure EV1 Solubility of lepidopteran histone fold in SF9 and E. coli cells. (A) An expanded view SEC profile and the corresponding SDS-PAGE analysis presented in Fig. 1C to highlight all the indicated fractions of 6xHis-sfCENP-T1147–1314 purification. The SDS page profile of the peak in red box from Fig. 1C is reused in this panel to compare with the contaminating proteins eluted in the peak boxed in blue. Input: a fraction of the sample loaded into the SEC column, L: molecular weight marker. (B) Western blot analysis of the soluble (S) and pellet (P) fractions of E. coli BL21 cells expressing 6xHis-bmCENP-T (16.2 kDa) and 6xHis-sfCENP-T (21.5 kDa) fragment with anti-His antibodies. L: molecular weight marker. (C) SEC-MALS analysis of bmCENP-T894–1016 fragment reveals the monomeric state of the protein. The molecular weight inferred from MALS (16.9 kDa) is represented as a blue line overlaid on the SEC peak for this protein. Source data are available online for this figure.
Figure EV1 Solubility of lepidopteran histone fold in SF9 and E. coli cells. (A) An expanded view SEC profile and the corresponding SDS-PAGE analysis presented in Fig. 1C to highlight all the indicated fractions of 6xHis-sfCENP-T1147–1314 purification. The SDS page profile of the peak in red box from Fig. 1C is reused in this panel to compare with the contaminating proteins eluted in the peak boxed in blue. Input: a fraction of the sample loaded into the SEC column, L: molecular weight marker. (B) Western blot analysis of the soluble (S) and pellet (P) fractions of E. coli BL21 cells expressing 6xHis-bmCENP-T (16.2 kDa) and 6xHis-sfCENP-T (21.5 kDa) fragment with anti-His antibodies. L: molecular weight marker. (C) SEC-MALS analysis of bmCENP-T894–1016 fragment reveals the monomeric state of the protein. The molecular weight inferred from MALS (16.9 kDa) is represented as a blue line overlaid on the SEC peak for this protein. Source data are available online for this figure.CC BY · PubMed Central
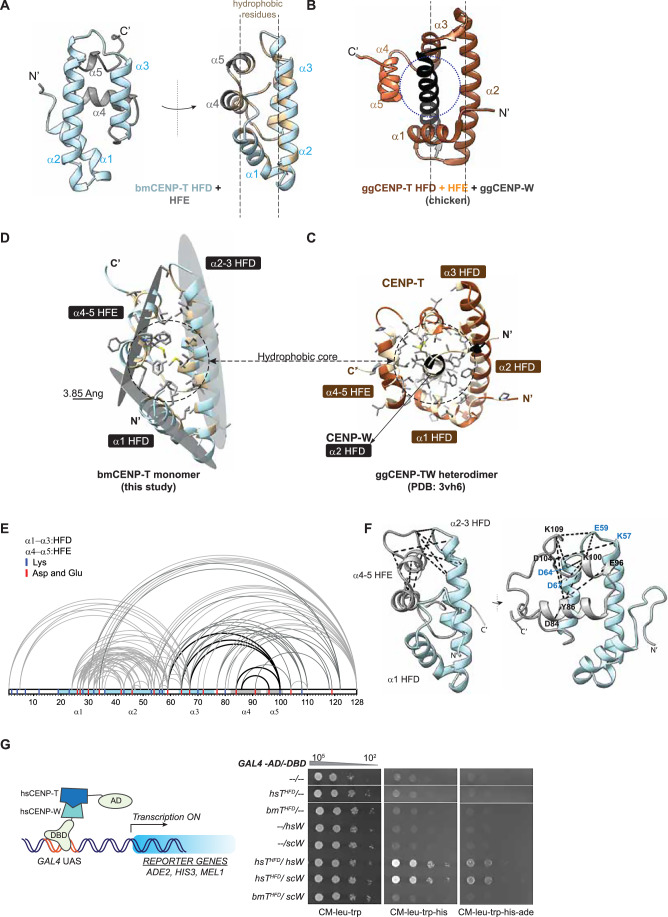
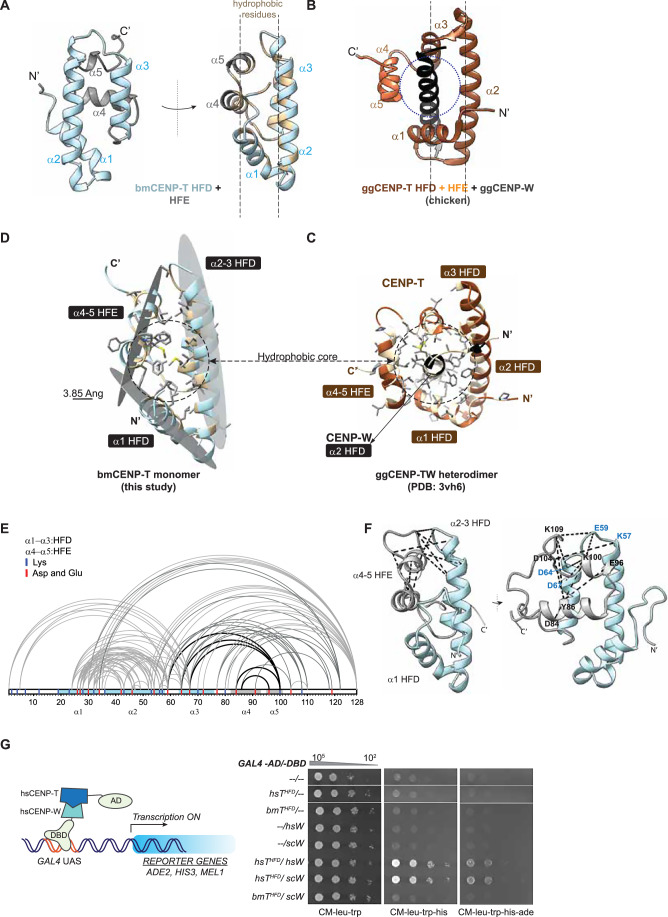
Figure 2 The monomeric histone fold and the repositioned extension occlude CENP-W and stabilize CENP-T as a monomer. (A) Front and side views of the bmCENP-T C-terminus containing the HFD and HFE as modeled by AlphaFold. Hydrophobic residues within this fragment are colored beige in the side view. The sequences upstream of the HFD in bmCENP-T were hidden in the model for clarity. (B) A comparative side view of ggCENP-TW heterodimer, highlighting the position of ggCENP-T-HFE relative to ggCENP-W and the ggCENP-T-HFD (dotted circle). For clarity, only the second helix of the ggCENP-W histone fold is shown in black. The images were adapted from PDB entry 3VH6 (Nishino et al, 2012). (C) Illustration of the proposed stabilization of bmCENP-T histone fold by hydrophobic residues present in the HFE. Three hydrophobic surfaces from α1, α2-3, and α4-5 are proposed to form a hydrophobic core. The hydrophobic residues and their side chains are colored as in (A). Scale bar, 3.85 Ang. (D) A tilted view of ggCENP–TW complex shown in (B) depicting the proximity of the side chains of hydrophobic residues from the helices of ggCENP-T and ggCENP-W. The hydrophobic residues are shaded beige in the backbone, and their side chains are represented as sticks in gray. (E, F) EDC-NHS crosslinking mass spectrometry of bmCENP-T fragment represented in a 1D plot (E) and in the 3D model (F). Crosslinks validating the proximity between HFE and HFD are highlighted as black lines, and the corresponding residues are labeled. See also Dataset EV1. (G) Schematic representation of a yeast two-hybrid assay (left panel). The transcription of reporter genes is driven by the interaction of proteins that are fused to the GAL4-AD and GAL4-DBD proteins, respectively. The known interacting proteins hsCENP-T and hsCENP-W are shown as representative examples in this schematic. Results from spot dilution assay performed with the reporter strain transformed with plasmids encoding the indicated GAL4-AD and -DBD fusions are shown in the right panel. Growth on CM-leu-trp serves as a control. Growth on CM-leu-trp-his and CM-leu-trp-his-ade dropout plates indicates positive interaction between the proteins cloned in fusion with GAL4-AD and GAL4-DBD. The plates were photographed after incubation at 30 °C for 48 h. Source data are available online for this figure.
Figure 2 The monomeric histone fold and the repositioned extension occlude CENP-W and stabilize CENP-T as a monomer. (A) Front and side views of the bmCENP-T C-terminus containing the HFD and HFE as modeled by AlphaFold. Hydrophobic residues within this fragment are colored beige in the side view. The sequences upstream of the HFD in bmCENP-T were hidden in the model for clarity. (B) A comparative side view of ggCENP-TW heterodimer, highlighting the position of ggCENP-T-HFE relative to ggCENP-W and the ggCENP-T-HFD (dotted circle). For clarity, only the second helix of the ggCENP-W histone fold is shown in black. The images were adapted from PDB entry 3VH6 (Nishino et al, 2012). (C) Illustration of the proposed stabilization of bmCENP-T histone fold by hydrophobic residues present in the HFE. Three hydrophobic surfaces from α1, α2-3, and α4-5 are proposed to form a hydrophobic core. The hydrophobic residues and their side chains are colored as in (A). Scale bar, 3.85 Ang. (D) A tilted view of ggCENP–TW complex shown in (B) depicting the proximity of the side chains of hydrophobic residues from the helices of ggCENP-T and ggCENP-W. The hydrophobic residues are shaded beige in the backbone, and their side chains are represented as sticks in gray. (E, F) EDC-NHS crosslinking mass spectrometry of bmCENP-T fragment represented in a 1D plot (E) and in the 3D model (F). Crosslinks validating the proximity between HFE and HFD are highlighted as black lines, and the corresponding residues are labeled. See also Dataset EV1. (G) Schematic representation of a yeast two-hybrid assay (left panel). The transcription of reporter genes is driven by the interaction of proteins that are fused to the GAL4-AD and GAL4-DBD proteins, respectively. The known interacting proteins hsCENP-T and hsCENP-W are shown as representative examples in this schematic. Results from spot dilution assay performed with the reporter strain transformed with plasmids encoding the indicated GAL4-AD and -DBD fusions are shown in the right panel. Growth on CM-leu-trp serves as a control. Growth on CM-leu-trp-his and CM-leu-trp-his-ade dropout plates indicates positive interaction between the proteins cloned in fusion with GAL4-AD and GAL4-DBD. The plates were photographed after incubation at 30 °C for 48 h. Source data are available online for this figure.CC BY · PubMed Central
Figure EV2 Structural basis for the stability of bmCENP-T in the absence of an interacting partner. (A) AlphaFold predicted structure of full-length bmCENP-T colored based on the confidence scores for each residue (bfactor-pLDDT score). (B) Overlay of the top five bmCENP-T models generated by AlphaFold. The helices of the HFD (α1–3) and the extension (α4-5) are indicated. The sequences upstream of the HFD in these models are hidden for clarity. (C) The pLDDT plot for the five models shown in (A). The regions corresponding to the helices of the HFD, and the extension are highlighted by a line diagram above the plot. (D) The best-ranked AlphaFold models for bmCENP-T and sfCENP-T are overlaid to highlight structural similarities at the C-terminus. Only the regions corresponding to the HFD and the HFE are shown in the panel. (E) Similarity in the stabilization of the monomeric HFD in sfCENP-T by the hydrophobic residues in the extension as shown for bmCENP-T in Fig. 2C. (F) Multiple sequence alignment of C-terminal fragment of CENP-T containing the HFD and HFE from several insect orders. The alignment was generated by MAFFT and was colored using the hydrophobicity scheme in JalView. The line diagram above the sequences indicates the helices of HFD (α1–3) and HFE (α4-5) as in B. mori. The cladogram represents insect orders where CENP-T has been detected. The sequences species and the orders they represent are as follows: Lepidoptera (B. mori, Heliconius melpomene, Danaus plexippus, S. frugiperda), Hymenoptera (Nasonia vitripennis, Atta cephalotes), Hemiptera (Rhodnius prolixus, Acyrthosiphon pisum), Phthiraptera (Pediculus humanus corporis), Blattoeda (Blatella germanica), Dermaptera (Forficula auricularia), Orthoptera (Acheta domestica), Odonata (Libuellua vibrans), Ephemeroptera (Ephemera dancia). (G) The AlphaFold3 model of a homodimeric full-length bmCENP-T colored based on pLDDT scores. The pTM and ipTM values generated by the AlphaFold webserver are indicated. The predicted aligned error matrix is presented below the model. It should be noted that, unlike the prediction for bmCENP-T monomer, the N-terminus of CENP-T is predominantly helical in the homodimer, albeit with a low complex confidence score. (H) Whole cell extracts from cells used in the spot dilution assay shown in Fig. 2G were analyzed by immunoblotting using anti-Myc and anti-HA antibodies. (I) The inability of a monomeric HFD (from bmCENP-T) to interact with a canonical HFD (from hsCENP-W) as revealed by AlphaFold multimer. The predicted aligned error (PAE) matrix is presented on the right. Source data are available online for this figure.
Figure EV2 Structural basis for the stability of bmCENP-T in the absence of an interacting partner. (A) AlphaFold predicted structure of full-length bmCENP-T colored based on the confidence scores for each residue (bfactor-pLDDT score). (B) Overlay of the top five bmCENP-T models generated by AlphaFold. The helices of the HFD (α1–3) and the extension (α4-5) are indicated. The sequences upstream of the HFD in these models are hidden for clarity. (C) The pLDDT plot for the five models shown in (A). The regions corresponding to the helices of the HFD, and the extension are highlighted by a line diagram above the plot. (D) The best-ranked AlphaFold models for bmCENP-T and sfCENP-T are overlaid to highlight structural similarities at the C-terminus. Only the regions corresponding to the HFD and the HFE are shown in the panel. (E) Similarity in the stabilization of the monomeric HFD in sfCENP-T by the hydrophobic residues in the extension as shown for bmCENP-T in Fig. 2C. (F) Multiple sequence alignment of C-terminal fragment of CENP-T containing the HFD and HFE from several insect orders. The alignment was generated by MAFFT and was colored using the hydrophobicity scheme in JalView. The line diagram above the sequences indicates the helices of HFD (α1–3) and HFE (α4-5) as in B. mori. The cladogram represents insect orders where CENP-T has been detected. The sequences species and the orders they represent are as follows: Lepidoptera (B. mori, Heliconius melpomene, Danaus plexippus, S. frugiperda), Hymenoptera (Nasonia vitripennis, Atta cephalotes), Hemiptera (Rhodnius prolixus, Acyrthosiphon pisum), Phthiraptera (Pediculus humanus corporis), Blattoeda (Blatella germanica), Dermaptera (Forficula auricularia), Orthoptera (Acheta domestica), Odonata (Libuellua vibrans), Ephemeroptera (Ephemera dancia). (G) The AlphaFold3 model of a homodimeric full-length bmCENP-T colored based on pLDDT scores. The pTM and ipTM values generated by the AlphaFold webserver are indicated. The predicted aligned error matrix is presented below the model. It should be noted that, unlike the prediction for bmCENP-T monomer, the N-terminus of CENP-T is predominantly helical in the homodimer, albeit with a low complex confidence score. (H) Whole cell extracts from cells used in the spot dilution assay shown in Fig. 2G were analyzed by immunoblotting using anti-Myc and anti-HA antibodies. (I) The inability of a monomeric HFD (from bmCENP-T) to interact with a canonical HFD (from hsCENP-W) as revealed by AlphaFold multimer. The predicted aligned error (PAE) matrix is presented on the right. Source data are available online for this figure.CC BY · PubMed Central
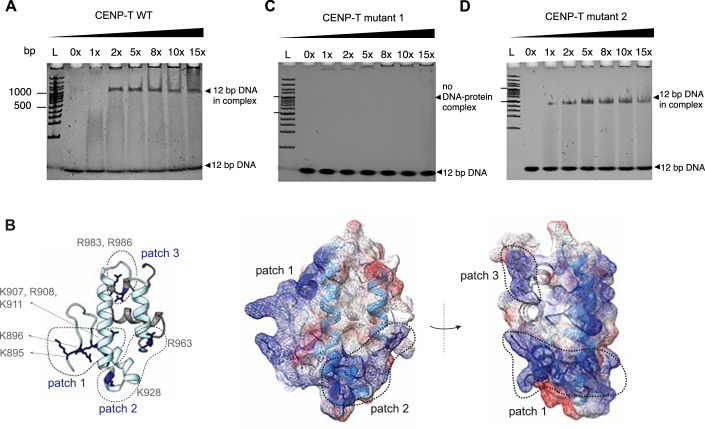
Figure 3 The DNA-binding ability of CENP-T is conserved in B. mori. (A) 5% Native PAGE gels of DNA titrations using different molar ratios of bmCENP-T894-1016-WT with a 12 bp DNA in 100 mM NaCl. Lane L: 100 bp DNA marker. (B) The positively charged surfaces formed by the conserved lysines and arginine residues in patches 1–3 are highlighted. The position of these residues and their side chains (dark blue) is shown in the ribbon model on the left. The surface charge distribution of the same model is depicted on the right. The front and side views are shown for this model with the positively and negatively charged surfaces colored blue and red, respectively. (C, D) Native PAGE gels of DNA titration using different molar ratios of bmCENP-T894-1016 patch 1 mutant with the substitutions K895A, R896A, K907A, R908S, and K911A (C) and bmCENP-T894-1016 patch 2 mutant with the substitutions R928S and R963S (D). The assay was performed with a 12 bp DNA fragment and indicated amounts of protein at 100 mM NaCl. Lane L: 100 bp DNA marker. Source data are available online for this figure.
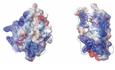
Figure 3 The DNA-binding ability of CENP-T is conserved in B. mori. (A) 5% Native PAGE gels of DNA titrations using different molar ratios of bmCENP-T894-1016-WT with a 12 bp DNA in 100 mM NaCl. Lane L: 100 bp DNA marker. (B) The positively charged surfaces formed by the conserved lysines and arginine residues in patches 1–3 are highlighted. The position of these residues and their side chains (dark blue) is shown in the ribbon model on the left. The surface charge distribution of the same model is depicted on the right. The front and side views are shown for this model with the positively and negatively charged surfaces colored blue and red, respectively. (C, D) Native PAGE gels of DNA titration using different molar ratios of bmCENP-T894-1016 patch 1 mutant with the substitutions K895A, R896A, K907A, R908S, and K911A (C) and bmCENP-T894-1016 patch 2 mutant with the substitutions R928S and R963S (D). The assay was performed with a 12 bp DNA fragment and indicated amounts of protein at 100 mM NaCl. Lane L: 100 bp DNA marker. Source data are available online for this figure.CC BY · PubMed Central
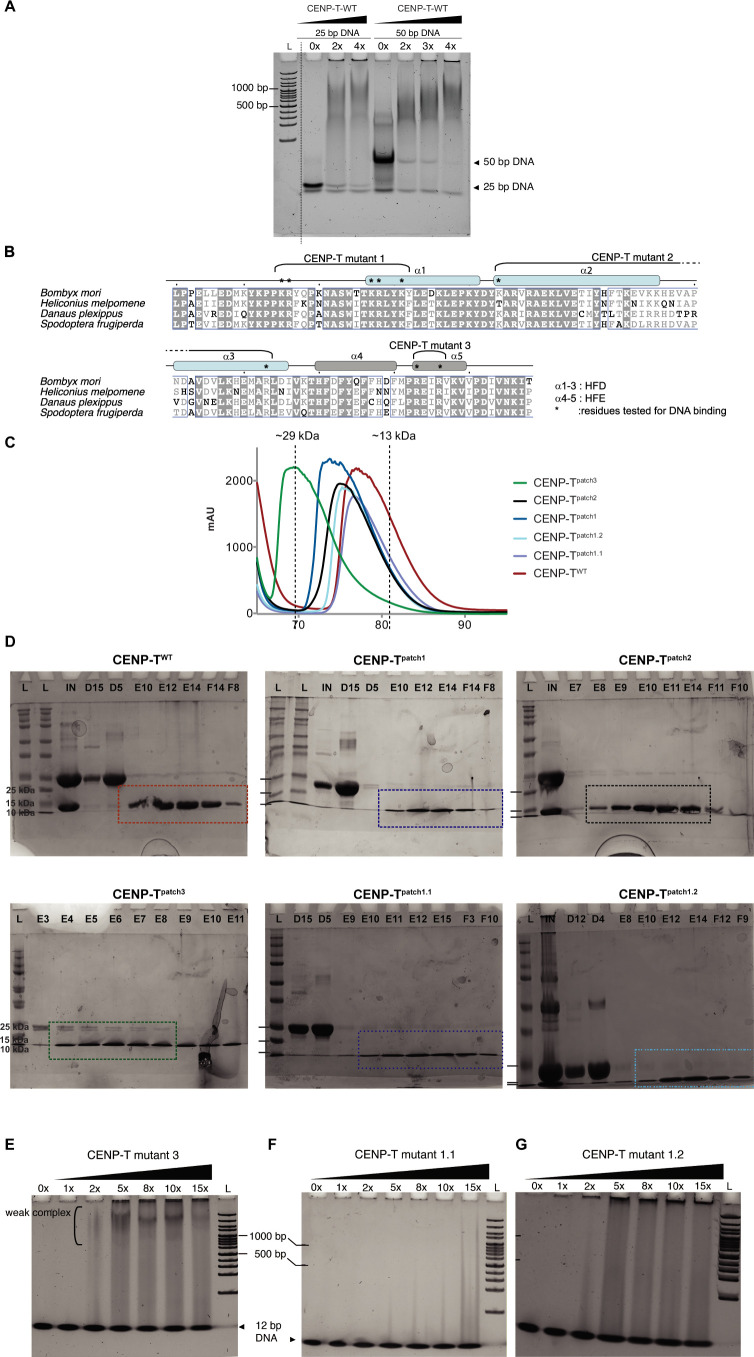
Figure EV3 Residues in patch 2 and patch 3 are dispensable for DNA binding. (A) Native PAGE gels of DNA titration using different molar ratios of bmCENP-T894–1016-WT and a 25 bp or a 50 bp DNA fragment at 100 mM NaCl. Lane L: 100 bp DNA marker. (B) Multiple sequence alignment of the C’ fragment of CENP-T between 4 lepidopteran species. Identical residues are highlighted with a gray background. The residues tested for DNA binding function are marked with an asterisk. (C) The SEC elution profile of the WT and mutant versions of bmCENP-T used in the DNA binding assays in Figs. 3 and EV3. (D) The Coomassie stained SDS-polyacrylamide gels containing the SEC fractions for the purification of the indicated versions of bmCENP-T after cleaving the GST tag. The quality of each sample studied in S3C (colored boxes) is visually represented. L- Ladder, IN- Input sample, alphanumeric labels starting with D/E/F are different fractions collected in the experiment. (E–G) Native PAGE gels of DNA titration using different molar ratios of bm CENP-T894-1016 -patch 3 mutant (C), bmCENP-T894-1016 patch 1.1 mutant with the substitutions K895A, R896A, and K907A (D) and bmCENP-T894-1016 patch 1.2 mutant with the substitutions R908S and K911A (E). Lane L: 100 bp DNA marker.
Figure EV3 Residues in patch 2 and patch 3 are dispensable for DNA binding. (A) Native PAGE gels of DNA titration using different molar ratios of bmCENP-T894–1016-WT and a 25 bp or a 50 bp DNA fragment at 100 mM NaCl. Lane L: 100 bp DNA marker. (B) Multiple sequence alignment of the C’ fragment of CENP-T between 4 lepidopteran species. Identical residues are highlighted with a gray background. The residues tested for DNA binding function are marked with an asterisk. (C) The SEC elution profile of the WT and mutant versions of bmCENP-T used in the DNA binding assays in Figs. 3 and EV3. (D) The Coomassie stained SDS-polyacrylamide gels containing the SEC fractions for the purification of the indicated versions of bmCENP-T after cleaving the GST tag. The quality of each sample studied in S3C (colored boxes) is visually represented. L- Ladder, IN- Input sample, alphanumeric labels starting with D/E/F are different fractions collected in the experiment. (E–G) Native PAGE gels of DNA titration using different molar ratios of bm CENP-T894-1016 -patch 3 mutant (C), bmCENP-T894-1016 patch 1.1 mutant with the substitutions K895A, R896A, and K907A (D) and bmCENP-T894-1016 patch 1.2 mutant with the substitutions R908S and K911A (E). Lane L: 100 bp DNA marker.CC BY · PubMed Central
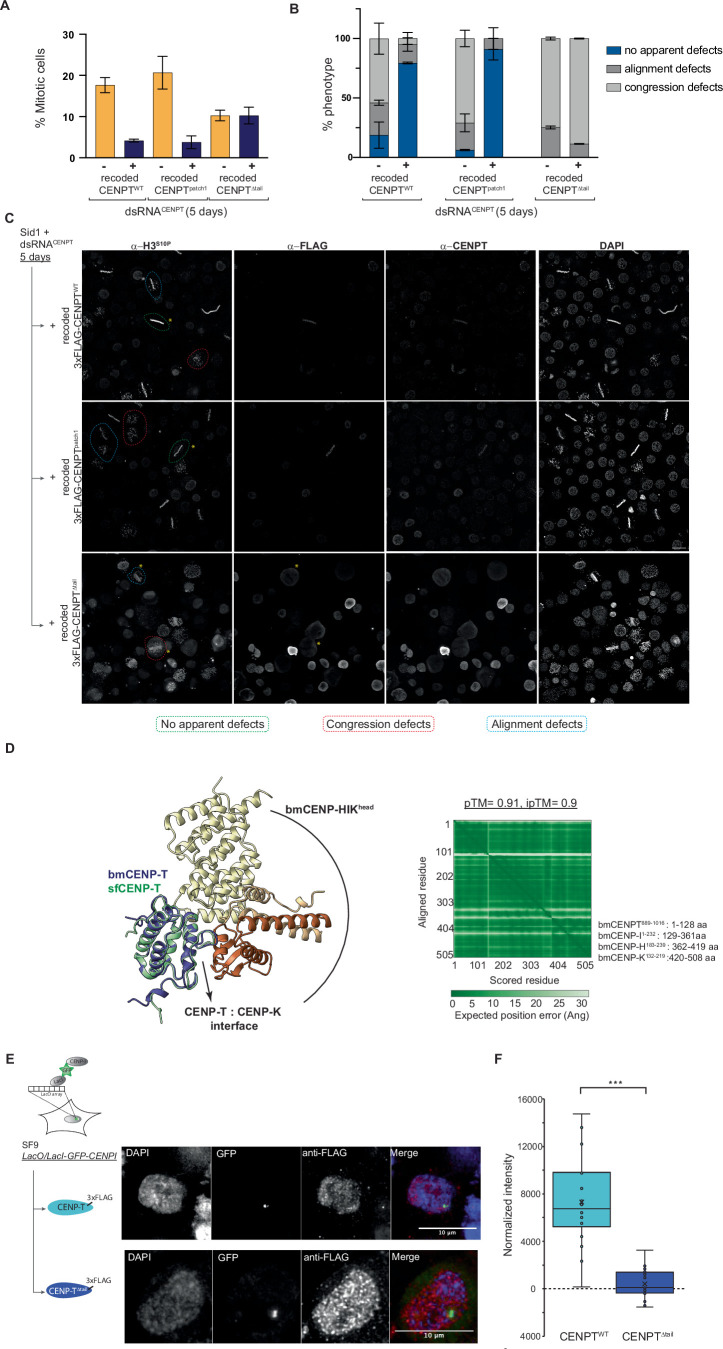
Figure EV4 Properties and roles of the B. mori CENP-T as part of the kinetochore in B. mori cells. (A) Mitotic index of untransfected (gray) or transfected (blue) cells expressing RNAi-resistant versions of bmCENP-TWT, bmCENP-Tpatch1, or bmCENP-TΔtail upon depletion of endogenous CENP-T. (B) Fraction of cells with or without mitotic defects, and the nature of defects observed (congression or alignment defects) upon endogenous CENP-T depletion in lines expressing bmCENP-TWT, bmCENP-Tpatch1, or bmCENP-TΔtail. (C) Representative examples of untransfected or transfected cells expressing bmCENP-TWT, bmCENP-Tpatch1, or bmCENP-TΔtail in mitosis stained against phospho histone H3 (anti-H3S10P), anti-FLAG, anti-CENP-T, and DAPI. Scale bar, 10 μm. (D) AlphaFold multimer model of the interaction between bmCENP-T889-1016 and the bmCENP-T-HIKhead constituted by bmCENP-T-I1-232, bmCENP-T-H183-239, and bmCENP-T-K132-219. The confidence scores and the predicted aligned error matrix are presented on the right. The AlphaFold model of full-length sfCENP-T was superimposed over the CENP-HIKhead:T model. The disordered N terminus of sfCENP-T upstream of the histone fold were hidden for clarity. (E) Representative images of DAPI-stained cells showing localization pattern of 3xFLAG-tagged sfCENP-TWT (top) or sfCENP-TΔtail (bottom) in Sf9-LacO lines transiently expressing LacI-GFP-sfCENPI constructs. Merge: DNA (blue), expressing LacI-GFP-sfCENPI (green) and 3xFLAG-tagged sfCENP-TWT (top) or sfCENP-TΔtail (red). Scale bar: 10 μm. (F) Quantifications of normalized mean fluorescence intensity of 3xFLAG-tagged sfCENP-TWT or sfCENP-TΔtail at the LacI foci. Statistical significance was tested using the Student’s t test (*** indicates P = 3.8 × 10⁻⁷). The edges of the box mark the 25th and 75th percentile and the line inside marks the median value. Source data are available online for this figure.
Figure EV4 Properties and roles of the B. mori CENP-T as part of the kinetochore in B. mori cells. (A) Mitotic index of untransfected (gray) or transfected (blue) cells expressing RNAi-resistant versions of bmCENP-TWT, bmCENP-Tpatch1, or bmCENP-TΔtail upon depletion of endogenous CENP-T. (B) Fraction of cells with or without mitotic defects, and the nature of defects observed (congression or alignment defects) upon endogenous CENP-T depletion in lines expressing bmCENP-TWT, bmCENP-Tpatch1, or bmCENP-TΔtail. (C) Representative examples of untransfected or transfected cells expressing bmCENP-TWT, bmCENP-Tpatch1, or bmCENP-TΔtail in mitosis stained against phospho histone H3 (anti-H3S10P), anti-FLAG, anti-CENP-T, and DAPI. Scale bar, 10 μm. (D) AlphaFold multimer model of the interaction between bmCENP-T889-1016 and the bmCENP-T-HIKhead constituted by bmCENP-T-I1-232, bmCENP-T-H183-239, and bmCENP-T-K132-219. The confidence scores and the predicted aligned error matrix are presented on the right. The AlphaFold model of full-length sfCENP-T was superimposed over the CENP-HIKhead:T model. The disordered N terminus of sfCENP-T upstream of the histone fold were hidden for clarity. (E) Representative images of DAPI-stained cells showing localization pattern of 3xFLAG-tagged sfCENP-TWT (top) or sfCENP-TΔtail (bottom) in Sf9-LacO lines transiently expressing LacI-GFP-sfCENPI constructs. Merge: DNA (blue), expressing LacI-GFP-sfCENPI (green) and 3xFLAG-tagged sfCENP-TWT (top) or sfCENP-TΔtail (red). Scale bar: 10 μm. (F) Quantifications of normalized mean fluorescence intensity of 3xFLAG-tagged sfCENP-TWT or sfCENP-TΔtail at the LacI foci. Statistical significance was tested using the Student’s t test (*** indicates P = 3.8 × 10⁻⁷). The edges of the box mark the 25th and 75th percentile and the line inside marks the median value. Source data are available online for this figure.CC BY · PubMed Central
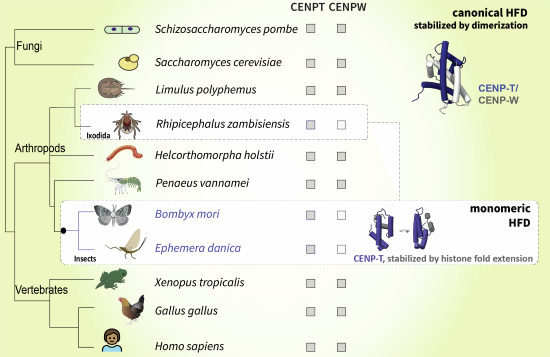
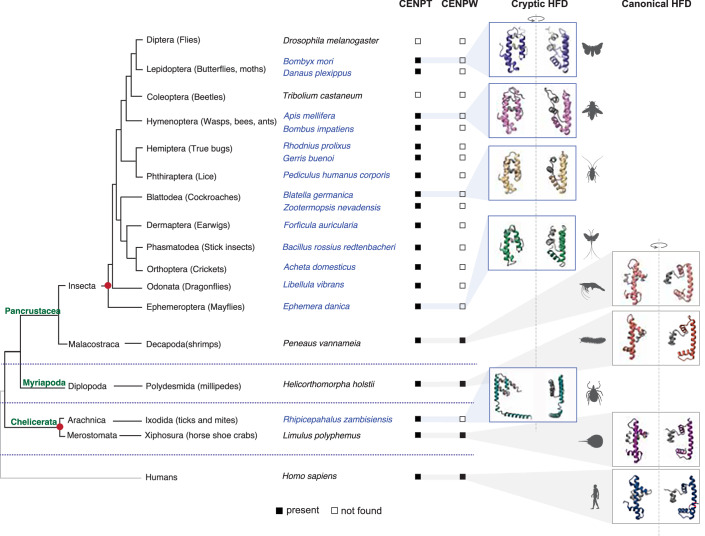
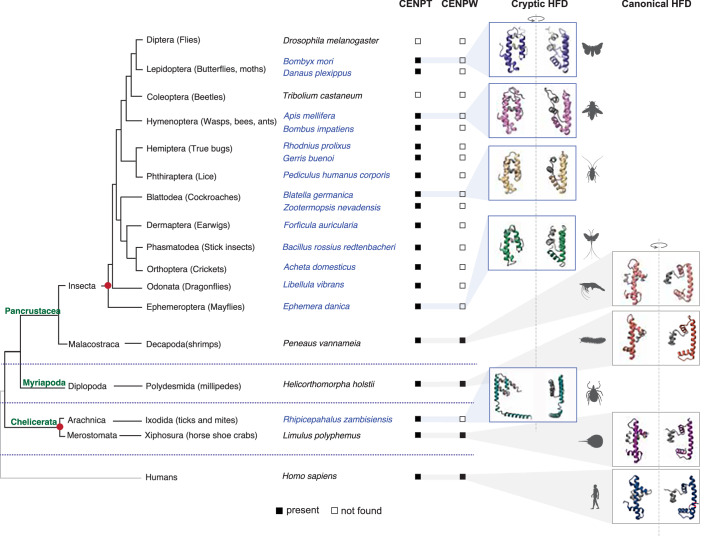
Figure 4 Independent evolution of the monomeric HFD in Arthropods. A cladogram depicting the three major arthropod classes Chelicerata, Myriapoda, and Pancrustacea, with humans as an outgroup. Species representative of each of these classes are mentioned along with their respective subclass and order. The presence/absence of indicated proteins in each species is marked by filled and empty boxes, respectively. For protein IDs, see Dataset EV2. The configuration of the CENP-T HFD was assessed using AlphaFold for one species in each taxonomic order. Species with a monomeric CENP-T HFD are colored in blue, and the ones with a canonical CENP-T HFD are colored black. The cartoons on the right are two different views of the predicted model to highlight the proximity of the C’ extension. The red circles mark the two independent origins of the monomeric HFD identified in this study.
Figure 4 Independent evolution of the monomeric HFD in Arthropods. A cladogram depicting the three major arthropod classes Chelicerata, Myriapoda, and Pancrustacea, with humans as an outgroup. Species representative of each of these classes are mentioned along with their respective subclass and order. The presence/absence of indicated proteins in each species is marked by filled and empty boxes, respectively. For protein IDs, see Dataset EV2. The configuration of the CENP-T HFD was assessed using AlphaFold for one species in each taxonomic order. Species with a monomeric CENP-T HFD are colored in blue, and the ones with a canonical CENP-T HFD are colored black. The cartoons on the right are two different views of the predicted model to highlight the proximity of the C’ extension. The red circles mark the two independent origins of the monomeric HFD identified in this study.CC BY · PubMed Central
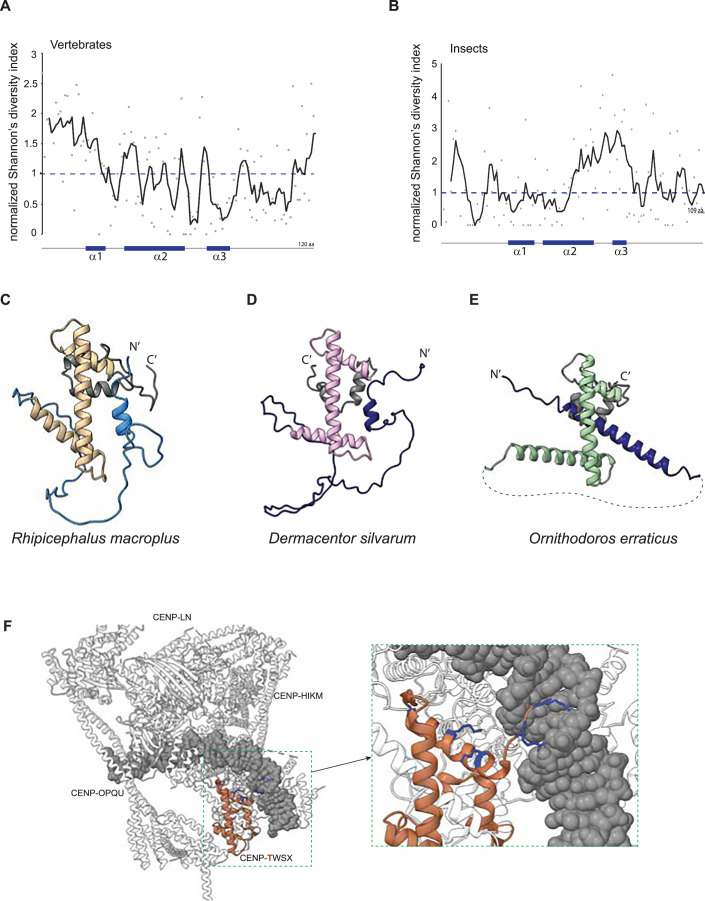
Figure EV5 Diversity in the sequence and structure of the monomeric HFD in Arthropoda. (A, B) Comparative analysis of sequence diversity in vertebrate and insect CENP-T using Shannon’s entropy analysis. The gray dots represent the normalized Shannon’s diversity ratio for each amino acid in the C’ of CENP-T. The trendline represents the moving average of 5 datapoints. (C–E) The AlphaFold model for CENP-T from three acariformes, in which CENP-W remains undetected. The canonical HFD structure in each of the three species is highlighted in beige, pink, and green, respectively. The HFE is colored gray and a part of the N’ of the protein that blocks the interaction space for CENP-W is shaded blue. For protein IDs see Dataset EV2. (F) The structure of human CCAN reported in Yatskevitch et al (2022) highlighting the proximity of α1 of CENP-T HFD (CENP-T is colored brown) to DNA (gray). The side chains of the positively charged amino acids in this region are shown in blue. The illustration was adapted from PDB 7R5S.
Figure EV5 Diversity in the sequence and structure of the monomeric HFD in Arthropoda. (A, B) Comparative analysis of sequence diversity in vertebrate and insect CENP-T using Shannon’s entropy analysis. The gray dots represent the normalized Shannon’s diversity ratio for each amino acid in the C’ of CENP-T. The trendline represents the moving average of 5 datapoints. (C–E) The AlphaFold model for CENP-T from three acariformes, in which CENP-W remains undetected. The canonical HFD structure in each of the three species is highlighted in beige, pink, and green, respectively. The HFE is colored gray and a part of the N’ of the protein that blocks the interaction space for CENP-W is shaded blue. For protein IDs see Dataset EV2. (F) The structure of human CCAN reported in Yatskevitch et al (2022) highlighting the proximity of α1 of CENP-T HFD (CENP-T is colored brown) to DNA (gray). The side chains of the positively charged amino acids in this region are shown in blue. The illustration was adapted from PDB 7R5S.CC BY · PubMed Central

Verification

Claims the paper makes

The claims and statistics of this paper haven’t been checked yet.

Run the check — free, no account needed. It reads the open-access text and checks the sources it cites.

A few free checks a day · papers already verified open instantly · results are public

Self-check

Percentages, sums and reported differences re-computed from the paper’s own numbers.

The self-check needs the paper’s full text.

Citations

Cites

Show all 59 references

Metadata

Authors
Sankaranarayanan, S. R., Ulmer, J., Mørch, A., Ali-Ahmad, A., Sekulić, N., & Drinnenberg, I. A.
Affiliations
  • Centre National de la Recherche Scientifique (FR)
  • University of Oslo (NO)
Corresponding author
Drinnenberg, Ines Anna
Venue
EMBO Reports
Published
2025-10-29
Volume
26
Issue
23
Pages
5799-5825
ISSN
  • 1469-221X (ISSN-L)
  • 1469-3178
OpenAlex
W4415655512
Cited by
2
References
59
Citations by year
2026: 1 · 2025: 1
FWCI
0.99
Type
journal article
Language
en
Open access
Licence
Locations
  • EMBO Reports (publishedVersion, cc-by)
  • bioRxiv (Cold Spring Harbor Laboratory) (acceptedVersion, cc-by-nc-nd)
  • PubMed (publishedVersion)
  • PubMed Central (publishedVersion, cc-by)
  • HAL (submittedVersion)
  • DOAJ (DOAJ: Directory of Open Access Journals) (submittedVersion, cc-by-sa)
Funders
  • European Molecular Biology Organization (LTF 505-2021)
  • Agence Nationale de la Recherche (Labex DEEP ANR-11-LABX-0044 part of the IDEX Idex PSL ANR-10-IDEX-0001-02 PSL)
  • EC | European Research Council (CENEVO-758757)
  • NCMM and Research Council of Norway (187615 and 325528)
  • Fondation pour la Recherche Médicale (FSER202202015420)
Topics
  • Life Sciences › Biochemistry, Genetics and Molecular Biology › Cell Biology › Microtubule and mitosis dynamics
  • Life Sciences › Biochemistry, Genetics and Molecular Biology › Molecular Biology › Genomics and Chromatin Dynamics
  • Life Sciences › Biochemistry, Genetics and Molecular Biology › Molecular Biology › Protein Structure and Dynamics
Keywords
histone fold domain, CENP-T, kinetochore proteins, protein evolution, lepidopteran insects, Acariformes, DNA binding
MeSH terms
Protein Domains, Amino Acid Sequence, Animals, Chromosomal Proteins, Non-Histone, Histones, Humans, Insecta, Models, Molecular, Protein Binding, Protein Folding, Evolution, Molecular, Insect Proteins

About these checks

Registry, retraction, Cites and statistics results are computed, not judged, with one exception: a printed reference that no index lists is read once by a model before it counts as a citation error. Claims are extracted by a model and kept only when their quote appears verbatim in the text; each cited source is then checked, with a model’s help, for whether it says what the claim relies on. Those verdicts can be wrong — read the claim’s quote and the cited source before relying on one.

Statistics and arithmetic are recomputed, not judged.

Confidence bands are shown only for fields calibrated on our annotated test set. None is calibrated yet, so no band is shown.

What counts as a claim ›How we measure confidence ›How we check this ›

Are you an author, or do you see a problem with this page? Request a review

How to cite

Cite CoChat for the checks on this page, and the paper for its own findings.

This page
CoChat. (2026). Citation check: Insects evolved a monomeric histone-fold domain in the CENP-T protein family. https://app.cochat.ai/papers/10.1038/s44319-025-00603-5
The paper
Sankaranarayanan, S. R., Ulmer, J., Mørch, A., Ali-Ahmad, A., Sekulić, N., & Drinnenberg, I. A. (2025). Insects evolved a monomeric histone-fold domain in the CENP-T protein family. EMBO Reports. https://doi.org/10.1038/s44319-025-00603-5

Data sources

Bibliographic data: Semantic Scholar, OpenAlex, Crossref.

Contains information from the Semantic Scholar Academic Graph Datasets, made available under the ODC Attribution License (ODC-BY 1.0).

Semantic Scholar’s data is described in: Kinney, R., et al. (2023). The Semantic Scholar Open Data Platform. arXiv:2301.10140.