

The DOI matches its Crossref record; 49 of the 49 references it cites were found in a registry or an index.
Specific roles for the PI3K and the MEK-ERK pathway in IGF-1-stimulated chemotaxis, VEGF secretion and proliferation of multiple myeloma cells: study in the 5T33MM model
Open accessAbstract
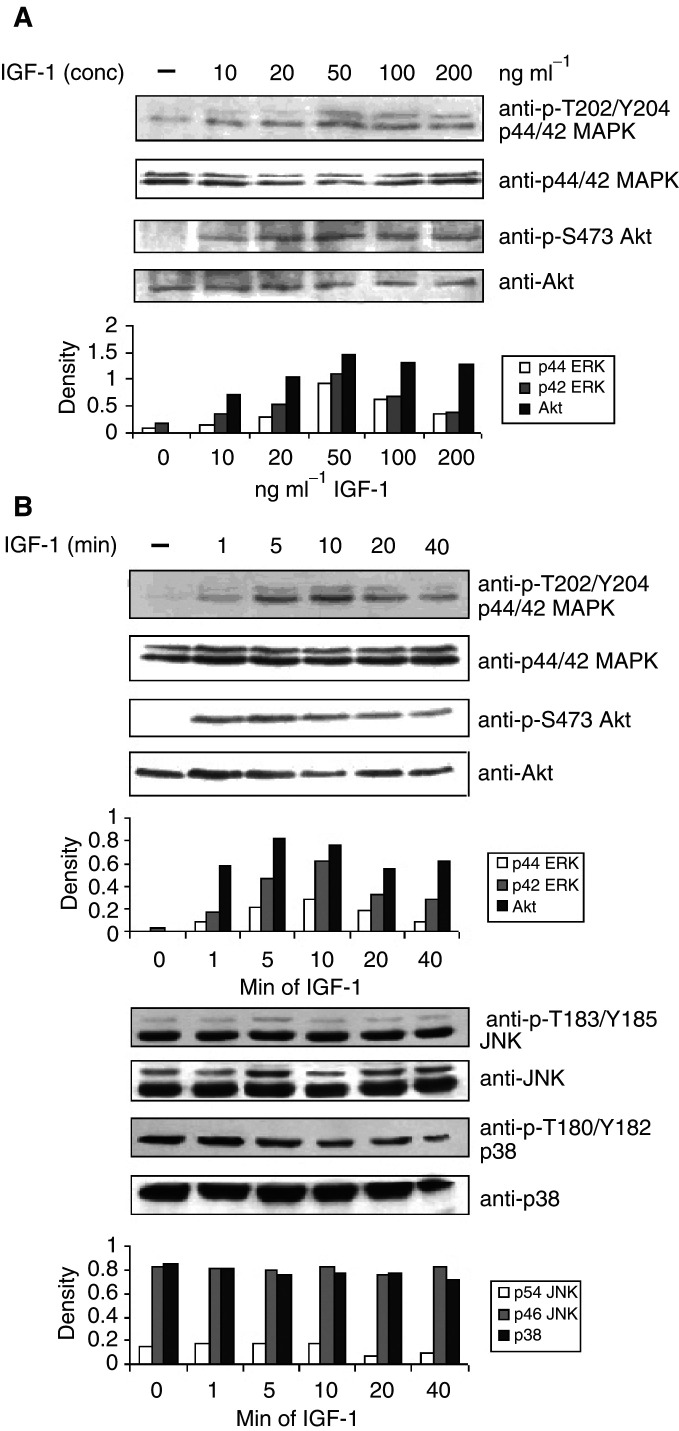
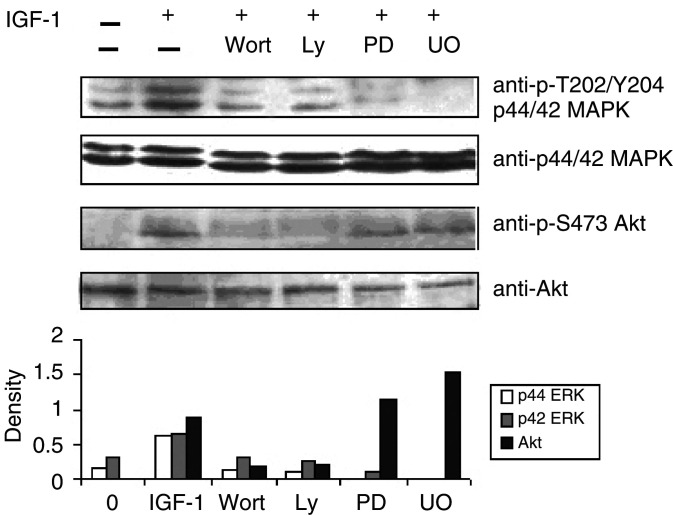
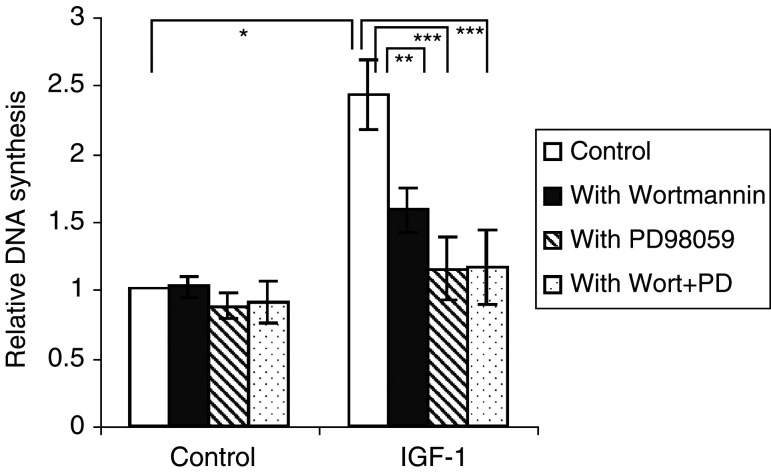
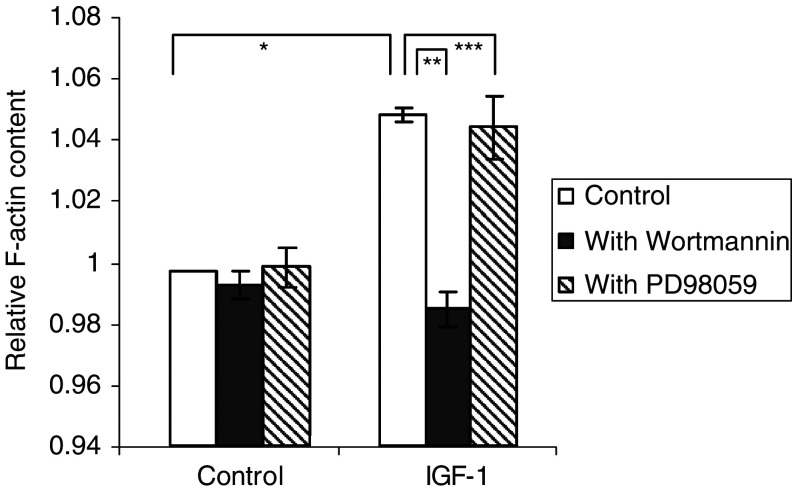
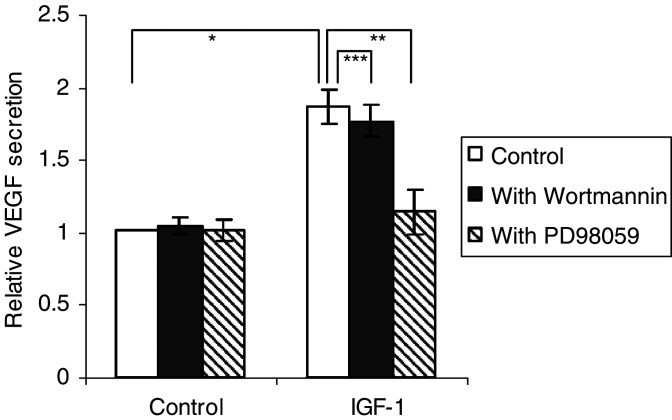
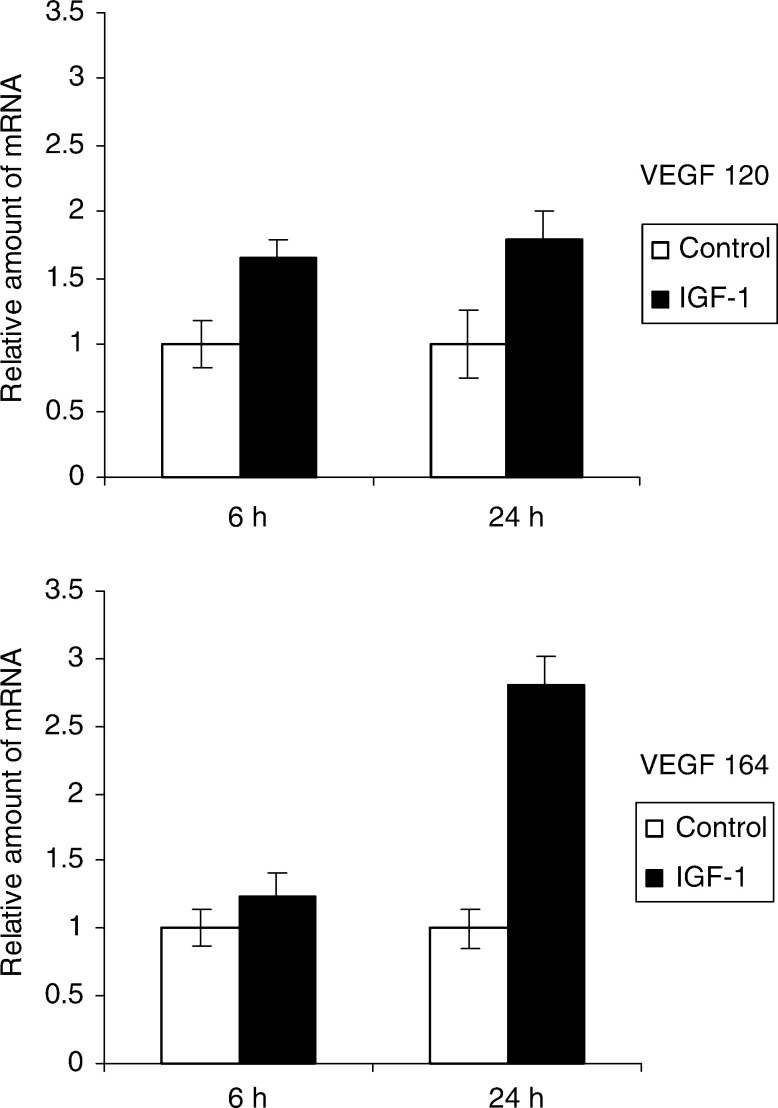
Insulin-like growth factor-1 (IGF-1) has been described as an important factor in proliferation, cell survival and migration of multiple myeloma (MM) cells. Angiogenesis correlates with development and prognosis of the MM disease. Vascular endothelial growth factor (VEGF) is one of the prominent factors involved in this process. The different functions of IGF-1 were investigated in the 5TMM mouse model with emphasis on proliferation, migration and VEGF secretion, and the signalling pathways involved. Western Blot analysis revealed that ERK1/2 and Akt (PKB) were activated after IGF-1 stimulation. The activation of ERK1/2 was reduced by the PI3K inhibitor Wortmannin, implying that the PI3K pathway is involved in its activation. Insulin-like growth factor-1 induced an increase in DNA synthesis in MM cells, which was mediated by a PI3K/Akt-MEK/ERK pathway. Insulin-like growth factor-1 enhanced F-actin assembly and this process was only PI3K mediated. Stimulation by IGF-1 of VEGF production was reduced by PD98059, indicating that only the MEK-ERK pathway is involved in IGF-1-stimulated VEGF production. In conclusion, IGF-1 mediates its multiple effects on MM cells through different signal transduction pathways. In the future, we can study the potential in vivo effects of IGF-1 inhibition on tumour growth and angiogenesis in MM.
Overview
The claims and statistics of this paper haven’t been checked yet.
Run the check — free, no account needed. It reads the open-access text and checks the sources it cites.
Integrity signals
Registry
Cites
Statistics
Figures
Verification
Claims the paper makes
The claims and statistics of this paper haven’t been checked yet.
Run the check — free, no account needed. It reads the open-access text and checks the sources it cites.
Claims other papers make about this one
Each is checked against this paper’s own text: does it say what the citing paper says it does?
In the citing paper
“The two main IGFs, IGF1 and IGF2, bind the IGF1 receptor (IGF1R), which elicits phosphorylation of intracellular adaptor proteins and activation of MAPK and PI3K/AKT signaling pathways [223].”
From Hepatokines and metabolism: Deciphering communication from the liver (2021) · cites this paper as [223]
Self-check
Percentages, sums and reported differences re-computed from the paper’s own numbers.
The self-check needs the paper’s full text.
Citations
Cites
Insulin-Like Growth Factors and Their Binding Proteins: Biological Actions*
Jones, J. I. W., & Clemmons, D. R. (1995) · Endocrine Reviews · doi:10.1210/edrv-16-1-3 · Cited by 4,488
Lymphocyte Homing and Homeostasis
Butcher, E. C., & Picker, L. J. (1996) · Science · doi:10.1126/science.272.5258.60 · Cited by 2,846
The Somatomedin Hypothesis: 2001
Roith, D. L., Bondy, C. A., Yakar, S., Liu, J., & Butler, A. A. (2001) · Endocrine Reviews · doi:10.1210/edrv.22.1.0419 · Cited by 1,272
Tumor vascular permeability factor stimulates endothelial cell growth and angiogenesis.
Connolly, D. T., Heuvelman, D. M., Nelson, R. M., Olander, J. V., Eppley, B. L., Delfino, J. J., Siegel, N. R., Leimgruber, R. M., & Feder, J. (1989) · Journal of Clinical Investigation · doi:10.1172/jci114322 · Cited by 1,265
Phosphorylation and Regulation of Raf by Akt (Protein Kinase B)
Zimmermann, S., & Moelling, K. (1999) · Science · doi:10.1126/science.286.5445.1741 · Cited by 1,093
Fukuda, R., Hirota, K., Fan, F., Jung, Y. D., Ellis, L. M., & Semenza, G. L. (2002) · Journal of Biological Chemistry · doi:10.1074/jbc.m203781200 · Cited by 832
(1998) · British Journal of Cancer · doi:10.1038/bjc.1998.1 · Cited by 651
Bone marrow angiogenesis and progression in multiple myeloma
Vacca, A., Ribatti, D., Roncali, L., Ranieri, G., Serio, G., Silvestris, F., & Dammacco, F. (1994) · British Journal of Haematology · doi:10.1111/j.1365-2141.1994.tb08304.x · Cited by 629
Vacca, A., Ribatti, D., Presta, M., Minischetti, M., Iurlaro, M., Ria, R., Albini, A., Bussolino, F., & Dammacco, F. (1999) · Blood · doi:10.1182/blood.v93.9.3064 · Cited by 593
Uchiyama, H., Barut, B., Mohrbacher, A., Chauhan, D., & Anderson, K. C. (1993) · Blood · doi:10.1182/blood.v82.12.3712.3712 · Cited by 421
Podar, K., Tai, Y., Davies, F. E., Lentzsch, S., Sattler, M., Hideshima, T., Lin, B. K., Gupta, D. K., Shima, Y., Chauhan, D., et al. (2001) · Blood · doi:10.1182/blood.v98.2.428 · Cited by 412
Bornfeldt, K., Raines, E. W., Nakano, T., Graves, L. M., Krebs, E. G., & Ross, R. (1994) · Journal of Clinical Investigation · doi:10.1172/jci117081 · Cited by 409
Bakkus, M. H. C., Heirman, C., Riet, I. V., Camp, B. V., & Thielemans, K. (1992) · Blood · doi:10.1182/blood.v80.9.2326.2326 · Cited by 315
Self-citationSignal Transduction by the Chemokine Receptor CXCR3
Bonacchi, A., Romagnani, P., Romanelli, R. G., Efsen, E., Annunziato, F., Lasagni, L., Francalanci, M., Serio, M., Laffi, G., Pinzani, M., et al. (2001) · Journal of Biological Chemistry · doi:10.1074/jbc.m010303200 · Cited by 305
Regulation of cell polarity during eukaryotic chemotaxis: the chemotactic compass
Weiner, O. D. (2002) · Current Opinion in Cell Biology · doi:10.1016/s0955-0674(02)00310-1 · Cited by 284
Wennström, S., & Downward, J. (1999) · Molecular and Cellular Biology · doi:10.1128/mcb.19.6.4279 · Cited by 276
Requirement of Phosphatidylinositol 3-Kinase in Focal Adhesion Kinase-promoted Cell Migration
Reiske, H. R., Kao, S.-C., Cary, L. A., Guan, J., Lai, J., & Chen, H. (1999) · Journal of Biological Chemistry · doi:10.1074/jbc.274.18.12361 · Cited by 274
Roles of PI3Ks in leukocyte chemotaxis and phagocytosis
Stephens, L., Ellson, C. D., & Hawkins, P. T. (2002) · Current Opinion in Cell Biology · doi:10.1016/s0955-0674(02)00311-3 · Cited by 258
Tu, Y., Gardner, A. M., & Lichtenstein, A. K. (2000) · PubMed · Cited by 235
'Role of bone marrow stromal cells in the growth of human multiple myeloma
Caligaris‐Cappio, F., Bergui, L., Gregoretti, M. G., Gaïdano, G., Gaboli, M. P., M., S., Zallone, A., & Marchisio, P. (1991) · Blood · doi:10.1182/blood.v77.12.2688.bloodjournal77122688 · Cited by 233
Kijowski, J., Baj‐Krzyworzeka, M., Majka, M., Reca, R., Marquez‐Curtis, L. A., Christofidou‐Solomidou, M., Janowska‐Wieczorek, A., & Ratajczak, M. Z. (2001) · Stem Cells · doi:10.1634/stemcells.19-5-453 · Cited by 224
Miele, C., Rochford, J. J., Filippa, N., Giorgetti‐Peraldi, S., & OBBERGHEN, E. V. (2000) · Journal of Biological Chemistry · doi:10.1074/jbc.m000805200 · Cited by 216
Podar, K., Tai, Y., Lin, B. K., Narsimhan, R. P., Sattler, M., Kijima, T., Salgia, R., Gupta, D. K., Chauhan, D., & Anderson, K. C. (2002) · Journal of Biological Chemistry · doi:10.1074/jbc.m109068200 · Cited by 180
Insulin-like growth factor I is a growth and survival factor in human multiple myeloma cell lines
Georgii‐Hemming, P., Wiklund, H., Ljunggren, Ö., & Nilsson, K. (1996) · Blood · doi:10.1182/blood.v88.6.2250.bloodjournal8862250 · Cited by 178
Radl, J., de Glopper, E., Schuit, H. R. E., & ZURCHER, C. (1979) · PubMed · Cited by 161
Lokhorst, H. M., Lamme, T., Smet, M. D., Klein, S. C., de Weger, R. A., Oers, R. H. J. V., & Bloem, A. C. (1994) · Blood · doi:10.1182/blood.v84.7.2269.2269 · Cited by 159
Ferlin, M., Noraz, N., Hertogh, C., Brochier, J., Taylor, N. N., & Klein, B. (2000) · British Journal of Haematology · doi:10.1046/j.1365-2141.2000.02364.x · Cited by 156
Vanderkerken, K., Raeve, H. D., Goes, E., Meirvenne, S. V., Radl, J., Riet, I. V., Thielemans, K., & Camp, B. V. (1997) · British Journal of Cancer · doi:10.1038/bjc.1997.409 · Cited by 153
Self-citationChemokine signalling: pivoting around multiple phosphoinositide 3‐kinases
Curnock, A. P., Logan, M. K., & Ward, S. G. (2002) · Immunology · doi:10.1046/j.1365-2567.2002.01345.x · Cited by 151
Qiang, Y., Kopantzev, E. P., & Rudikoff, S. (2002) · Blood · doi:10.1182/blood.v99.11.4138 · Cited by 150
The 5TMM series: a useful in vivo mouse model of human multiple myeloma
Asosingh, K., Radl, J., Riet, I. V., Camp, B. V., & Vanderkerken, K. (2000) · The Hematology Journal · doi:10.1038/sj.thj.6200052 · Cited by 143
Self-citationComer, F. I., & Parent, C. A. (2002) · Cell · doi:10.1016/s0092-8674(02)00765-1 · Cited by 132
Abboud, S. L., Bethel, C. R., & Aron, D. C. (1991) · Journal of Clinical Investigation · doi:10.1172/jci115327 · Cited by 107
Mira, E., Mañes, S., Lacalle, R. A., Márquez, G., & Martínez‐A, C. (1999) · Endocrinology · doi:10.1210/endo.140.4.6623 · Cited by 100
Radl, J., de Glopper, E., Schuit, H. R. E., & ZURCHER, C. (1979) · The Journal of Immunology · doi:10.4049/jimmunol.122.2.609 · Cited by 100
Insulin-Like Growth Factor-1 Acts as a Chemoattractant Factor for 5T2 Multiple Myeloma Cells
Vanderkerken, K., Asosingh, K., Braet, F., Riet, I. V., & Camp, B. V. (1999) · Blood · doi:10.1182/blood.v93.1.235 · Cited by 92
Self-citationFranitza, S., Kollet, Ó., Brill, A. G., Vaday, G. G., Petit, I., Lapidot, T., Alon, R., & Lider, O. (2002) · European Journal of Immunology · doi:10.1002/1521-4141(200201)32:1 · Cited by 77
Asosingh, K., Günthert, U., Bakkus, M. H. C., Raeve, H. D., Goes, E., Riet, I. V., Camp, B. V., & Vanderkerken, K. (2000) · PubMed · doi:10.5451/unibas-ep6481 · Cited by 74
Self-citationZhang, L., Conejo-Garcia, J. R., Yang, N., Huang, W. C., Mohamed-Hadley, A. A., Yao, W., Benencia, F., & Coukos, G. (2002) · Biochemical and Biophysical Research Communications · doi:10.1006/bbrc.2002.6710 · Cited by 66
Role of Phosphoinositide 3-Kinase in Monocyte Recruitment under Flow Conditions
Gerszten, R. E., Friedrich, E. B., Matsui, T., Hung, R. R., Li, L., Force, T. L., & Rosenzweig, A. (2001) · Journal of Biological Chemistry · doi:10.1074/jbc.m011235200 · Cited by 66
Tanimura, S., Nomura, K., Ozaki, K., Tsujimoto, M., Kondo, T., & Kohno, M. (2002) · Journal of Biological Chemistry · doi:10.1074/jbc.m202866200 · Cited by 61
Freund, G. G., Kulas, D. T., Way, B. A., & Mooney, R. A. (1994) · PubMed · Cited by 56
The Involvement of Adhesion Molecules in the Biology of Multiple Myeloma
Riet, I. V., & Camp, B. V. (1993) · Leukemia & lymphoma/Leukemia and lymphoma · doi:10.3109/10428199309145751 · Cited by 56
Self-citationSelective initial in vivo homing pattern of 5T2 multiple myeloma cells in the C57BL/KalwRij mouse
Vanderkerken, K., Greef, C. D., Asosingh, K., Arteta, B., Veerman, M. D., Broek, I. V., Riet, I. V., Kobayashi, M., Smedsrød, B. H., & Camp, B. V. (2000) · British Journal of Cancer · doi:10.1054/bjoc.1999.1024 · Cited by 52
Self-citationMurine 5T multiple myeloma cells induce angiogenesis in vitro and in vivo
Valckenborgh, E. V., Raeve, H. D., Devy, L., Blacher, S., Munaut, C., Noël, A., Marck, E. V., Riet, I. V., Camp, B. V., & Vanderkerken, K. (2002) · British Journal of Cancer · doi:10.1038/sj.bjc.6600137 · Cited by 51
Self-citationDelehedde, M., Sergeant, N., Lyon, M., Rudland, P. S., & Fernig, D. G. (2001) · European Journal of Biochemistry · doi:10.1046/j.1432-1327.2001.02363.x · Cited by 50
Puglianiello, A., Germani, D., Rossi, P., & Cianfarani, S. (2000) · Journal of Endocrinology · doi:10.1677/joe.0.1650123 · Cited by 44
The F‐Actin Content of Multiple Myeloma Cells as a Measure of Their Migration
Menu, E., Braet, F., Timmers, M., Riet, I. V., Camp, B. V., & Vanderkerken, K. (2002) · Annals of the New York Academy of Sciences · doi:10.1111/j.1749-6632.2002.tb04620.x · Cited by 20
Self-citationRumsey, L. M., Teague, R. M., Benedict, S. H., & Chan, M. A. (2001) · Experimental Cell Research · doi:10.1006/excr.2001.5272 · Cited by 18
Cited by
Sorted by citations
Controlling Cell Behavior Electrically: Current Views and Future Potential
McCaig, C., Rajnicek, A. M., Song, B., & Zhao, M. (2005) · Physiological Reviews · doi:10.1152/physrev.00020.2004 · Cited by 1,098
The pathophysiologic role of VEGF in hematologic malignancies: therapeutic implications
Podar, K., & Anderson, K. C. (2004) · Blood · doi:10.1182/blood-2004-07-2909 · Cited by 343
Obesity and cancer: existing and new hypotheses for a causal connection
Stone, T. W., McPherson, M., & Gail Darlington, L. (2018) · eBioMedicine · doi:10.1016/j.ebiom.2018.02.022 · Cited by 262
Hepatokines and metabolism: Deciphering communication from the liver
Jensen-Cody, S. O., & Potthoff, M. J. (2021) · Molecular Metabolism · doi:10.1016/j.molmet.2020.101138 · Cited by 252
Regulation of apoptosis by insulin-like growth factor (IGF)-I
Kooijman, R. (2006) · Cytokine & Growth Factor Reviews · doi:10.1016/j.cytogfr.2006.02.002 · Cited by 207
Self-citation
Metadata
- Authors
- Menu, E., Kooijman, R., Valckenborgh, E. V., Asosingh, K., Bakkus, M., Camp, B. V., & Vanderkerken, K.
- Affiliations
- Vrije Universiteit Brussel (BE)
- Corresponding author
- Vanderkerken, K
- Venue
- British Journal of Cancer
- Published
- 2004-03
- Volume
- 90
- Issue
- 5
- Pages
- 1076-1083
- ISSN
- 0007-0920 (ISSN-L)
- 1532-1827
- PMC
- PMC2409634
- OpenAlex
- W2049101520
- Cited by
- 115
- References
- 49
- Citations by year
- 2026: 3 · 2025: 3 · 2024: 4 · 2023: 5 · 2022: 3 · 2021: 3 · 2020: 7 · 2019: 4 · 2018: 4 · 2017: 1 · 2016: 3 · 2015: 4 · 2014: 5 · 2013: 8 · 2012: 3
- FWCI
- 6.92
- Type
- journal article
- Language
- en
- Open access
- hybrid
- doi.org
- Licence
- cc-by-nc-sa
- www.springer.com/tdm (unspecified)
- Locations
- British Journal of Cancer (publishedVersion, cc-by-nc-sa)
- PubMed Central (publishedVersion, cc-by)
- PubMed (publishedVersion)
- VUBIR (Vrije Universiteit Brussel) (submittedVersion)
- Funders
- Fonds Wetenschappelijk Onderzoek
- Vrije Universiteit Brussel
- Vlaamse regering
- Topics
- Health Sciences › Medicine › Hematology › Multiple Myeloma Research and Treatments
- Health Sciences › Medicine › Endocrinology, Diabetes and Metabolism › Growth Hormone and Insulin-like Growth Factors
- Life Sciences › Biochemistry, Genetics and Molecular Biology › Molecular Biology › PI3K/AKT/mTOR signaling in cancer
- Keywords
- insulin-like growth factor I, multiple myeloma, PI3K/Akt signaling, MEK/ERK signaling, VEGF secretion, cell proliferation, cell migration, angiogenesis, F-actin assembly, wortmannin, PD98059, ERK1/2 activation
- MeSH terms
- Animals, Cell Division, Cell Movement, Chemotaxis, Disease Models, Animal, Flavonoids, Humans, Insulin-Like Growth Factor I, Mice, Inbred C57BL, Multiple Myeloma, Neovascularization, Pathologic, Phosphorylation, Proto-Oncogene Proteins, Tumor Cells, Cultured, Signal Transduction, Down-Regulation, Protein Serine-Threonine Kinases, Phosphatidylinositol 3-Kinases, Mitogen-Activated Protein Kinase 1, Mitogen-Activated Protein Kinases, Mitogen-Activated Protein Kinase Kinases, Vascular Endothelial Growth Factor A, Mitogen-Activated Protein Kinase 3, Proto-Oncogene Proteins c-akt, Mice
About these checks
Registry, retraction, Cites and statistics results are computed, not judged, with one exception: a printed reference that no index lists is read once by a model before it counts as a citation error. Claims are extracted by a model and kept only when their quote appears verbatim in the text; each cited source is then checked, with a model’s help, for whether it says what the claim relies on. Those verdicts can be wrong — read the claim’s quote and the cited source before relying on one.
Statistics and arithmetic are recomputed, not judged.
Confidence bands are shown only for fields calibrated on our annotated test set. None is calibrated yet, so no band is shown.
What counts as a claim ›How we measure confidence ›How we check this ›
Are you an author, or do you see a problem with this page? Request a review
