

The DOI matches its Crossref record; 28 of the 28 references it cites were found in a registry or an index.
Many Atolls May be Uninhabitable Within Decades Due to Climate Change
Open accessAbstract
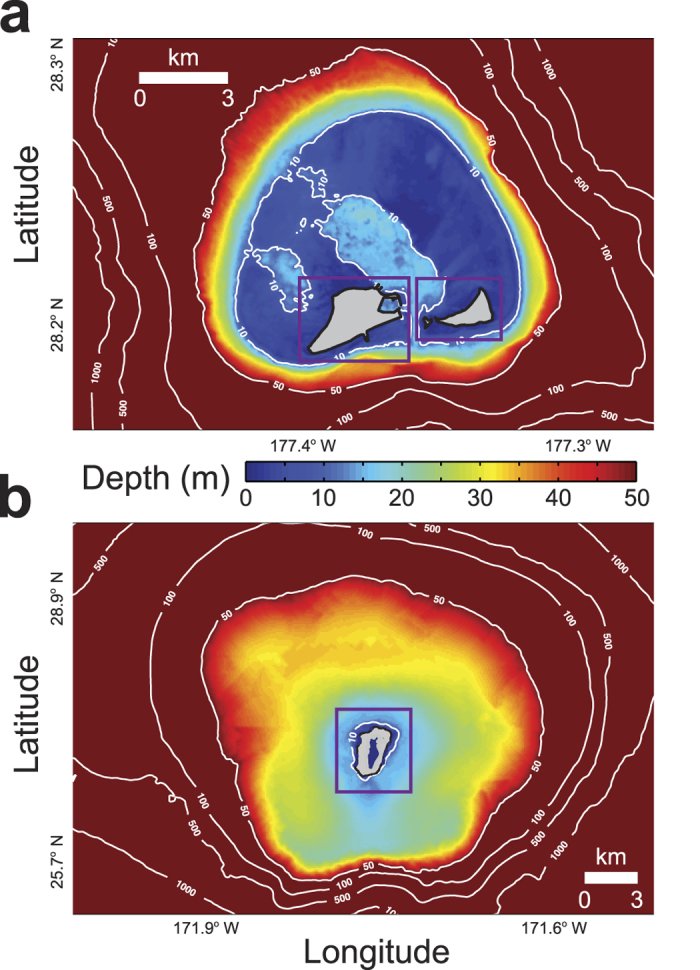
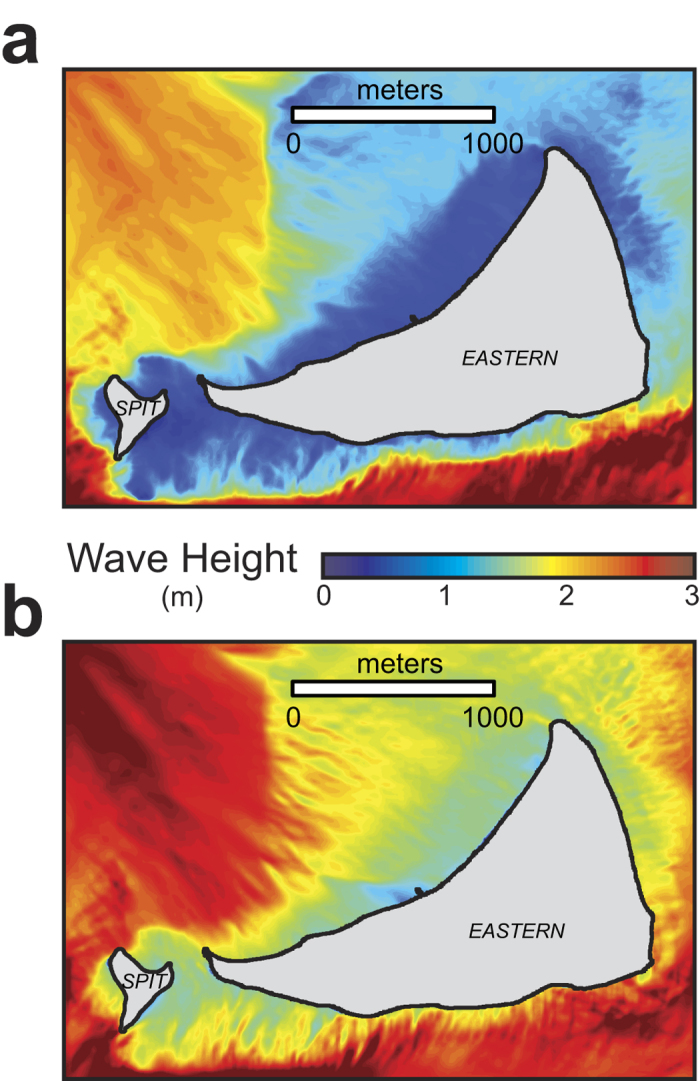
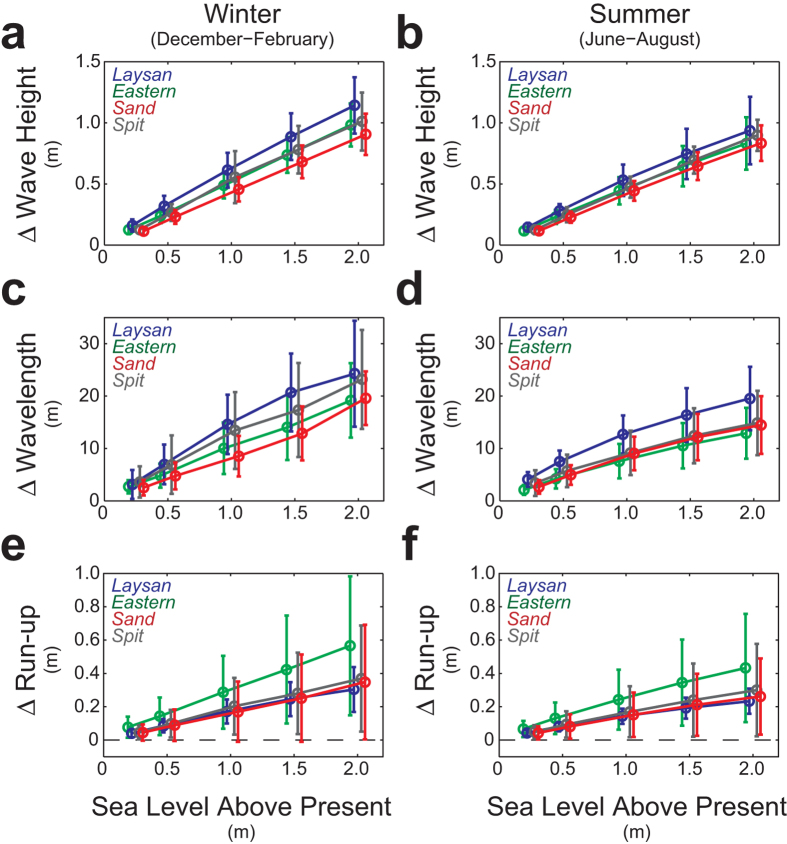
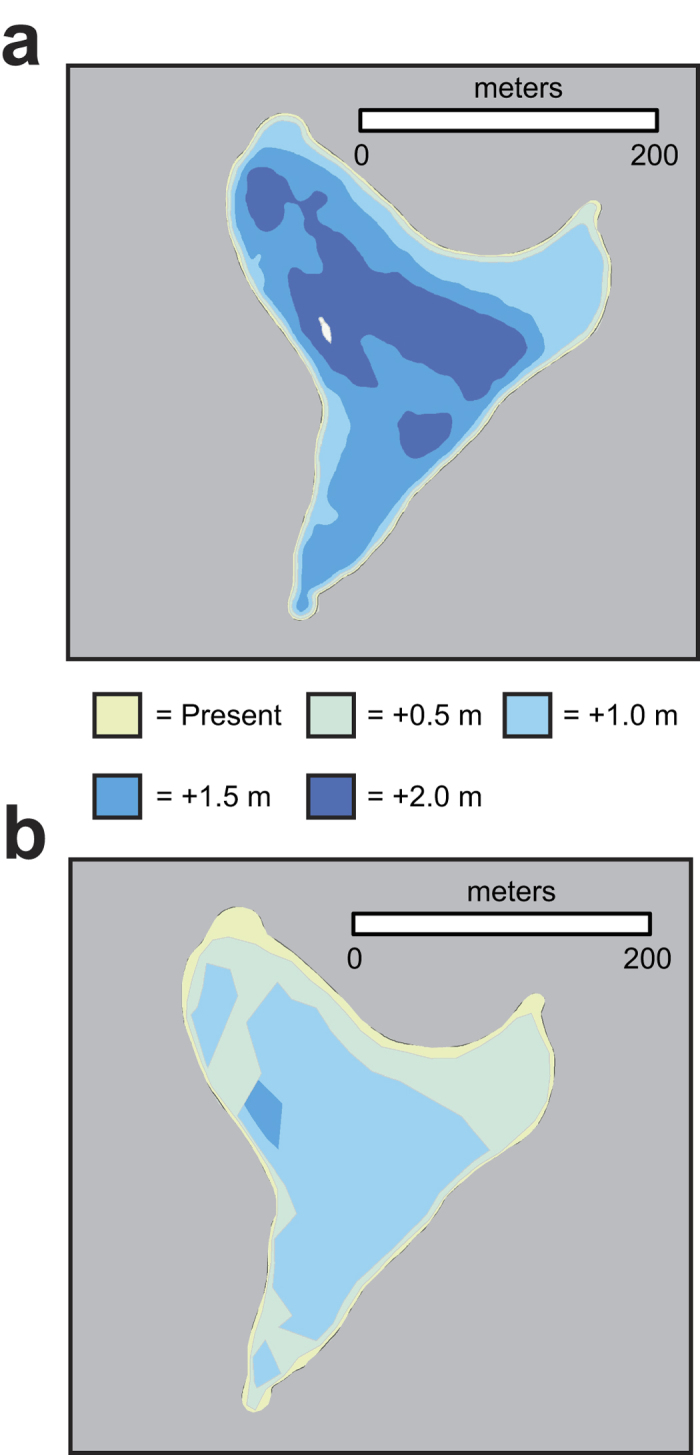
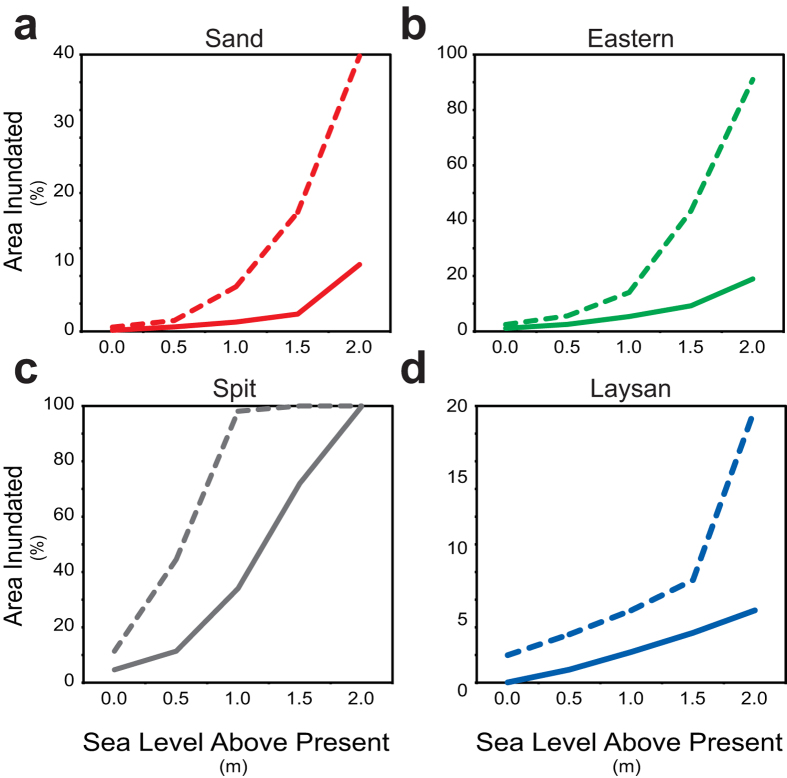
Observations show global sea level is rising due to climate change, with the highest rates in the tropical Pacific Ocean where many of the world’s low-lying atolls are located. Sea-level rise is particularly critical for low-lying carbonate reef-lined atoll islands; these islands have limited land and water available for human habitation, water and food sources and ecosystems that are vulnerable to inundation from sea-level rise. Here we demonstrate that sea-level rise will result in larger waves and higher wave-driven water levels along atoll islands’ shorelines than at present. Numerical model results reveal waves will synergistically interact with sea-level rise, causing twice as much land forecast to be flooded for a given value of sea-level rise than currently predicted by current models that do not take wave-driven water levels into account. Atolls with islands close to the shallow reef crest are more likely to be subjected to greater wave-induced run-up and flooding due to sea-level rise than those with deeper reef crests farther from the islands’ shorelines. It appears that many atoll islands will be flooded annually, salinizing the limited freshwater resources and thus likely forcing inhabitants to abandon their islands in decades, not centuries, as previously thought.
Overview
The claims and statistics of this paper haven’t been checked yet.
Run the check — free, no account needed. It reads the open-access text and checks the sources it cites.
Integrity signals
Registry
Cites
Statistics
Figures
Verification
Claims the paper makes
The claims and statistics of this paper haven’t been checked yet.
Run the check — free, no account needed. It reads the open-access text and checks the sources it cites.
Claims other papers make about this one
Each is checked against this paper’s own text: does it say what the citing paper says it does?
The source backs part of the claim, not all of it — or backs it for a different population, condition or comparison.
In the citing paper
“Displacement from these areas will be a widespread issue within a few decades [36–38].”
From Climate Change, Migration, and Civil Strife. (2020) · cites this paper as [36]
Experimental — accuracy not yet measured
Self-check
Percentages, sums and reported differences re-computed from the paper’s own numbers.
The self-check needs the paper’s full text.
Citations
Cites
A third‐generation wave model for coastal regions: 1. Model description and validation
Booij, N., Ris, R. C., & Holthuijsen, L. H. (1999) · Journal of Geophysical Research Atmospheres · doi:10.1029/98jc02622 · Cited by 4,619
Sea-Level Rise and Its Impact on Coastal Zones
Nicholls, R. J., & Cazenave, A. (2010) · Science · doi:10.1126/science.1185782 · Cited by 2,742
Global sea level linked to global temperature
Vermeer, M., & Rahmstorf, S. (2009) · Proceedings of the National Academy of Sciences · doi:10.1073/pnas.0907765106 · Cited by 1,225
A third‐generation wave model for coastal regions: 2. Verification
Ris, R. C., Holthuijsen, L. H., & Booij, N. (1999) · Journal of Geophysical Research Atmospheres · doi:10.1029/1998jc900123 · Cited by 897
Identifying the causes of sea-level change
Milne, G. A., Gehrels, W. R., Hughes, C. W., & Tamisiea, M. E. (2009) · Nature Geoscience · doi:10.1038/ngeo544 · Cited by 527
Montaggioni, L. F. (2005) · Earth-Science Reviews · doi:10.1016/j.earscirev.2005.01.002 · Cited by 485
Reconstructing sea level from paleo and projected temperatures 200 to 2100 ad
Grinsted, A., Moore, J. C., & Jevrejeva, S. (2009) · Climate Dynamics · doi:10.1007/s00382-008-0507-2 · Cited by 473
Reconstructing sea level from paleo and projected temperatures 200 to 2100AD
Grinsted, A., Moore, J. C., & Jevrejeva, S. (2009) · IOP Conference Series Earth and Environmental Science · doi:10.1088/1755-1307/6/1/012001 · Cited by 377
Reef-island topography and the vulnerability of atolls to sea-level rise
Woodroffe, C. D. (2007) · Global and Planetary Change · doi:10.1016/j.gloplacha.2007.11.001 · Cited by 326
Widespread inundation of Pacific islands triggered by distant-source wind-waves
Hoeke, R., McInnes, K. L., Krüger, J. C., McNaught, R., Hunter, J. R., & Smithers, S. G. (2013) · Global and Planetary Change · doi:10.1016/j.gloplacha.2013.06.006 · Cited by 271
Cited by
Sorted by citations
Doubling of coastal flooding frequency within decades due to sea-level rise
Vitousek, S., Barnard, P. L., Fletcher, C. H., Frazer, L. N., Erikson, L., & Storlazzi, C. D. (2017) · Scientific Reports · doi:10.1038/s41598-017-01362-7 · Cited by 925
Self-citationEarth's surface water change over the past 30 years
Donchyts, ., Baart, F., Winsemius, H., Gorelick, N., Kwadijk, J., & van de Giesen, N. (2016) · Nature Climate Change · doi:10.1038/nclimate3111 · Cited by 500
Loss of coral reef growth capacity to track future increases in sea level
Perry, C. T., Álvarez‐Filip, L., Graham, N. A. J., Mumby, P. J., Wilson, S. K., Kench, P. S., Manzello, D. P., Morgan, K. M., Slangen, A. B. A., Thomson, D. P., et al. (2018) · Nature · doi:10.1038/s41586-018-0194-z · Cited by 397
Dynamic flood modeling essential to assess the coastal impacts of climate change
Barnard, P. L., Erikson, L., Foxgrover, A. C., Hart, J. F., Limber, P. W., O'Neill, A. C., van Ormondt, M., Vitousek, S., Wood, N., Hayden, M. K., et al. (2019) · Scientific Reports · doi:10.1038/s41598-019-40742-z · Cited by 403
Coastal Adaptation to Climate Change and Sea-Level Rise
Griggs, G., & Reguero, B. G. (2021) · Water · doi:10.3390/w13162151 · Cited by 419
Sea-level rise exponentially increases coastal flood frequency
Taherkhani, M., Vitousek, S., Barnard, P. L., Frazer, L. N., Anderson, T. R., & Fletcher, C. H. (2020) · Scientific Reports · doi:10.1038/s41598-020-62188-4 · Cited by 347
Harris, D. L., Rovere, A., Casella, E., Power, H. E., Canavesio, R., Collin, A., Pomeroy, A., Webster, J. M., & Parravicini, V. (2018) · Science Advances · doi:10.1126/sciadv.aao4350 · Cited by 276
Interactions between sea-level rise and wave exposure on reef island dynamics in the Solomon Islands
Albert, S., Leon, J. X., Grinham, A. R., Church, J. A., Gibbes, B. R., & Woodroffe, C. D. (2016) · Environmental Research Letters · doi:10.1088/1748-9326/11/5/054011 · Cited by 243
“…synergistically with localised sea-level rise (through changing wave refraction dynamics and more wave energy propagating across reef crest onto the coast) to exacerbate coastal erosion (Storlazzi et al 2015) and thusmay be a key driver of the rapid coastal recession in the Solomon Islands.”
BackgroundHuman Activity and Habitat Loss: Destruction, Fragmentation, and Degradation
Scanes, C. G. (2017) · Elsevier eBooks · doi:10.1016/b978-0-12-805247-1.00026-5 · Cited by 178
Robinson, S. (2020) · Wiley Interdisciplinary Reviews Climate Change · doi:10.1002/wcc.653 · Cited by 165
Patterns of island change and persistence offer alternate adaptation pathways for atoll nations
Kench, P. S., Ford, M. R., & Owen, S. D. (2018) · Nature Communications · doi:10.1038/s41467-018-02954-1 · Cited by 163
Cheriton, O. M., Storlazzi, C. D., & Rosenberger, K. J. (2016) · Journal of Geophysical Research Oceans · doi:10.1002/2015jc011231 · Cited by 153
Self-citationImpacts of 1.5°C Global Warming on Natural and Human Systems
IPCC (2022) · Cambridge University Press eBooks · doi:10.1017/9781009157940.005 · Cited by 178
Climate Change, Migration, and Civil Strife.
Balsari, S., Dresser, C., & Leaning, J. (2020) · Current Environmental Health Reports · doi:10.1007/s40572-020-00291-4 · Cited by 135
A global assessment of atoll island planform changes over the past decades
Duvat, V. K. E. (2018) · Wiley Interdisciplinary Reviews Climate Change · doi:10.1002/wcc.557 · Cited by 132
Anderson, T. R., Fletcher, C. H., Barbee, M. M., Romine, B. M., Lemmo, S., & Delevaux, J. M. S. (2018) · Scientific Reports · doi:10.1038/s41598-018-32658-x · Cited by 127
Social and cultural issues raised by climate change in Pacific Island countries: an overview
Weir, T., Dovey, L., & Orcherton, D. F. (2016) · Regional Environmental Change · doi:10.1007/s10113-016-1012-5 · Cited by 131
“At current rates of sea level rise, this could occur within the next 30 years or so, i.e., as early as 2040 (Storlazzi et al. 2015; Weir and Virani 2011).”
BackgroundGingerich, S. B., Voss, C. I., & Johnson, A. G. (2017) · Journal of Hydrology · doi:10.1016/j.jhydrol.2017.03.001 · Cited by 118
A Bayesian‐Based System to Assess Wave‐Driven Flooding Hazards on Coral Reef‐Lined Coasts
Pearson, S. G., Storlazzi, C. D., Dongeren, A. R. V., Tissier, M. F. S., & Reniers, A. (2017) · Journal of Geophysical Research Oceans · doi:10.1002/2017jc013204 · Cited by 118
Self-citationThe value of US coral reefs for flood risk reduction
Reguero, B. G., Storlazzi, C. D., Gibbs, A. E., Shope, J. B., Cole, A. D., Cumming, K. A., & Beck, M. W. (2021) · Nature Sustainability · doi:10.1038/s41893-021-00706-6 · Cited by 118
Self-citationSea Level Change and Coastal Climate Services: The Way Forward
Cozannet, G. L., Nicholls, R. J., Hinkel, J., Sweet, W., McInnes, K. L., van de Wal, R. S. W., Slangen, A. B. A., Lowe, J. A., & White, K. D. (2017) · Journal of Marine Science and Engineering · doi:10.3390/jmse5040049 · Cited by 114
“To understand local adaptation needs Coastal vulnerability indicators [86] Detailed [66,81,87] to appropriate complexity modelling [88] Expected annual damages, adaptation needs [89–94] Critical infrastructures such as nuclear power plants [68,95] Critical settlements such as atoll islands [96,97] To assess local to r…”
Stabilization of global temperature at 1.5°C and 2.0°C: implications for coastal areas
Nicholls, R. J., Brown, S. A., Goodwin, P., Wahl, T., Lowe, J. A., Solan, M., Godbold, J. A., Haigh, I. D., Lincke, D., Hinkel, J., et al. (2018) · Philosophical Transactions of the Royal Society A Mathematical Physical and Engineering Sciences · doi:10.1098/rsta.2016.0448 · Cited by 124
“Further, species and ecosystem responses integrate multiple drivers of change [37,91], increasing the risk of negative ecosystem responses [92].”
BackgroundBrown, S. A., Nicholls, R. J., Goodwin, P., Haigh, I. D., Lincke, D., Vafeidis, A. T., & Hinkel, J. (2018) · Earth s Future · doi:10.1002/2017ef000738 · Cited by 119
“…adaptation funding needs to be considered, particularly in nations that are sensitive to SLR. Small islands are known to be highly vulnerable to climate change, particularly SLR (Albert et al., 2016; Nicholls & Cazenave, 2010; Nurse et al., 2014; Ourbak & Magnan, 2017; Storlazzi et al., 2015).”
BackgroundRigorously valuing the role of U.S. coral reefs in coastal hazard risk reduction
Storlazzi, C. D., Reguero, B. G., Cole, A. D., Lowe, E. N., Shope, J. B., Gibbs, A. E., Nickel, B. A., McCall, R., Dongeren, A. R. V., & Beck, M. W. (2019) · Antarctica A Keystone in a Changing World · doi:10.3133/ofr20191027 · Cited by 103
Self-citationDuvat, V. K. E., & Pillet, V. (2017) · Geomorphology · doi:10.1016/j.geomorph.2017.01.002 · Cited by 88
Predicting wave overtopping thresholds on coral reef-island shorelines with future sea-level rise
Beetham, E., & Kench, P. S. (2018) · Nature Communications · doi:10.1038/s41467-018-06550-1 · Cited by 79
Rapid human-driven undermining of atoll island capacity to adjust to ocean climate-related pressures
Duvat, V. K. E., & Magnan, A. (2019) · Scientific Reports · doi:10.1038/s41598-019-51468-3 · Cited by 79
“This approach allows discussing (1) the rapidity and intensity of human-driven changes, and their detrimental effects on atoll island natural dynamics and capacity to adjust to ocean climate-related pressures; (2) the high diversity of island vulnerability profiles; and (3) the reaching of “anthropogenic tipping point…”
Future Reef Growth Can Mitigate Physical Impacts of Sea‐Level Rise on Atoll Islands
Beetham, E., Kench, P. S., & Popinet, S. (2017) · Earth s Future · doi:10.1002/2017ef000589 · Cited by 76
“Future habitation on low-lying atoll islands is at risk from an increase in flooding and wave inundation associated with sea-level rise (SLR) and anthropogenic climate change (Storlazzi et al., 2015).”
BackgroundInfluentialDrivers of shoreline change in atoll reef islands of the Tuamotu Archipelago, French Polynesia
Duvat, V. K. E., Salvat, B., & Salmon, C. (2017) · Global and Planetary Change · doi:10.1016/j.gloplacha.2017.09.016 · Cited by 75
Coral Bleaching and Mortality in the Chagos Archipelago
Sheppard, C. R. C., Sheppard, A. L. S., Mogg, A. O. M., Bayley, D. T. I., Dempsey, A. C., Roche, R., TURNER, J. R. G., & Purkis, S. J. (2017) · Atoll research bulletin · doi:10.5479/si.0077-5630.613 · Cited by 66
“Warming and sea-level rise will result in greater inundation of such islands (Storlazzi et al., 2015).”
BackgroundHydrodynamics of a Tidally Forced Coral Reef Atoll
Green, R. H., Lowe, R. J., & Buckley, M. L. (2018) · Journal of Geophysical Research Oceans · doi:10.1029/2018jc013946 · Cited by 64
Fire (plus) flood (equals) beach: coastal response to an exceptional river sediment discharge event
Warrick, J. A., Vos, K., East, A. E., & Vitousek, S. (2022) · Scientific Reports · doi:10.1038/s41598-022-07209-0 · Cited by 60
Gowda, P. H., Steiner, J. L., OLSON, C. G., Boggess, M., Farrigan, T., & Grusak, M. A. (2018) · doi:10.7930/nca4.2018.ch10 · Cited by 61
Probabilistic mapping of storm-induced coastal inundation for climate change adaptation
Li, N., Yamazaki, Y., Roeber, V., Cheung, K. F., & Chock, G. Y. K. (2018) · Coastal Engineering · doi:10.1016/j.coastaleng.2017.12.013 · Cited by 59
A half-century of coastline change in Diego Garcia – The largest atoll island in the Chagos
Purkis, S. J., Gardiner, R. J., Johnston, M. W., & Sheppard, C. R. C. (2016) · Geomorphology · doi:10.1016/j.geomorph.2016.03.010 · Cited by 56
“, 2015), though some authors (e.g. Hubbard et al., 2014; Storlazzi et al., 2015) have argued to the contrary.”
BackgroundMasselink, G., Tuck, M. E., McCall, R., Dongeren, A. R. V., Ford, M. R., & Kench, P. S. (2019) · Journal of Geophysical Research Oceans · doi:10.1029/2018jc014411 · Cited by 55
Identification and classification of very low frequency waves on a coral reef flat
Gawehn, M., Dongeren, A. R. V., van Rooijen, A., Storlazzi, C. D., Cheriton, O. M., & Reniers, A. (2016) · Journal of Geophysical Research Oceans · doi:10.1002/2016jc011834 · Cited by 54
Self-citationSediment supply dampens the erosive effects of sea-level rise on reef islands
Tuck, M. E., Ford, M. R., Kench, P. S., & Masselink, G. (2021) · Scientific Reports · doi:10.1038/s41598-021-85076-x · Cited by 56
Bramante, J. F., Ashton, A. D., Storlazzi, C. D., Cheriton, O. M., & Donnelly, J. P. (2020) · Journal of Geophysical Research Earth Surface · doi:10.1029/2019jf005446 · Cited by 52
Self-citationEffect of evaporation on soil salinization caused by ocean surge inundation
Yu, X., Xin, P., & Hong, L. (2021) · Journal of Hydrology · doi:10.1016/j.jhydrol.2021.126200 · Cited by 51
Impact of Climate Change on Daily Streamflow and Its Extreme Values in Pacific Island Watersheds
Leta, O. T., El‐Kadi, A. I., & Dulai, H. (2018) · Sustainability · doi:10.3390/su10062057 · Cited by 50
1.5°C Hotspots: Climate Hazards, Vulnerabilities, and Impacts
Schleussner, C.-F., Deryng, D., D'haen, S., Hare, W., Lissner, T., Ly, M., Nauels, A., Noblet, M., Pfleiderer, P., Pringle, P., et al. (2018) · Annual Review of Environment and Resources · doi:10.1146/annurev-environ-102017-025835 · Cited by 45
“Tropical cyclones, sea level rise and coastal erosion are particularly disturbing, as encroaching seas and limited adaptive capacity threaten the very existence of many small, low elevation islands (47, 48).”
BackgroundThe importance of explicitly modelling sea-swell waves for runup on reef-lined coasts
Quataert, E., Storlazzi, C. D., Dongeren, A. R. V., & McCall, R. (2020) · Coastal Engineering · doi:10.1016/j.coastaleng.2020.103704 · Cited by 48
Self-citationShope, J. B., & Storlazzi, C. D. (2019) · Frontiers in Marine Science · doi:10.3389/fmars.2019.00245 · Cited by 45
Self-citationCoral Reef Island Initiation and Development Under Higher Than Present Sea Levels
East, H. K., Perry, C. T., Kench, P. S., Liang, C. Y., & Gulliver, P. (2018) · Geophysical Research Letters · doi:10.1029/2018gl079589 · Cited by 44
“There is thus major concern over the future existence and habitability of atoll nations (Dickinson, 2009; Storlazzi et al., 2015, 2018), within which reef islands provide the only habitable land.”
BackgroundNearshore Wave Power Increase on Reef‐Shaped Coasts Due to Sea‐Level Rise
Siegle, E., & Costa, M. B. (2017) · Earth s Future · doi:10.1002/2017ef000624 · Cited by 43
“The SWAN model has been applied successfully at several reef environments (e.g., Hoeke et al., 2011, 2013; Lowe et al., 2009; Storlazzi et al., 2015, 2011).”
MethodSengupta, M., Ford, M. R., & Kench, P. S. (2021) · Geomorphology · doi:10.1016/j.geomorph.2020.107584 · Cited by 43
de Bakker, D. M., van Duyl, F. C., Perry, C. T., & Meesters, E. H. (2019) · Global Change Biology · doi:10.1111/gcb.14800 · Cited by 41
Karnauskas, K. B., Schleussner, C., Donnelly, J. P., & Anchukaitis, K. J. (2018) · Regional Environmental Change · doi:10.1007/s10113-018-1331-9 · Cited by 39
“…to mean sea-level rise, however, islands may face additional risks by increased wave-induced run-up that may render several atoll islands uninhabitable within decades and is projected to substantially affect the freshwater lens in many others, particularly Pacific islands (Storlazzi et al. 2015).”
BackgroundModelling reef hydrodynamics and sediment mobility under sea level rise in atoll reef island systems
East, H. K., Perry, C. T., Beetham, E., Kench, P. S., & Liang, C. Y. (2020) · Global and Planetary Change · doi:10.1016/j.gloplacha.2020.103196 · Cited by 37
Shope, J. B., Storlazzi, C. D., & Hoeke, R. (2017) · Geomorphology · doi:10.1016/j.geomorph.2017.08.002 · Cited by 35
Self-citationMomentum Balance Across a Barrier Reef
Sous, D., Dodet, G., Bouchette, F., & Tissier, M. F. S. (2020) · Journal of Geophysical Research Oceans · doi:10.1029/2019jc015503 · Cited by 34
“Two major consequences of reef degradation are the increase of wave-driven flooding events (Storlazzi et al., 2015) and the deterioration of reef ecosystems and biological productivity.”
BackgroundDuce, S. J., Vila‐Concejo, A., McCarroll, R. J., Yiu, B., Perris, L., & Webster, J. M. (2022) · Geomorphology · doi:10.1016/j.geomorph.2022.108365 · Cited by 34
Storlazzi, C. D., Reguero, B. G., Alkins, K. C., Shope, J. B., Camila Gaido, L., Viehman, T. S., & Beck, M. W. (2025) · Science Advances · doi:10.1126/sciadv.adn4004 · Cited by 33
Self-citationAccurate Bathymetric Maps From Underwater Digital Imagery Without Ground Control
Hatcher, G. A., Warrick, J. A., Ritchie, A. C., Dailey, E. T., Zawada, D. G., Kranenburg, C. J., & Yates, K. K. (2020) · Frontiers in Marine Science · doi:10.3389/fmars.2020.00525 · Cited by 33
Physical and numerical modeling of random wave transformation and overtopping on reef topography
Liu, Y., Li, S., Liao, Z., & Liu, K. (2020) · Ocean Engineering · doi:10.1016/j.oceaneng.2020.108390 · Cited by 33
Random wave overtopping of vertical seawalls on coral reefs
Liu, Y., Li, S., Chen, S., Hu, C., Fan, Z., & Jin, R. (2020) · Applied Ocean Research · doi:10.1016/j.apor.2020.102166 · Cited by 31
Variability of depth-limited waves in coral reef surf zones
Harris, D. L., Power, H. E., Kinsela, M. A., Webster, J. M., & Vila‐Concejo, A. (2018) · Estuarine Coastal and Shelf Science · doi:10.1016/j.ecss.2018.06.010 · Cited by 30
Owen, S. D., Kench, P. S., & Ford, M. R. (2016) · Applied Geography · doi:10.1016/j.apgeog.2016.05.004 · Cited by 29
Physical modelling of reef island topographic response to rising sea levels
Tuck, M. E., Ford, M. R., Masselink, G., & Kench, P. S. (2019) · Geomorphology · doi:10.1016/j.geomorph.2019.106833 · Cited by 29
Sadai, S., Spector, R. A., DeConto, R. M., & Gomez, N. (2022) · Earth s Future · doi:10.1029/2022ef002940 · Cited by 28
“Wave impacts can also double the inundation area, which could make some atolls uninhabitable within decades (Storlazzi et al., 2015).”
BackgroundHydro-Morphological Characterization of Coral Reefs for Wave Runup Prediction
Scott, F., Antolínez, J. A. Á., McCall, R., Storlazzi, C. D., Reniers, A., & Pearson, S. G. (2020) · Frontiers in Marine Science · doi:10.3389/fmars.2020.00361 · Cited by 28
“Flooding of coral reef-lined coasts affects thousands of vulnerable communities around the world, and climate change induced sea level rise (SLR) and coral degradation are going to continue to intensify the magnitude and frequency of hazardous flooding events (Ferrario et al., 2014; Quataert et al., 2015; Storlazzi et…”
BackgroundSelf-citationDavid, C. G., Hennig, A., Ratter, B., Roeber, V., Zahid, ., & Schlurmann, T. (2021) · Nature Communications · doi:10.1038/s41467-021-26082-5 · Cited by 28
“The first survey focused on four topics: (1) the local’s understanding of the environment and the coast, (2) their perception of environmental issues with a focus on climate change impacts and comprehension of responsibilities for action, (3) the locals’ perspectives on community life, and (4) their perspectives and a…”
InfluentialKlaver, S., Nederhoff, K., Giardino, A., Tissier, M. F. S., Dongeren, A. R. V., & van der Spek, A. (2019) · Journal of Geophysical Research Oceans · doi:10.1029/2018jc014165 · Cited by 27
“The impact of climate change is likely to be increasingly present for small island developing states, as some states face the possibility of losing land area due to its effects, such as coastal erosion and sea level rise (Grady et al., 2013; Storlazzi et al., 2015).”
BackgroundAlsumaiei, A. A., & Bailey, R. T. (2018) · Hydrological Processes · doi:10.1002/hyp.11480 · Cited by 26
“Furthermore, the study performed by Storlazzi, Elias, and Berkowitz (2015) shows that the effect on low islands can be even more significant due to the interaction between higher energy waves and SLR, leading to more inundation than expected.”
MethodWave refraction and reef island stability under rising sea level
Costa, M. B., de Macedo, E. C., & Siegle, E. (2018) · Global and Planetary Change · doi:10.1016/j.gloplacha.2018.10.015 · Cited by 26
Sengupta, M., Ford, M. R., & Kench, P. S. (2021) · Geomorphology · doi:10.1016/j.geomorph.2021.107831 · Cited by 26
Habitability for a connected, unequal and changing world
Sterly, H., Borderon, M., Sakdapolrak, P., Adger, W. N., Ayanlade, A., Bah, A., Blocher, J. M., Blondin, S., Boly, S., Brochier, T., et al. (2024) · Global Environmental Change · doi:10.1016/j.gloenvcha.2024.102953 · Cited by 28
Perkins, R. M., & Krause, S. M. (2018) · Island Studies Journal · doi:10.24043/isj.51 · Cited by 25
“Conversely, the latter’s extremely small size, coralline soils, and shallow freshwater lenses may result in their being uninhabitable in the next few decades (e.g., Nunn, 2013; Storlazzi et al., 2015).”
BackgroundMontaggioni, L. F., Salvat, B., Aubanel, A., Pons‐Branchu, E., Martin‐Garin, B., Dapoigny, A., & Goeldner‐Gianella, L. (2019) · Quaternary Science Reviews · doi:10.1016/j.quascirev.2019.105947 · Cited by 25
Morphodynamic Controls for Growth and Evolution of a Rubble Coral Island
Talavera, L., Vila‐Concejo, A., Webster, J. M., Smith, C., Duce, S. J., Fellowes, T., Salles, T. B., Harris, D. L., Hill, J., Figueira, W. F., et al. (2021) · Remote Sensing · doi:10.3390/rs13081582 · Cited by 24
Hejazian, M., Gurdak, J. J., Swarzenski, P. W., Odigie, K. O., & Storlazzi, C. D. (2017) · Applied Geochemistry · doi:10.1016/j.apgeochem.2017.03.006 · Cited by 24
Self-citationRethinking Reef Island Stability in Relation to Anthropogenic Sea Level Rise
Kane, H. H., & Fletcher, C. H. (2020) · Earth s Future · doi:10.1029/2020ef001525 · Cited by 23
“Despite many accounts of atoll island vulnerability (Dickinson, 2009; Quataert et al., 2015; Storlazzi et al., 2015), some geological and historical records have been interpreted to suggest that atoll islands are resilient to ASLR (Kench et al., 2015, 2018; Webb & Kench, 2010).”
BackgroundImproved drag coefficient and settling velocity for carbonate sands
Riazi, A., Vila‐Concejo, A., Salles, T. B., & Türker, U. (2020) · Scientific Reports · doi:10.1038/s41598-020-65741-3 · Cited by 23
BinWaves: An additive hybrid method to downscale directional wave spectra to nearshore areas
Cagigal, L., Mendez, F. J., Ricondo, A., Gutiérrez-Barceló, D., Bosserelle, C., & Hoeke, R. (2024) · Ocean Modelling · doi:10.1016/j.ocemod.2024.102346 · Cited by 22
Barrett, S., & Webster, J. M. (2017) · Marine Geology · doi:10.1016/j.margeo.2017.07.007 · Cited by 22
Liu, Y., Li, S., Zhao, X. G., Hu, C., Fan, Z., & Chen, S. (2020) · Journal of Waterway Port Coastal and Ocean Engineering · doi:10.1061/(asce)ww.1943-5460.0000575 · Cited by 20
Storlazzi, C. D., Reguero, B. G., Cumming, K. A., Cole, A. D., Shope, J. B., Camila Gaido, L., Viehman, T. S., Nickel, B. A., & Beck, M. W. (2021) · Antarctica A Keystone in a Changing World · doi:10.3133/ofr20211054 · Cited by 22
Self-citationBernard, L., Petterson, M. G., Schofield, C., & Kaye, S. B. (2021) · Geosciences · doi:10.3390/geosciences11090394 · Cited by 21
Leta, O. T., & Bauwens, W. (2018) · Hydrology · doi:10.3390/hydrology5030038 · Cited by 20
Montaggioni, L. F., Salvat, B., Aubanel, A., Eisenhauer, A., & Martin‐Garin, B. (2018) · Geomorphology · doi:10.1016/j.geomorph.2018.06.015 · Cited by 20
Multi-decadal atoll-island dynamics in the Indian Ocean Chagos Archipelago
Wu, M., Duvat, V. K. E., & Purkis, S. J. (2021) · Global and Planetary Change · doi:10.1016/j.gloplacha.2021.103519 · Cited by 20
“, 2019), though some argue to the contrary (Hubbard et al., 2014; Storlazzi et al., 2015).”
BackgroundPlanimetric and volumetric changes of reef islands in response to wave conditions
Costa, M. B., de Macedo, E. C., & Siegle, E. (2017) · Earth Surface Processes and Landforms · doi:10.1002/esp.4215 · Cited by 19
“With rising water depth over the reef, larger waves can impact the island’s shoreline (Storlazzi et al., 2015).”
BackgroundBritish Indian Ocean Territory (Chagos Archipelago)
Sheppard, C. R. C., & Sheppard, A. L. S. (2018) · Elsevier eBooks · doi:10.1016/b978-0-08-100853-9.00015-4 · Cited by 18
Stanley, S. K., & Williamson, J. (2021) · Environmental Politics · doi:10.1080/09644016.2021.1892982 · Cited by 18
“© 2021 Informa UK Limited, trading as Taylor & Francis Group (Storlazzi et al. 2015, 2018).”
BackgroundJennath, A., Krishnan, A., Paul, S. K., & Bhaskaran, P. K. (2021) · Regional Studies in Marine Science · doi:10.1016/j.rsma.2021.101793 · Cited by 17
Rigorously valuing the impact of projected coral reef degradation on coastal hazard risk in Florida
Storlazzi, C. D., Reguero, B. G., Yates, K. K., Cumming, K. A., Cole, A. D., Shope, J. B., Camila Gaido, L., Zawada, D. G., Arsenault, S. R., Fehr, Z. W., et al. (2021) · Antarctica A Keystone in a Changing World · doi:10.3133/ofr20211055 · Cited by 17
Self-citationLeslie, H., & Wild, K. (2017) · The Pacific Review · doi:10.1080/09512748.2017.1305984 · Cited by 16
Camila Gaido, L., Nederhoff, K., Storlazzi, C. D., Reguero, B. G., & Beck, M. W. (2024) · Ocean Modelling · doi:10.1016/j.ocemod.2024.102358 · Cited by 15
Self-citationPerris, L., Salles, T. B., Fellowes, T., Duce, S. J., Webster, J. M., & Vila‐Concejo, A. (2024) · Journal of Geophysical Research Earth Surface · doi:10.1029/2023jf007424 · Cited by 15
“An increase in wave transmission at the reef crest of this magnitude would have significant impacts on coral reef islands and reef‐lined shores (Fellowes et al., 2022; Storlazzi et al., 2015; Talavera et al., 2021).”
Climate Change and Ocean Governance
(2019) · Cambridge University Press eBooks · doi:10.1017/9781108502238 · Cited by 15
Montaggioni, L. F., Martin‐Garin, B., Salvat, B., Aubanel, A., Pons‐Branchu, E., Paterne, M., & Richard, M. (2021) · Marine Geology · doi:10.1016/j.margeo.2021.106500 · Cited by 14
Meta‐Study of Carbonate Sediment Delivery Rates to Indo‐Pacific Coral Reef Islands
Ainési, B., Masselink, G., & Kench, P. S. (2024) · Geophysical Research Letters · doi:10.1029/2023gl105610 · Cited by 14
Climate Change, Migration, and Vulnerability: Overview of the Special Issue
Nakayama, M., Drinkall, S., & Sasaki, D. (2019) · Journal of Disaster Research · doi:10.20965/jdr.2019.p1246 · Cited by 14
Keener, V. W., Helweg, D. A., Asam, S., Balwani, S., Burkett, M., Fletcher, C. H., Giambelluca, T. W., Grecni, Z. N., Nobrega-Olivera, M., Polovina, J. J., et al. (2018) · doi:10.7930/nca4.2018.ch27 · Cited by 18
Water column contributions to coral reef productivity: overcoming challenges of context dependence
Shakya, A. W., & Allgeier, J. E. (2023) · Biological reviews/Biological reviews of the Cambridge Philosophical Society · doi:10.1111/brv.12984 · Cited by 13
Sea-level rise and flood mapping: a review of models for coastal management
Déguénon, S. D. D. M., Adade, R., Teka, O., Aheto, D. W., & SINSIN, B. A. (2023) · Natural Hazards · doi:10.1007/s11069-023-06225-1 · Cited by 13
“…zones (Oppenheimer et al. 2019), including (i) persistent land submergence as a result of rising mean sea levels or mean high tides (IPPC 2019; Storlazzi et al. 2015, 2018b); (ii) coastal flooding that is more regular or powerful (Hsiao et al. 2021; Vitousek et al. 2017); (iii) increased…”
Liu, J., Huang, R., Yu, K., & Zou, B. (2020) · Geomorphology · doi:10.1016/j.geomorph.2020.107423 · Cited by 13
McGinley, K., Robertson, G. C., & Friday, K. (2019) · Forests · doi:10.3390/f10110946 · Cited by 13
Gesch, D. B., Pălășeanu-Lovejoy, M., Danielson, J. J., Fletcher, C. H., Kottermair, M., Barbee, M. M., & Jalandoni, A. (2020) · Remote Sensing · doi:10.3390/rs12010154 · Cited by 13
Metadata
- Authors
- Storlazzi, C. D., Elias, E. P. L., & Berkowitz, P.
- Affiliations
- Pacific Coastal and Marine Science Center (US)
- University of Hawaii at Hilo (US)
- Corresponding author
- Storlazzi, Curt D.
- Venue
- Scientific Reports
- Published
- 2015-09-25
- Volume
- 5
- Issue
- 1
- Pages
- 14546-14546
- ISSN
- 2045-2322 (ISSN-L)
- PMC
- PMC4585922
- OpenAlex
- W1843479630
- Cited by
- 191
- References
- 28
- Citations by year
- 2026: 12 · 2025: 12 · 2024: 14 · 2023: 13 · 2022: 17 · 2021: 20 · 2020: 23 · 2019: 19 · 2018: 28 · 2017: 21 · 2016: 12
- FWCI
- 25.03
- Type
- journal article
- Language
- en
- Open access
- gold
- doi.org
- Locations
- Scientific Reports (publishedVersion, cc-by)
- PubMed Central (publishedVersion, cc-by)
- PubMed (publishedVersion)
- Funders
- U.S. Fish and Wildlife Service
- U.S. Geological Survey
- Topics
- Physical Sciences › Earth and Planetary Sciences › Earth-Surface Processes › Coastal and Marine Dynamics
- Social Sciences › Sociology and Political Science › Climate Change, Adaptation, Migration
- Physical Sciences › Environmental Science › Ecology › Coral and Marine Ecosystems Studies
- Keywords
- atolls, sea level rise, wave run-up, coastal flooding, salinization, freshwater resources, climate change impacts, tropical Pacific islands
- MeSH terms
- Models, Theoretical, Pacific Ocean, Ecosystem, Climate Change, Islands
About these checks
Registry, retraction, Cites and statistics results are computed, not judged, with one exception: a printed reference that no index lists is read once by a model before it counts as a citation error. Claims are extracted by a model and kept only when their quote appears verbatim in the text; each cited source is then checked, with a model’s help, for whether it says what the claim relies on. Those verdicts can be wrong — read the claim’s quote and the cited source before relying on one.
Statistics and arithmetic are recomputed, not judged.
Confidence bands are shown only for fields calibrated on our annotated test set. None is calibrated yet, so no band is shown.
What counts as a claim ›How we measure confidence ›How we check this ›
Are you an author, or do you see a problem with this page? Request a review
